. 2016 Apr;1860(4):765-74.
doi: 10.1016/j.bbagen.2015.12.013. Epub 2015 Dec 23.

Occludin deficiency promotes ethanol-induced disruption of colonic epithelial junctions, gut barrier dysfunction and liver damage in mice

Affiliations

Occludin deficiency promotes ethanol-induced disruption of colonic epithelial junctions, gut barrier dysfunction and liver damage in mice

Hina Mir et al. Biochim Biophys Acta. 2016 Apr.

Abstract

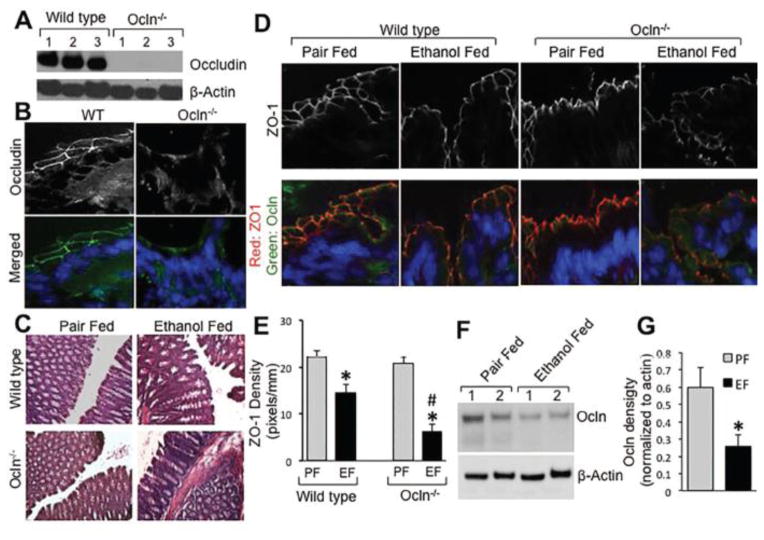
Background: Disruption of epithelial tight junctions (TJ), gut barrier dysfunction and endotoxemia play crucial role in the pathogenesis of alcoholic tissue injury. Occludin, a transmembrane protein of TJ, is depleted in colon by alcohol. However, it is unknown whether occludin depletion influences alcoholic gut and liver injury.

Methods: Wild type (WT) and occludin deficient (Ocln(-/-)) mice were fed 1-6% ethanol in Lieber-DeCarli diet. Gut permeability was measured by vascular-to-luminal flux of FITC-inulin. Junctional integrity was analyzed by confocal microscopy. Liver injury was assessed by plasma transaminase, histopathology and triglyceride analyses. The effect of occludin depletion on acetaldehyde-induced TJ disruption was confirmed in Caco-2 cell monolayers.

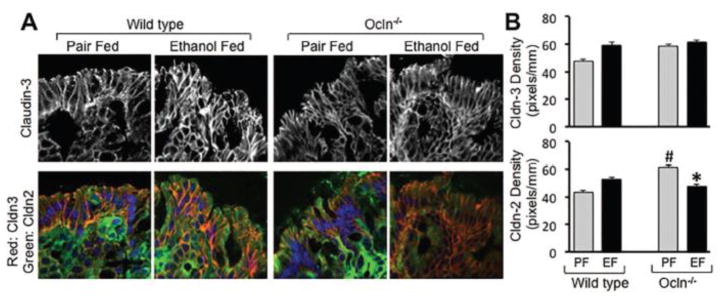
Results: Ethanol feeding significantly reduced body weight gain in Ocln(-/-) mice. Ethanol increased inulin permeability in colon of both WT and Ocln(-/-) mice, but the effect was 4-fold higher in Ocln(-/-) mice. The gross morphology of colonic mucosa was unaltered, but ethanol disrupted the actin cytoskeleton, induced redistribution of occludin, ZO-1, E-cadherin and β-catenin from the junctions and elevated TLR4, which was more severe in Ocln(-/-) mice. Occludin knockdown significantly enhanced acetaldehyde-induced TJ disruption and barrier dysfunction in Caco-2 cell monolayers. Ethanol significantly increased liver weight and plasma transaminase activity in Ocln(-/-) mice, but not in WT mice. Histological analysis indicated more severe lesions and fat deposition in the liver of ethanol-fed Ocln(-/-) mice. Ethanol-induced elevation of liver triglyceride was also higher in Ocln(-/-) mice.

Conclusion: This study indicates that occludin deficiency increases susceptibility to ethanol-induced colonic mucosal barrier dysfunction and liver damage in mice.

Keywords: Actin; Adherens junction; Alcohol; Claudin; Fatty liver; Tight junction.


Figures

Figure 1
Figure 1. Effect of chronic ethanol feeding on diet intake and body weight of occludin deficient mice
Adult wild type and occludin knockout (Ocln−/−) mice were fed ethanol in Lieber DeCarli liquid diet (1–6%) (●) over 4-week period. Control mice were pair fed with isocaloric ethanol-free diet (○). Diet intake (A & B) and body weights (C & D) were recorded. Values are mean ± SEM (n = 11–15 as indicated in Methods section). Asterisks indicate the values for ethanol fed groups are significantly (p<0.05) different from the corresponding pair fed group values.
Figure 2
Figure 2. Chronic ethanol feeding induces colonic mucosal barrier dysfunction more severely in occludin deficient mice
Adult wild type (WT) and occludin knockout (Ocln−/−) mice were fed ethanol (1–6%) (EF) in Lieber DeCarli liquid diet for 4 weeks. Control mice were pair fed with isocaloric ethanol-free diet (PF). Mucosal permeability of colon and ileum was evaluated by measuring vascular-to-luminal flux of FITC-inulin in vivo. Values for distal colon (A), proximal colon (B) and ileum (C) are mean ± SEM (n as indicated in the figure). Colonic sections were stained for TLR4 by immunofluorescence method (D). Fluorescence density was evaluated (E); values are mean ± SEM (n = 4). Asterisks in all graphs indicate the values that are significantly (p<0.05) different from the corresponding values for PF group. Hash tags indicate the values that are significantly different from corresponding values for WT group.
Figure 3
Figure 3. Chronic ethanol feeding disrupts colonic epithelial TJ more severely in occludin deficient mice
Adult wild type and occludin knockout (Ocln−/−) mice were fed ethanol (1–6%) (EF) in Lieber DeCarli liquid diet for 4 weeks. Control mice were pair fed with isocaloric ethanol-free diet (PF). Absence of occludin in Ocln−/− mice was confirmed by immunoblot analysis (A) and immunofluorescence staining (B). Gross mucosal morphology was examined by light microscopy of H & E stained colonic sections (C). Cryosections of distal colon was stained for occludin and ZO-1 by immunofluorescence method and confocal microscopy (D). The merged images represent overlay of occludin (green), ZO-1 (red) and nucleus (blue). ZO-1 fluorescence in the epithelial cells was evaluated by densitometry using Image J (E). Densitometric values are mean ± SEM (n = 4). Asterisks indicate the values for ethanol fed groups are significantly different from the corresponding values for pair fed group, and the pound symbol indicates the value that is significantly (p<0.05) different from corresponding value for wild type mice. Colonic mucosal extracts from pair fed and ethanol fed wild type mice were immunoblotted for occludin and β-actin (F). Occludin band density was measured and normalized to the density of corresponding band for β-actin (G). Values are mean ± SEM (n = 5). Asterisks indicate the value for ethanol fed group is significantly (p<0.05) different from the corresponding value for pair fed group.
Figure 4
Figure 4. Effect of ethanol feeding on Cldn-2 and Cldn-3 in colonic epithelium
Adult wild type and Ocln−/− mice were fed ethanol (1–6%) (EF) in Lieber DeCarli liquid diet for 4 weeks. Control mice were pair fed with isocaloric ethanol-free diet (PF). Cryosections of distal colon were stained for Cldn-2 and Cldn-3 by immunofluorescence method and confocal images were captured (A). The merged images represent overlay of Cldn-2 (green), Cldn-3 (red) and nucleus (blue). Fluorescence for Cldn-2 and Cldn-3 was evaluated by densitometry using Image J (B). Densitometric values are mean ± SEM (n = 5). Asterisk indicates the value for ethanol fed group is significantly different from the corresponding value for pair fed group, and the pound symbol indicates the value that is significantly (p<0.05) different from corresponding value for wild type mice.
Figure 5
Figure 5. Ethanol-induced disruption of colonic epithelial adherens junction is more severe in occludin deficient mice
Adult wild type and Ocln−/− mice were fed ethanol (1–6%) (EF) in Lieber DeCarli liquid diet for 4 weeks. Control mice were pair fed with isocaloric ethanol-free diet (PF). Cryosections of distal colon were stained for E-cadherin and β-catenin by immunofluorescence method and confocal images were captured (A). The merged images represent overlay of E-cadherin (green), β-catenin (red) and nucleus (blue). Fluorescence for β-catenin was evaluated by densitometry using Image J (B). Densitometric values are mean ± SEM (n = 5). Asterisk indicates the value for ethanol fed group that is significantly (p<0.05) different from the corresponding value for pair fed group.
Figure 6
Figure 6. Effect of ethanol feeding on colonic epithelial actin cytoskeleton
Adult wild type and Ocln−/− mice were fed ethanol (1–6%) (EF) in Lieber DeCarli liquid diet for 4 weeks. Control mice were pair fed with isocaloric ethanol-free diet (PF). Cryosections of distal colon were stained for F-actin by immunofluorescence method and confocal images were captured (A). The merged images represent overlay of F-actin (green) and nucleus (blue). Fluorescence for F-actin was evaluated by densitometry using Image J (B). Densitometric values are mean ± SEM (n = 5). Asterisks indicate the values for ethanol fed group that are significantly (p<0.05) different from the corresponding values for pair fed group.
Figure 7
Figure 7. Effect of occludin knockdown on ethanol-induced TJ disruption in Caco-2 cells
Caco-2 cells were transfected with occludin-specific shRNA or control RNA. Control RNA and shRNA-transfected cells on transwells were treated with 200 μM acetaldehyde for 4 hours. Cell extracts were immunoblotted for occludin and β-actin (A). TER (B) and inulin permeability (C) were measured, and fixed cell monolayers were stained for occludin and ZO-1 (D). Values are mean ± SEM (n = 6). Asterisks indicate the values that are significantly (p<0.05) different from corresponding value for control RNA-transfected cell monolayers. Hash tags indicate the values that are significantly (p<0.05) different from corresponding values for sham-treated control cell monolayers.
Figure 8
Figure 8. Effect of chronic ethanol feeding on liver
Adult wild type and Ocln−/− mice were fed ethanol (1–6%) (EF) in Lieber DeCarli liquid diet for 4 weeks. Control mice were pair fed with isocaloric ethanol-free diet (PF). Liver weights were recorded (A) and plasma ALT activity was measured (B). Values are mean ± SEM (n as indicated in the figure). Asterisks indicate the values for ethanol fed groups that are significantly (p<0.05) different from the corresponding values for pair fed group. Paraffin sections of liver were stained with H & E (C).
Figure 9
Figure 9. Ethanol-induced fat deposition in liver is more sever in occludin deficient mice
Adult wild type and Ocln−/− mice were fed ethanol (1–6%) (EF) in Lieber DeCarli liquid diet for 4 weeks. Control mice were pair fed with isocaloric ethanol-free diet (PF). Cryo-sections of liver were stained with Oil Red-O (A), and triglyceride contents in liver extracts were measured by spectrophotometric assay (B). Values are mean ± SEM (n as indicated in the figure). Paraffin sections of liver were stained with Picro-Serius Red (C).

References

    1. Rao R. Endotoxemia and gut barrier dysfunction in alcoholic liver disease. Hepatology. 2009;50:638–644. - PMC - PubMed
    1. Rao RK, Seth A, Sheth P. Recent Advances in Alcoholic Liver Disease I. Role of intestinal permeability and endotoxemia in alcoholic liver disease. Am J Physiol Gastrointest Liver Physiol. 2004;286:G881–884. - PubMed
    1. Atkinson KJ, Rao RK. Role of protein tyrosine phosphorylation in acetaldehyde-induced disruption of epithelial. Am J Physiol Gastrointest Liver Physiol. 2001;280:G1280–1288. - PubMed
    1. Ma TY, Nguyen D, Bui V, Nguyen H, Hoa N. Ethanol modulation of intestinal epithelial tight junction barrier. Am J Physiol. 1999;276:G965–974. - PubMed
    1. Sheth P, Seth A, Atkinson KJ, Gheyi T, Kale G, Giorgianni F, Desiderio DM, Li C, Naren A, Rao R. Acetaldehyde dissociates the PTP1B-E-cadherin-beta-catenin complex in Caco-2 cell monolayers by a phosphorylation-dependent mechanism. Biochem J. 2007;402:291–300. - PMC - PubMed

Publication types

MeSH terms