. 2017 Jan;37(1):227-240.
doi: 10.1177/0271678X15622463. Epub 2015 Dec 31.

Abnormal myosin phosphatase targeting subunit 1 phosphorylation and actin polymerization contribute to impaired myogenic regulation of cerebral arterial diameter in the type 2 diabetic Goto-Kakizaki rat

Affiliations

Abnormal myosin phosphatase targeting subunit 1 phosphorylation and actin polymerization contribute to impaired myogenic regulation of cerebral arterial diameter in the type 2 diabetic Goto-Kakizaki rat

Khaled S Abd-Elrahman et al. J Cereb Blood Flow Metab. 2017 Jan.

Abstract

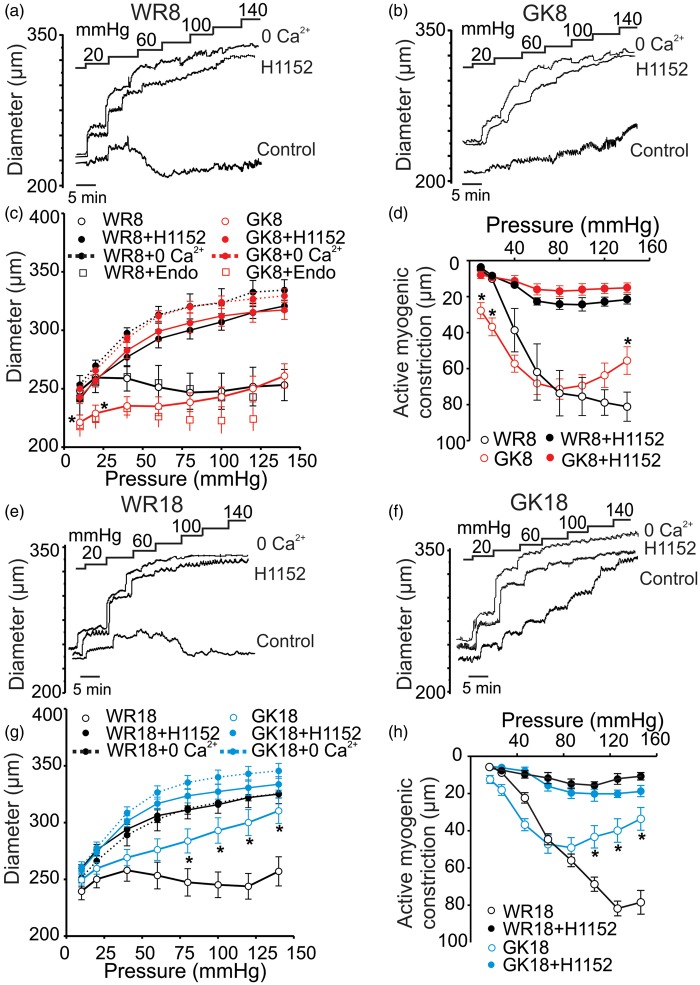
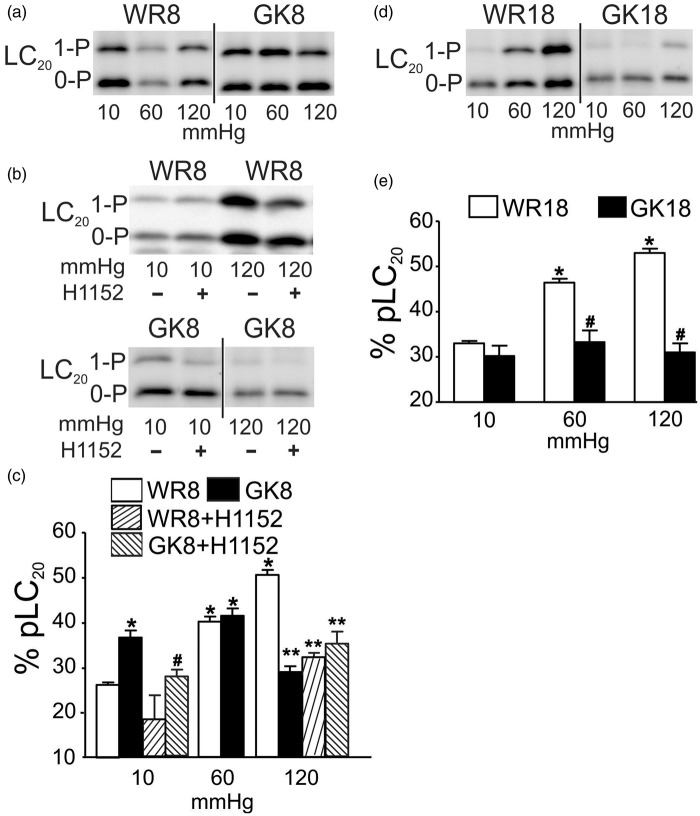
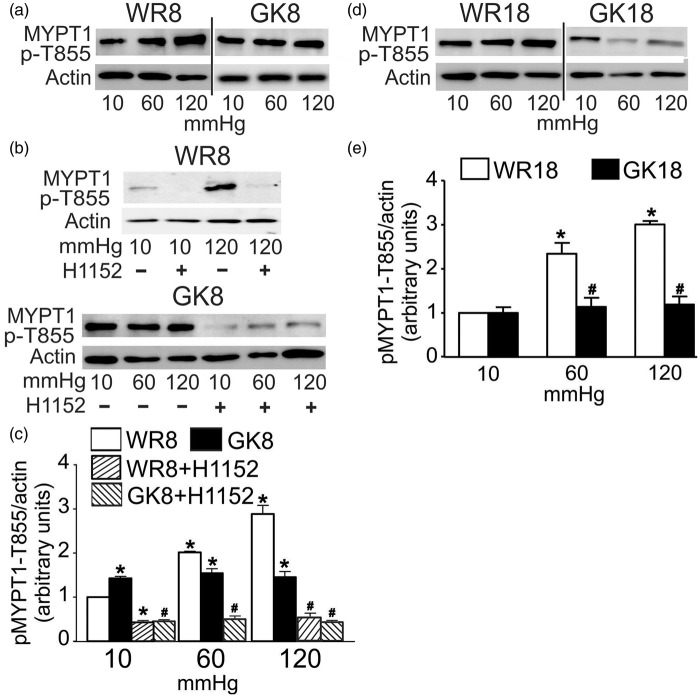
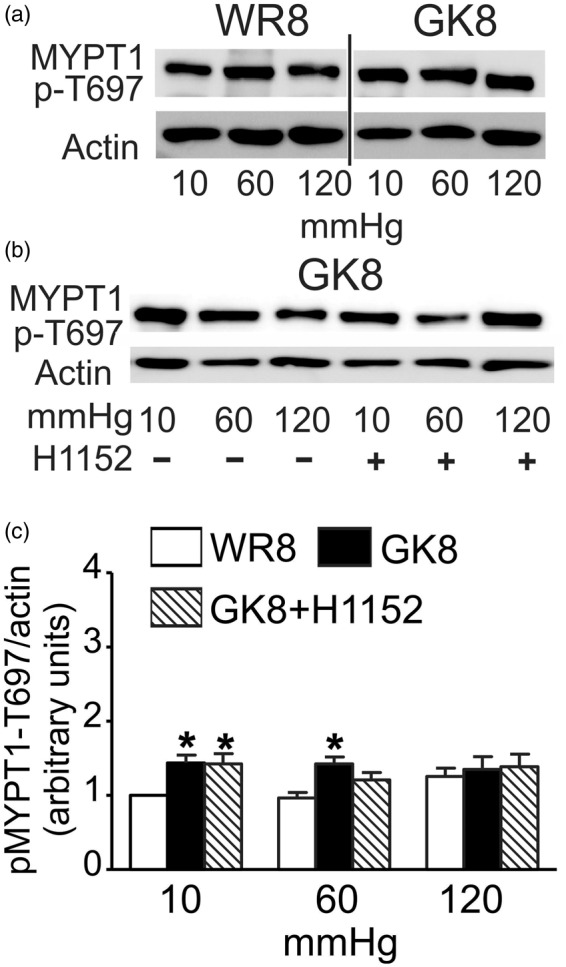
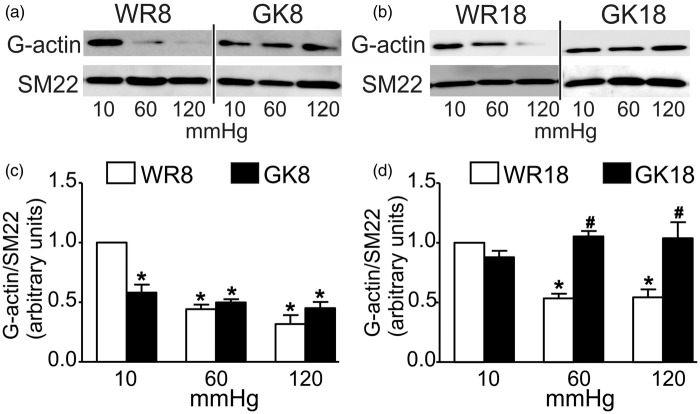
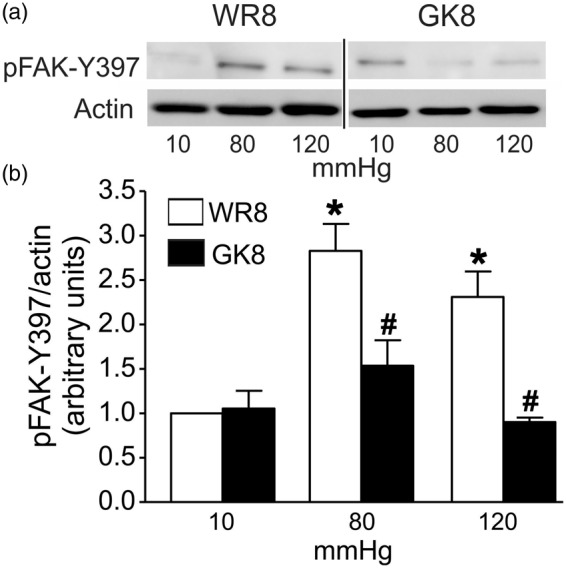
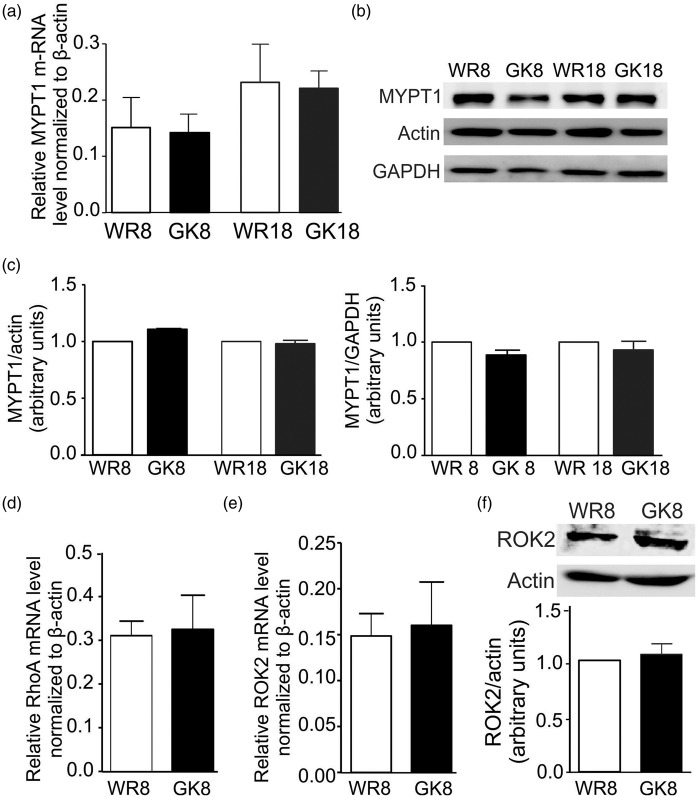
The myogenic response of cerebral resistance arterial smooth muscle to intraluminal pressure elevation is a key physiological mechanism regulating blood flow to the brain. Rho-associated kinase plays a critical role in the myogenic response by activating Ca2+ sensitization mechanisms: (i) Rho-associated kinase inhibits myosin light chain phosphatase by phosphorylating its targeting subunit myosin phosphatase targeting subunit 1 (at T855), augmenting 20 kDa myosin regulatory light chain (LC20) phosphorylation and force generation; and (ii) Rho-associated kinase stimulates cytoskeletal actin polymerization, enhancing force transmission to the cell membrane. Here, we tested the hypothesis that abnormal Rho-associated kinase-mediated myosin light chain phosphatase regulation underlies the dysfunctional cerebral myogenic response of the Goto-Kakizaki rat model of type 2 diabetes. Basal levels of myogenic tone, LC20, and MYPT1-T855 phosphorylation were elevated and G-actin content was reduced in arteries of pre-diabetic 8-10 weeks Goto-Kakizaki rats with normal serum insulin and glucose levels. Pressure-dependent myogenic constriction, LC20, and myosin phosphatase targeting subunit 1 phosphorylation and actin polymerization were suppressed in both pre-diabetic Goto-Kakizaki and diabetic (18-20 weeks) Goto-Kakizaki rats, whereas RhoA, ROK2, and MYPT1 expression were unaffected. We conclude that abnormal Rho-associated kinase-mediated Ca2+ sensitization contributes to the dysfunctional cerebral myogenic response in the Goto-Kakizaki model of type 2 diabetes.

Keywords: Ca2+ sensitization; Goto-Kakizaki; Rho-associated kinase; cerebral arteries; type 2 diabetes.


Figures

Figure 1.
Figure 1.
Effect of ROK inhibition on the myogenic response of CAs from GK and WR. Panels (a), (b), and (c): Representative recordings (a) and (b) and mean values ± SEM (c) of CA diameter in response to step increases in pressure between 10 and 140 mmHg in control conditions (2.5 mmol/L Ca2+), in ROK inhibitor (H1152; 0.5 μmol/L), and in zero external Ca2+ (Ca2+-free) for 8–10 week WR (WR8, panel (a) and black lines in panel (c)) and GK (GK8, panel (b) and red lines in panel (c)) rats (n = 8 each). Open squares show mean diameter ± SEM of endothelium-intact CAs from 8-10 week WR (black) and GK rats (red) (n = 5 and 8, respectively). *Significantly different (P <  0.05) from corresponding value in WR8. Panel (d): Mean active constriction versus pressure ± SEM between 10 and 140 mmHg of CAs from WR8 (black lines) to GK8 (red lines) rats in control conditions (open symbols) and in the presence of H1152 (0.5 μmol/L; closed symbols) (n = 8).* Significantly different (P <  0.05) from value in WR8. Panels (e), (f), and (g): Representative traces (e and f) and mean values ± SEM (g) of CA diameter in response to step increases in pressure between 10 and 140 mmHg in control conditions (2.5 mmol/L Ca2+), in ROK inhibitor (H1152; 0.5 μmol/L), and in zero external Ca2+ (Ca2+-free) for 18–20 week WR (WR18, panel (e) and black lines in panel (g)) and GK rats (GK18, panel (f) and blue lines in panel (g)) (n = 8). Significantly different (P <  0.05) from corresponding value in WR18. Panel (h): Mean active constriction versus pressure ± SEM between 10 and 140 mmHg of CAs from WR18 (black lines) and GK18 (blue lines) rats in control conditions and in the presence of H1152 (0.5 μmol/L) (n = 8).* Significantly different (P <  0.05) from value in WR18.
Figure 2.
Figure 2.
Effect of ROK inhibition on pressure-evoked LC20 phosphorylation in CAs of GK and age-matched WR. Panels (a) and (b): Representative western blot for CAs of 8–10 week WR (WR8) and GK (GK8) rats at 10, 60, 120 mmHg (a), and for WR8 and GK8 vessels at 10 and 120 mmHg ± ROK inhibitor H1152 (0.5 μmol/L) (b). Monophosphorylated and unphosphorylated LC20 were separated by Phos-tag™ SDS-PAGE: upper band is monophosphorylated LC20 (1-P) and the lower band is unphosphorylated protein (0-P). Panel (c): Mean values ± SEM of LC20 phosphorylation as % of total LC20 at 10, 60, and 120 mmHg for CAs of WR8 (white bars) and GK8 (black bars) (n = 7), and at 10 and 120 mmHg for WR8 + H1152 (rising hatched bars) and GK8 + H1152 (falling hatched bars) (n = 3 and 7, respectively). * and # indicate significant difference (P <  0.05) from WR8 GK8 values at 10 mmHg, respectively. ** indicates significant difference (P <  0.05) from WR8 at 120 mmHg. Panels (d) and (e): Representative western blot (d) and mean values ± SEM (e) of LC20 phosphoprotein as % of total LC20 at 10, 60, 120 mmHg for CAs of 18–20 week WR (WR18, white bars) and GK rats (GK18, black bars) (n = 8). * and # indicate significantly different (P <  0.05) from WR18 value at 10 mmHg and WR18 value at the identical pressure, respectively. Note: All densitometric comparisons here and in subsequent figures were performed using single western blots; blots subsequently cut to remove lanes containing data not pertinent to the figure is denoted by a vertical bar, as in panel (a) between the WR8 and GK8 lanes.
Figure 3.
Figure 3.
Effect of ROK inhibition on the pressure-evoked MYPT1-T855 phosphorylation in CAs from GK and age-matched WR. Panels (a) and (b): Representative blots of MYPT1-T855 phosphoprotein and corresponding levels of actin at 10, 60, and 120 mmHg for: (a) CAs of 8–10 week WR (WR8) and GK rats (GK8), and (b) CAs of WR8 (at 10 and 120 mmHg) and GK8 (at 10, 60, and 120 mmHg) ± H1152 (0.5 μmol/L). Panel (c): Mean values ± SEM of MYPT1-T855 phosphoprotein normalized to actin and expressed as a fraction of the WR8 value at 10 mmHg for CAs of WR8 (white bars), GK8 (black bars), and GK8 + H1152 (hatched bars) at 10, 60, and 120 mmHg (n = 7). * and # indicate significant difference (P <  0.05) from WR8 value at 10 mmHg and GK value at the identical pressure, respectively. Panels (d) and (e): Representative blots (d) of MYPT1-T855 phosphorylation and corresponding levels of actin in each lane and mean values ± SEM (e) of phosphoprotein normalized to actin and expressed as a fraction of the WR18 value at 10 mmHg for CAs of 18–20 week WR (WR18, white bars) and GK rats (GK18, black bars) at 10, 60, and 120 mmHg (n = 7). * and # indicate significant difference (P <  0.05) from WR18 value at 10 mmHg and WR18 value at the identical pressure, respectively.
Figure 4.
Figure 4.
Effect of ROK inhibition on MYPT1-T697 phosphorylation in CAs from 8-10 week GK and WR. Panels (a) and (b): Representative blots of MYPT1-T697 phosphoprotein and corresponding levels of actin at 10, 60, and 120 mmHg for: (a) CAs of 8–10 week WR (WR8) and GK (GK8) rats; (b) CAs of GK8 rats ± H1152 (0.5 μmol/L) (n = 5). Panel (c): Mean values ± SEM of MYPT1-T697 phosphoprotein normalized to actin and expressed as a fraction of the WR value at 10 mmHg for CAs of WR8 (white bars), GK8 rats (black bars), and GK8 + H1152 (0.5 μmol/L) (hatched bars) at 10, 60, and 120 mmHg (n = 5). *Significant difference (P < 0.05) from WR8 value at 10 mmHg.
Figure 5.
Figure 5.
G-actin content in CAs from GK and age-matched WR. Panels (a) and (c): Representative western blots of G-actin and SM22 content (a) and mean values ± SEM (c) of G-actin normalized to SM22 and expressed as a fraction of the WR8 value at 10 mmHg in each age group for CAs of 8–10 week WR (WR8, white bars) and GK (GK8, black bars) at 10, 60, and 120 mmHg (n = 6). Panels (b) and (d): Representative western blots of G-actin and SM22 content (b) and mean values ± SEM (d) of G-actin normalized to SM22 and expressed as a fraction of the WR18 value at 10 mmHg in each age group for CAs of 18–20 week WR (WR18, white bars) and GK (GK18, black bars) at 10, 60, and 120 mmHg (n = 6). * and # indicate significant difference (P <  0.05) from WR value at 10 mmHg and WR value at the identical pressure, respectively, in the same panel.
Figure 6.
Figure 6.
Pressure-evoked FAK-Y397 autophosphorylation in CAs from 8-10 week GK and WR. Panel (a): Representative western blots for phospho-FAK-Y397 and corresponding actin in each lane at 10, 80, and 120 mmHg for CAs of 8–10 week GK (GK8) and age-matched WR rats (WR8). Panel (b): Mean levels ± SEM of phospho-FAK-Y397 normalized to actin and expressed as a fraction of the WR value at 10 mmHg for CAs of WR8 (white bars), GK8 rats (black bars) at 10, 80, and 120 mmHg (n = 5). *Significantly different (P < 0.05) from WR value at 10 mmHg. #Significantly different (P < 0.05) from corresponding WR value at the same pressure.
Figure 7.
Figure 7.
MYPT1, RhoA, and ROK2 expression in CAs of GK and age-matched WR. Panel (a): Mean values ± SEM of MYPT1 transcript relative to ß-actin determined by real-time PCR using mRNA derived from CAs of 8–10 and 18–20 week GK (GK8, GK18; black bars) and WR (WR8, WR18; white bars). Relative transcript levels were determined by the 2−ΔΔCt method (n = 5). Panels (b) and (c): Representative western blots of MYPT1, actin, and GAPDH content in each lane (b) and mean values ± SEM (c) of MYPT1 protein normalized to actin (left) or GAPDH (right) and expressed as a fraction of the content in the age-matched WR value for CAs from 8 to 10 and 18 to 20 weeks GK (black bars) and WR (white bars) (n = 10). Panels (d) and (e): Mean values ± SEM of RhoA (d) and ROK2 (e) transcript expression relative to ß-actin determined by real-time PCR using mRNA derived from CAs of WR8 (white bars) and GK8 (black bars). Relative transcript levels were determined using the 2−ΔΔCt method (n = 5). Panel (f): Representative western blots of ROK2 and corresponding actin content and mean values ± SEM of ROK2 protein normalized to actin in CAs of GK8 (black bar) expressed as a fraction of the content in age-matched WR (white bar) (n = 4).

References

    1. Cipolla MJ. The cerebral circulation [2009] – PubMed – NCBI, www.ncbi.nlm.nih.gov/pubmed/21452434 (accessed 30 November 2015).
    1. Davis MJ, Hill MA. Signaling mechanisms underlying the vascular myogenic response. Physiol Rev 1999; 79: 387–423. - PubMed
    1. Cole WC, Welsh DG. Role of myosin light chain kinase and myosin light chain phosphatase in the resistance arterial myogenic response to intravascular pressure. Arch Biochem Biophys 2011; 510: 160–173. - PubMed
    1. Matsushita K, Kuriyama Y, Nagatsuka K, et al. Periventricular white matter lucency and cerebral blood flow autoregulation in hypertensive patients. Hypertension 1994; 23: 565–568. - PubMed
    1. Iadecola C. The pathobiology of vascular dementia. Neuron 2013; 80: 844–866. - PMC - PubMed

Publication types

LinkOut - more resources