. 2016 Feb 26;291(9):4487-502.
doi: 10.1074/jbc.M115.702514. Epub 2015 Dec 31.

OS9 Protein Interacts with Na-K-2Cl Co-transporter (NKCC2) and Targets Its Immature Form for the Endoplasmic Reticulum-associated Degradation Pathway

Affiliations

OS9 Protein Interacts with Na-K-2Cl Co-transporter (NKCC2) and Targets Its Immature Form for the Endoplasmic Reticulum-associated Degradation Pathway

Elie Seaayfan et al. J Biol Chem. .

Abstract

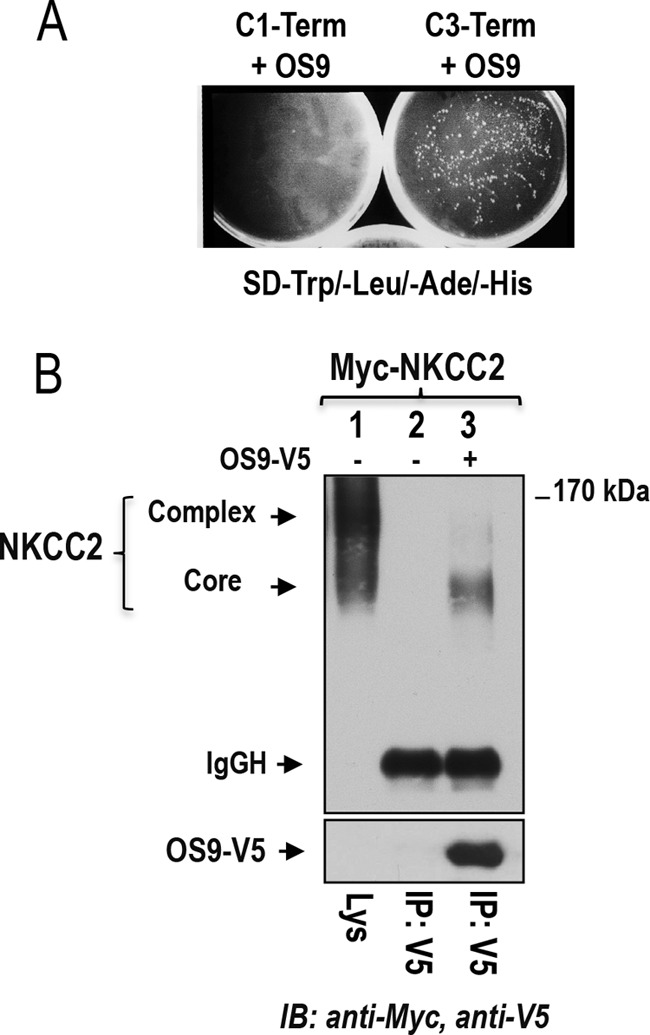
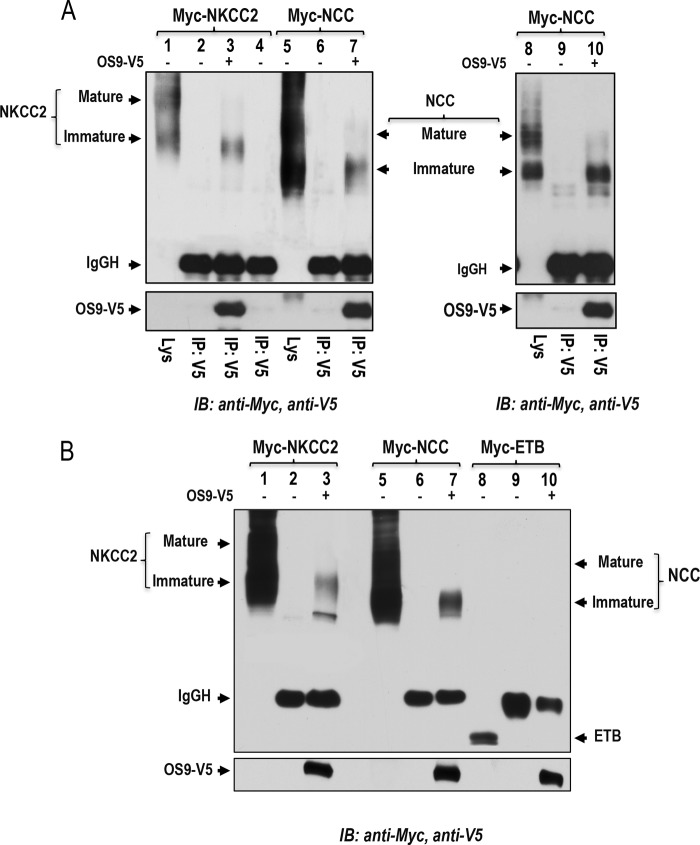
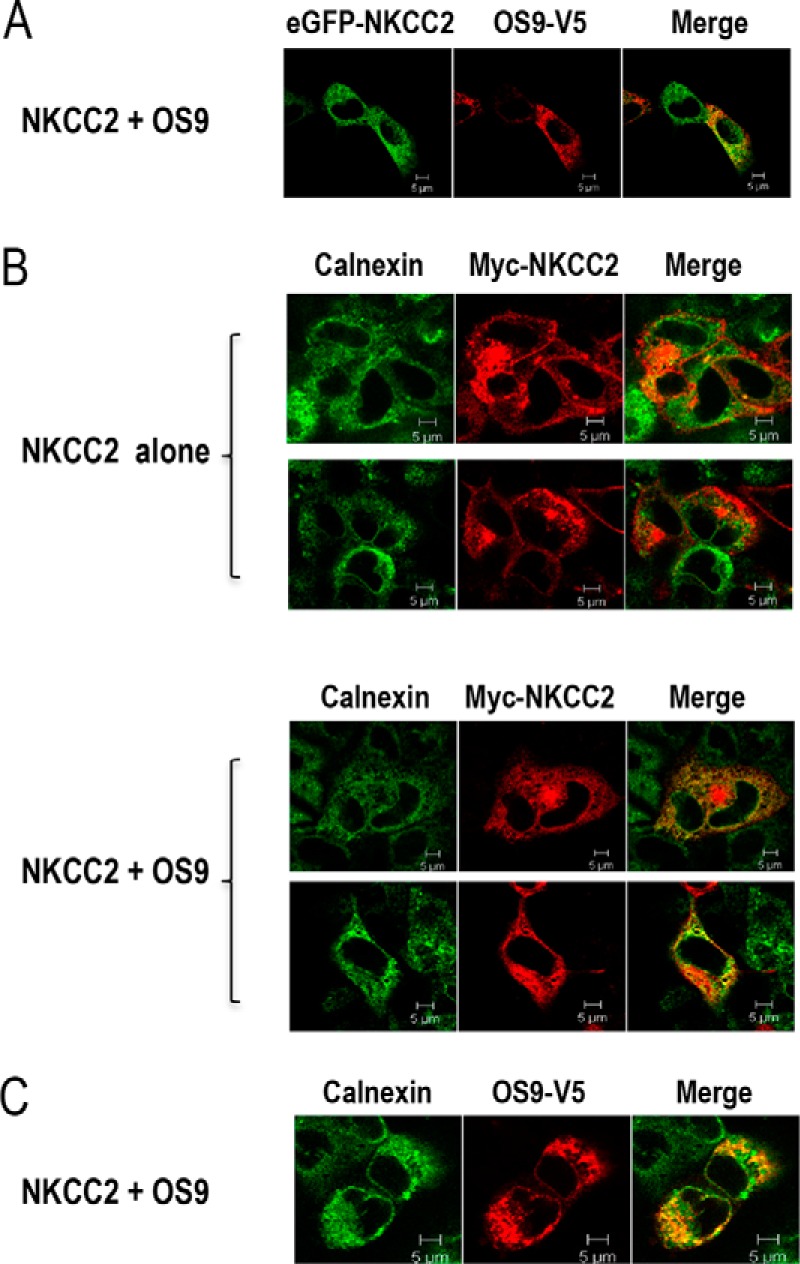
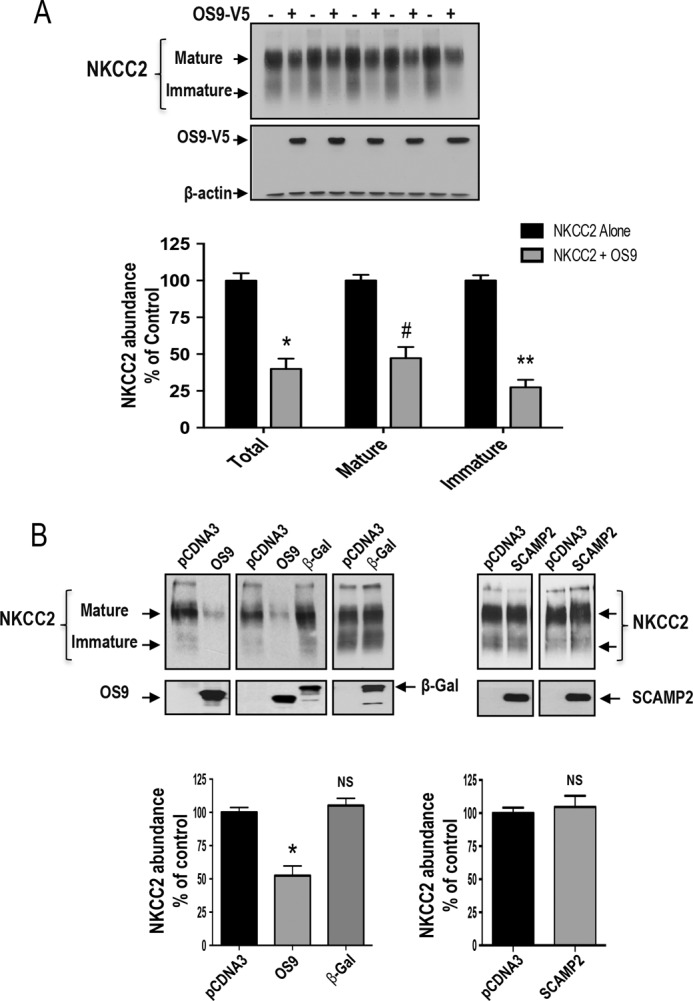
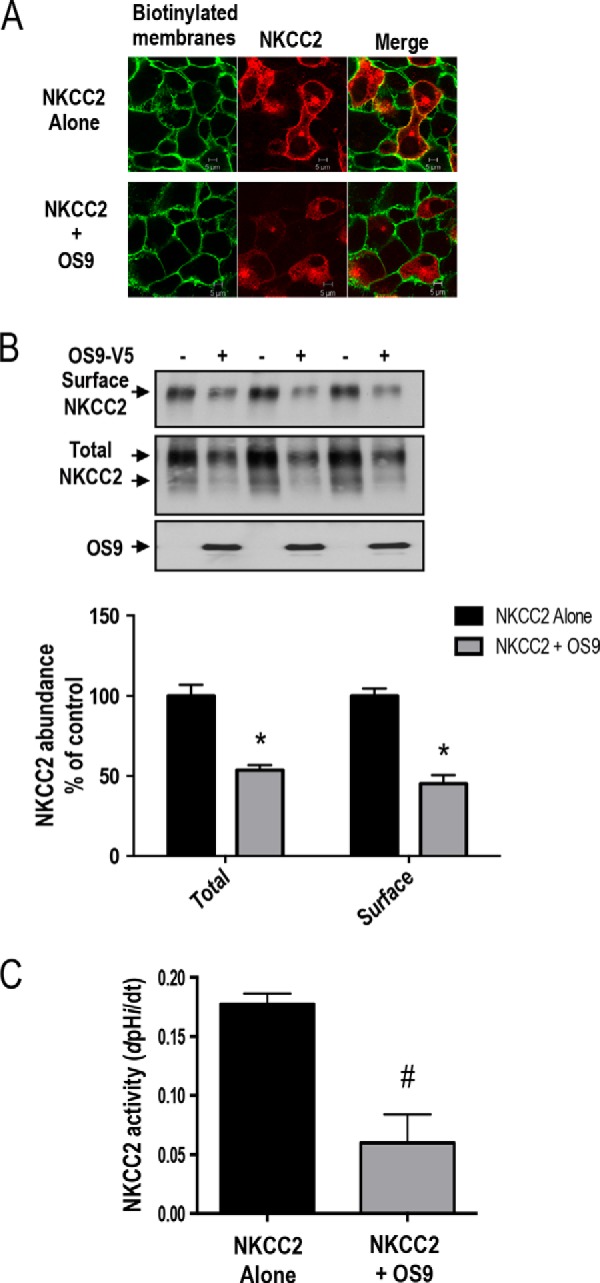
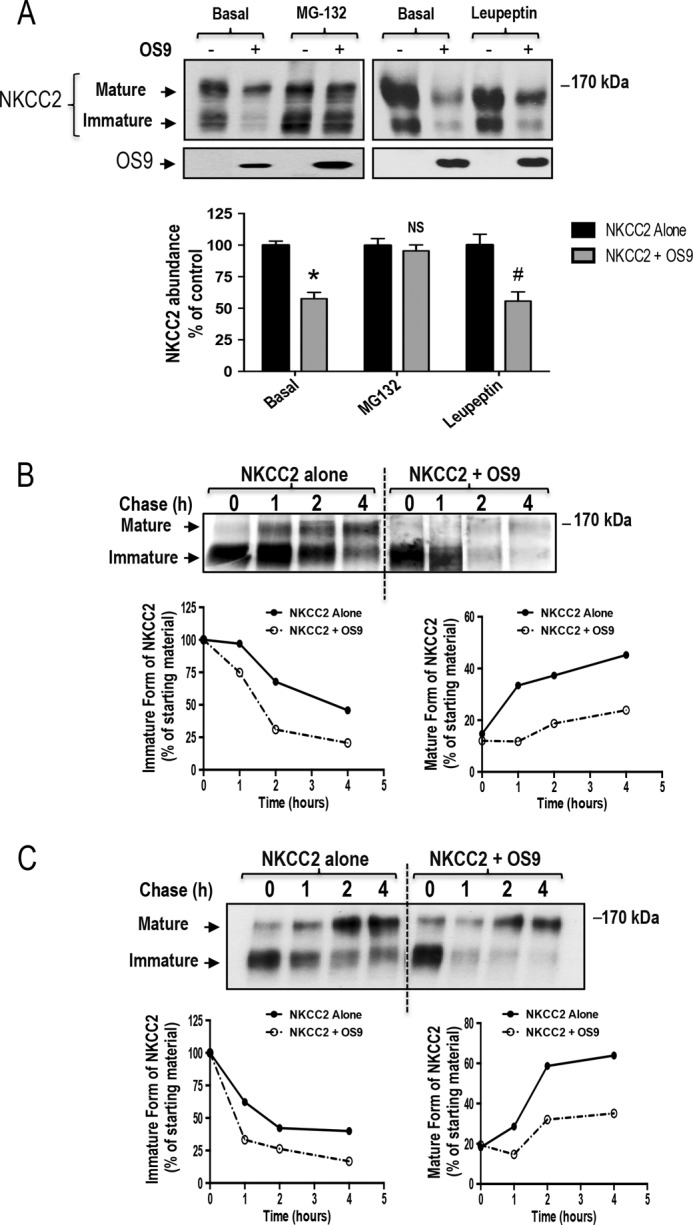
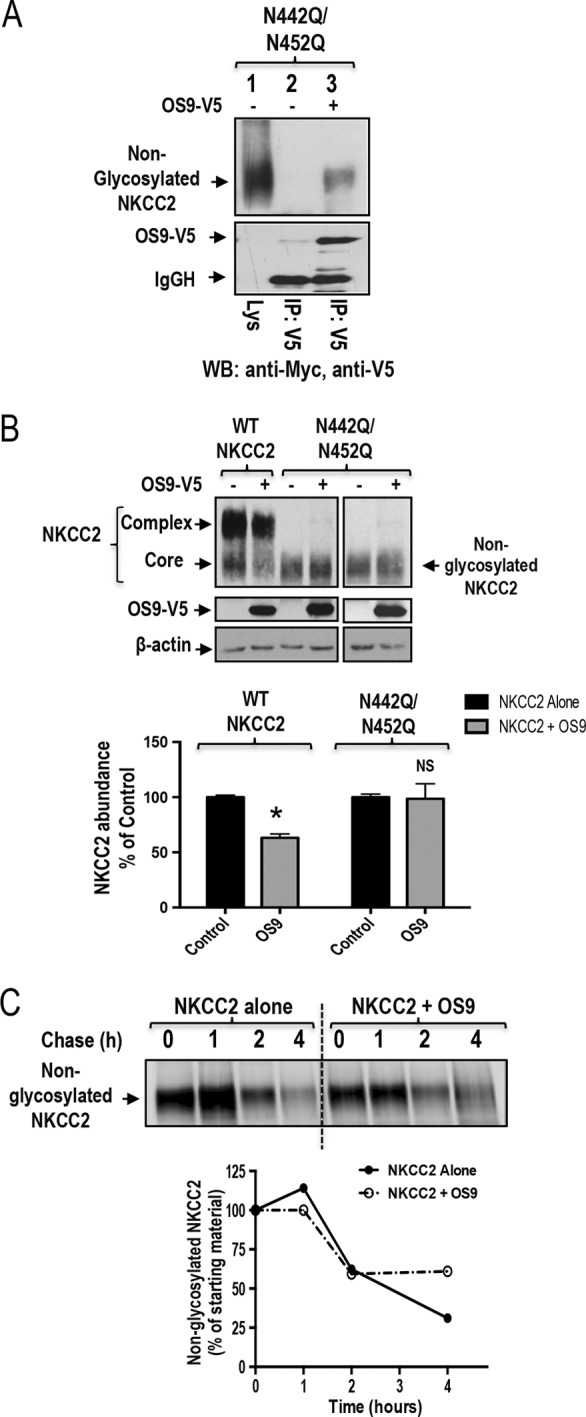
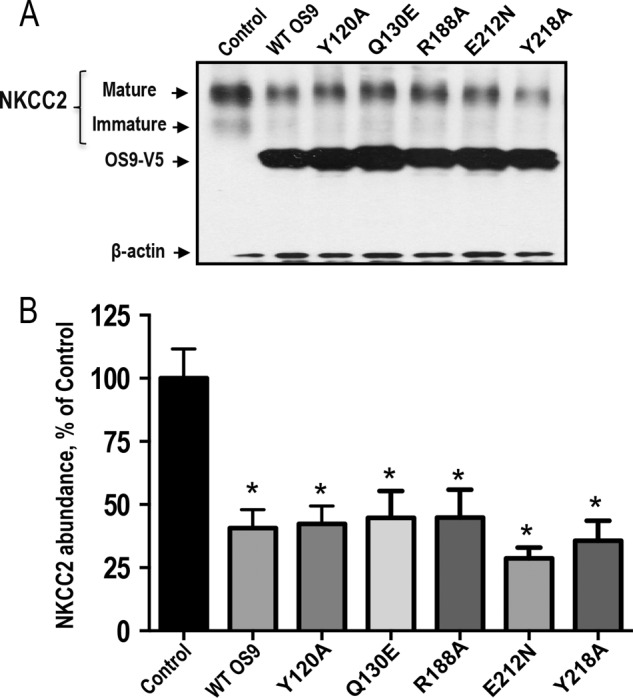
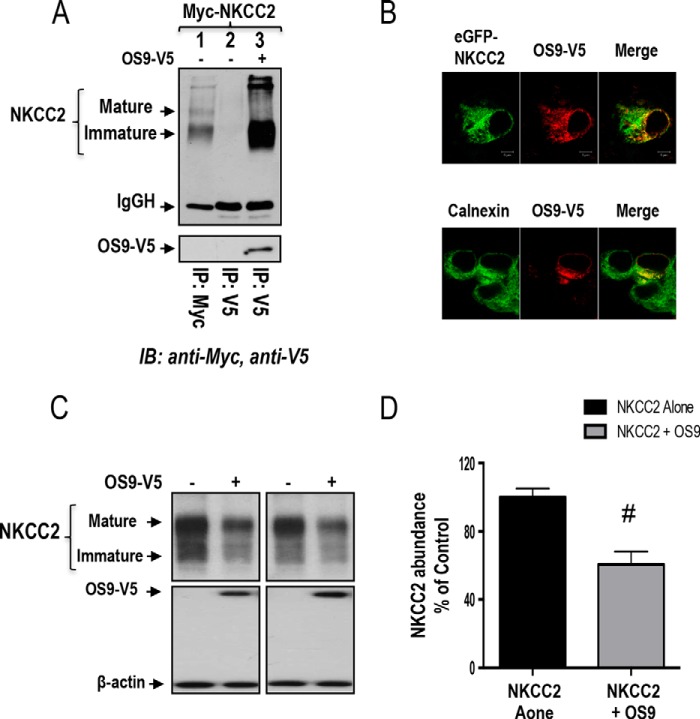
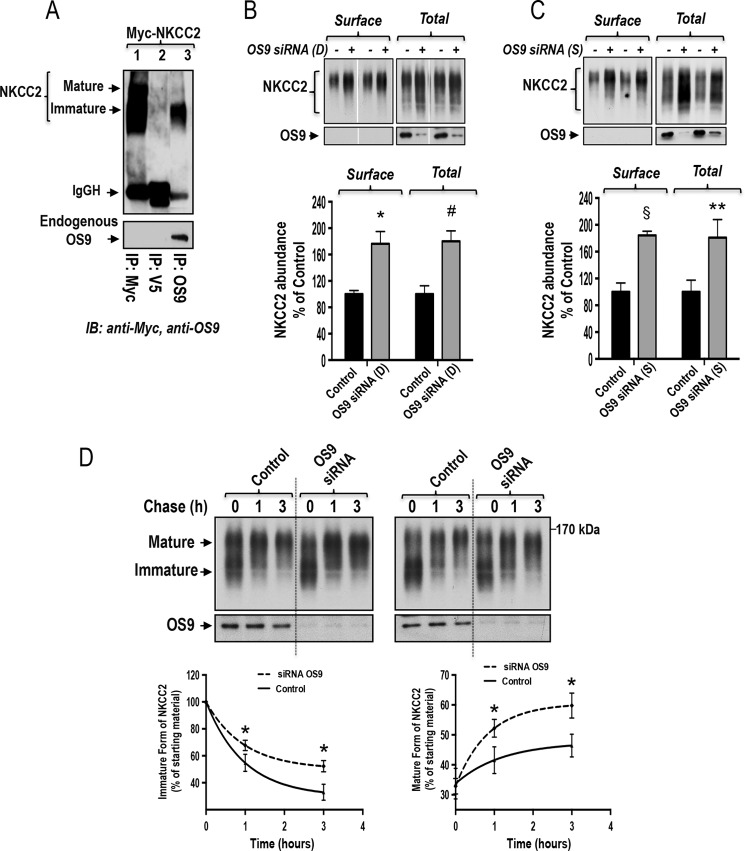
Mutations in the renal specific Na-K-2Cl co-transporter (NKCC2) lead to type I Bartter syndrome, a life-threatening kidney disease featuring arterial hypotension along with electrolyte abnormalities. We have previously shown that NKCC2 and its disease-causing mutants are subject to regulation by endoplasmic reticulum-associated degradation (ERAD). The aim of the present study was to identify the protein partners specifically involved in ERAD of NKCC2. To this end, we screened a kidney cDNA library through a yeast two-hybrid assay using NKCC2 C terminus as bait. We identified OS9 (amplified in osteosarcomas) as a novel and specific binding partner of NKCC2. Co-immunoprecipitation assays in renal cells revealed that OS9 association involves mainly the immature form of NKCC2. Accordingly, immunocytochemistry analysis showed that NKCC2 and OS9 co-localize at the endoplasmic reticulum. In cells overexpressing OS9, total cellular NKCC2 protein levels were markedly decreased, an effect blocked by the proteasome inhibitor MG132. Pulse-chase and cycloheximide-chase assays demonstrated that the marked reduction in the co-transporter protein levels was essentially due to increased protein degradation of the immature form of NKCC2. Conversely, knockdown of OS9 by small interfering RNA increased NKCC2 expression by increasing the co-transporter stability. Inactivation of the mannose 6-phosphate receptor homology domain of OS9 had no effect on its action on NKCC2. In contrast, mutations of NKCC2 N-glycosylation sites abolished the effects of OS9, indicating that OS9-induced protein degradation is N-glycan-dependent. In summary, our results demonstrate the presence of an OS9-mediated ERAD pathway in renal cells that degrades immature NKCC2 proteins. The identification and selective modulation of ERAD components specific to NKCC2 and its disease-causing mutants might provide novel therapeutic strategies for the treatment of type I Bartter syndrome.

Keywords: Na-K-Cl co-transporter (NKCC); endoplasmic reticulum-associated protein degradation (ERAD); hypertension; intracellular trafficking; kidney; membrane trafficking; sodium transport.


Figures

FIGURE 1.
FIGURE 1.
Identification of OS9 as a novel NKCC2-interacting protein. A, OS9 interacts specifically with the distal region of NKCC2 C terminus in yeast. A yeast two-hybrid assay was performed using the Matchmaker system as described under “Experimental Procedures.” The experiment confirmed the interaction of OS9 with the distal region of NKCC2 C terminus 5 (C3-term) as judged by growth of the AH109 reporter strain on selection medium (−Trp, −Leu, −His, −Ade). In contrast, no growth was observed when AH109 was transformed with OS9 and C1-term. B, NKCC2 interacts in vivo with OS9 in OKP cells. OKP cells transiently expressing Myc-NKCC2 singly or in combination with OS9 were immunoprecipitated (IP) with anti-V5 anti-body (lanes 2 and 3). 5% of total cell lysate (Lys) was resolved as a positive control. NKCC-2 co-immunoprecipitated with OS9 was detected by immunoblotting (IB) using anti-Myc (lane 3). The positions of the core glycosylated (immature) and complex glycosylated (mature) proteins of NKCC2 are indicated. The interaction of NKCC2 with OS9 involves mainly the core glycosylated, immature form of the co-transporter. SD, synthetic defined medium; IgGH, the heavy chain of IgG.
FIGURE 2.
FIGURE 2.
OS9 interacts specifically with NKCC2 and the related NCC. A, co-immunoprecipitation of OS9 with NKCC2 and NCC in OKP cells. Cell lysates from cells transiently transfected with Myc-NKCC2 or Myc-NCC in the presence or absence of OS9-V5 were immunoprecipitated (IP) with anti-V5 antibody. Similar to NKCC2, NCC co-immunoprecipitated with OS9-V5 was detected by immunoblotting (IB) using anti-Myc (lanes 7 and 10). Again, the interaction with OS9 involves mainly the core glycosylated (immature) form of the co-transporters. 5% of total cell lysate (Lys) was resolved as a positive control. B, OS9 does not interact with ETB receptor. Cell lysates from OKP cells transiently transfected with the co-transporters proteins or ETB receptor in the presence or absence of OS9-V5 were immunoprecipitated with anti-V5 anti-body. Again, 5% of total cell lysate (Lys) was resolved as a positive control. In contrast to NKCC2 and NCC, ETB receptor protein was not recovered from OS9 immunoprecipitates (lane 10). IgGH, the heavy chain of IgG.
FIGURE 3.
FIGURE 3.
OS9 co-localizes with NKCC2 in the endoplasmic reticulum. A, immunofluorescence confocal microscopy showing distribution of NKCC2 and OS9 in OKP cells. OKP cells were transfected with NKCC2 N-terminally tagged with EGFP (green) and OS9-V5. Fixed and permeabilized cells were stained with mouse anti-V5 for OS9 (Texas Red). The yellow color (merged image) indicates co-localization of the proteins. B, effect of OS9 on subcellular distribution of NKCC2. OKP cells transfected with Myc-NKCC2 alone or with OS9 were stained with mouse anti-Myc (Texas Red; red) and rabbit anti-calnexin (fluorescein isothiocyanate; green). The yellow color indicates overlap between the Myc tag of NKCC2 protein (green) and the ER marker (red), representing co-localization of the proteins. C, subcellular distribution of OS9 in OKP cells. OKP cells overexpressing NKCC2 and OS9-V5 were stained with mouse anti-V5 (Texas Red; red) and rabbit anti-calnexin (FITC; green). The yellow color in the merged image indicates co-localization of OS9 (red) with the ER marker (green). The white scale bars represent 5 μm.
FIGURE 4.
FIGURE 4.
Regulation of steady-state protein level of NKCC2 by OS9. A, OS9 co-expression decreases the expression of NKCC2 proteins. Upper panel, representative immunoblotting analysis showing the effect of OS9 overexpression on NKCC2 protein abundance in OKP cells. Cells were transfected with Myc-NKCC2 alone or in the presence of OS9-V5. 48 h post-transfection, total cell lysates were subjected to immunoblotting analysis for Myc-NKCC2, OS9-V5, and actin. Actin was used as a loading control Lower panel, quantitation of steady-state mature, immature, and total NKCC2 expression levels with or without OS9 co-expression. NKCC2 expression is given as the percentage of that observed in controls co-expressing empty vector (n = 6; mean ± S.E.). Data are expressed as a percentage of control ±S.E. *, p < 0.0004; #, p < 0.0003; **, p < 0.0001 versus control. B, the effect of OS9 on NKCC2 is specific. Upper panel, representative immunoblotting analysis showing the effect of OS9, β-galactosidase (β-gal), and SCAMP2 on NKCC2 protein abundance in OKP cells. Cells were co-transfected with Myc-NKCC2 and the empty vector (pCDNA3) or with OS9.1, β-galactosidase-V5 (β-gal), or SCAMP2-V5 cDNAs. Bottom, summary of results. NS, not significant versus NKCC2 alone; *, p < 0.001 versus NKCC2 alone. NKCC2 alone, n = 8; NKCC2 with OS9.1, n = 8; NKCC2 with β-gal, n = 5. In contrast to OS9, SCAMP2-V5 overexpression had no effect NKCC2 protein abundance. OKP cells were co-transfected with Myc-NKCC2 (0.1 μg/well) alone or in combination with SCAMP2-V5 (0.3 μg/well). Bottom, summary of results. NS, not significant versus NKCC2 alone (NKCC2 alone, n = 5; NKCC2 with SCAMP2-V5, n = 5). Error bars, S.E.
FIGURE 5.
FIGURE 5.
OS9 decreases NKCC2 cell surface expression and activity. A, effect of 0S9 on subcellular distribution of NKCC2. OKP cells were transfected with Myc-NKCC2 (red) alone or with SCAMP2-V5. Membrane proteins of confluent cells were biotinylated at 4 °C with the biotinylation reagent sulfo-NHS-SS-biotin. Then the monolayers were fixed and stained for cell surface biotin (avidin-Cy2; green). The stained specimens were evaluated by confocal microscopy. Optical sections (xy) at the cell surface are depicted for the Texas Red channel (red), Cy2 channel (red), and a merged channel. B, total and surface NKCC2 proteins are down-regulated by OS9. OKP cells were co-transfected with Myc-NKCC2 (0.1 μg/well) alone or in combination with OS9 (0.3 μg/well) as indicated. Biotinylated proteins were recovered from cell extracts by precipitation with NeutrAvidin-agarose. NKCC2 proteins on the cell surface were detected by immunoblotting with Myc antibody. An aliquot of the total cell extract from each sample was also run on a parallel SDS gel and Western blotted for total NKCC2 expression. Bottom, densitometric analysis of total and surface NKCC2 from cells expressing NKCC2 alone or with OS9. Data are expressed as a percentage of control. *, p < 0.004 versus NKCC2 alone (n = 3). C, measurement of Na-K-2Cl co-transport activity in OKP cells expressing NKCC2 alone or with OS9 proteins. Each bar represents the mean ± S.E. rates of cell pH recovery (dpHi/dt in pH units/min) from NH4+-induced alkaline load of three independent experiments. #, p < 0.03 versus NKCC2 alone (n = 3). Error bars represent S.E.
FIGURE 6.
FIGURE 6.
OS9 promotes NKCC2 degradation. A, OS9 decreases NKCC2 expression in a proteasome-dependent manner. OKP cells transiently transfected with Myc-NKCC2 alone or with OS9-V5 were treated with (+) or without (−) 10 μm MG132 or 100 μm leupeptin for 12–16 h prior to cell lysis. The cell lysates were subjected to SDS-PAGE and immunoblotted with anti-Myc and anti-V5 antibodies. Bottom, densitometric analysis of NKCC2 bands from untreated (−) cells and cells treated (+) with MG132 or leupeptin. Data are expressed as percentage of control ±S.E. *, p < 0.0001 versus control (n = 8); NS, not significant versus control (n = 9); #, p < 0.02 versus control (n = 3). B, pulse-chase experiments performed in OKP cells transfected with the indicated plasmids. Cells were labeled with [35S]methionine/cysteine and harvested at the indicated chase times for Myc-NKCC2 immunoprecipitation. Signals were detected by autoradiography. Lower left panel, quantitative analysis of immature NKCC2. The density of the immature form of NKCC2 protein was normalized to the density at time 0 (100%). Lower right panel, quantitative analysis of NKCC2 maturation. In these experiments, we compared the amount of the newly synthesized NKCC2 (immature form at time 0) and the conversion to the complex glycosylated form of the co-transporter (mature form) during the chase period. C, cycloheximide-chase analysis of NKCC2 in the presence or absence of OS9-V5. 14–16 h post-transfection, OKP cells transiently expressing WT NKCC2 alone or in combination with OS9 were chased for the indicated times after addition of cycloheximide. Total cell lysates were separated by SDS-PAGE and probed by anti-Myc antibody. The density of the mature and immature forms of NKCC2 proteins was normalized to the density at time 0. Error bars represent S.E.
FIGURE 7.
FIGURE 7.
N-Glycosylation of NKCC2 is critical for the OS9-induced down-regulation of NKCC2. A, co-immunoprecipitation of OS9 with non-glycosylated NKCC2 (N442Q/N452Q). Cell lysates from cells transfected with N442Q/N452Q in the presence or absence of OS9-V5 were immunoprecipitated (IP) with anti-Myc or anti-V5 antibody. N442Q/N452Q co-immunoprecipitated with OS9 was detected by immunoblotting (WB) using anti-Myc (lane 3). B, OS9 association with non-glycosylated NKCC2 is unproductive. Cells were transfected with Myc-NKCC2 or N442Q/N452Q in the presence or absence of OS9-V5. 48 h post-transfection, total cell lysates were subjected to immunoblotting analysis for Myc-NKCC2, OS9-V5, and actin. Lower panel, quantitation of steady-state total NKCC2 expression levels with or without OS9 co-expression. *, p < 0.001 versus control (n = 4); NS, not significant versus control (n = 4). C, pulse-chase experiments performed in OKP cells transfected with non-glycosylated NKCC2 in the presence or absence of OS9 construct. Cells were labeled with [35S]methionine/cysteine and harvested at the indicated chase times for Myc-NKCC2 immunoprecipitation. Signals were detected by autoradiography. Lower panel, quantitative analysis of non-glycosylated NKCC2. The density of NKCC2 proteins was normalized to the density at time 0 (100%). IgGH, the heavy chain of IgG. Error bars represent S.E.
FIGURE 8.
FIGURE 8.
Effect of overexpression of OS9 with mutated MRH domain. A, representative immunoblotting analysis showing the effect of OS9 overexpression with mutated MRH domain on NKCC2 protein abundance. OKP cells were transfected with NKCC2 singly (Control) or in combination with WT OS9 or mutated OS9 proteins. 48 h later, total cell lysates were subjected to immunoblot analysis for Myc-NKCC2, OS9-V5, and actin. B, summary of results. *, p < 0.005 versus control (n = 5). Error bars represent S.E.
FIGURE 9.
FIGURE 9.
The effect of OS9 on NKCC2 ERAD is independent of the expression system. A, OS9 interacts with immature NKCC2 in HEK cells. Cell lysates from HEK cells transiently transfected with Myc-NKCC2 singly or in combination with OS9-V5 were immunoprecipitated (IP) with anti-Myc or anti-V5 antibody. NKCC2 protein was recovered from OS9 immunoprecipitates mainly in its immature form (lane 3). B, OS9 and NKCC2 co-localizes in the ER. Upper panel, immunofluorescence confocal microscopy showing the distribution of NKCC2 and OS9 in HEK cells. HEK cells were transfected with NKCC2 N-terminally tagged with EGFP (green) and OS9-V5. Fixed and permeabilized cells were stained with mouse anti-V5 for OS9 (Texas Red). The yellow color (merged image) indicates co-localization of the proteins. Lower panel, HEK cells transfected with NKCC2 and OS9-V5 were stained with mouse anti-V5 (Texas Red; red) and rabbit anti-calnexin (FITC; green). Yellow indicates overlap between the V5 tag of OS9 (red) and the ER marker (green), representing co-localization of the proteins. C, OS9 decreases the steady-state protein level of NKCC2. Cells were transfected with Myc-NKCC2 alone or in the presence of OS9-V5. 48 h post-transfection, total cell lysates were subjected to immunoblotting analysis for Myc-NKCC2, OS9-V5, and actin. D, summary of results. Data are expressed as a percentage of control ±S.E. *, p < 0.02 versus control (n = 3). Error bars represent S.E.
FIGURE 10.
FIGURE 10.
Knockdown of endogenous OS9 increases NKCC2 biogenesis. A, endogenous OS9 interacts with immature NKCC2. HEK cells overexpressing Myc-NKCC2 were immunoprecipitated (IP) with anti-Myc (positive control; lane 1), anti-V5 (negative control; lane 2), or anti-OS9 antibody (lane 3). Co-immunoprecipitated NKCC2 (mainly the immature form) was detected by immunoblotting (IB) using anti-Myc antibody (lane 3). IgGH, the heavy chain of IgG. B and C, knockdown of endogenous OS9 increases total and cell surface expression of NKCC2. Upper panels, representative immunoblotting analysis illustrating the effect of OS9 knockdown on total and surface NKCC2. HEK cells were transfected with NKCC2 in the absence (Control) or presence of specific OS9 siRNAs from Dharmacon (D) or Santa Cruz Biotechnology (S). 48 h post-transfection, biotinylated proteins were recovered from cell extracts by precipitation with NeutrAvidin-agarose. An aliquot of the total cell extract from each sample was also run on a parallel SDS gel and Western blotted for total NKCC2 expression. NKCC2 proteins were detected by immunoblotting with Myc antibody. Lower panels, summary of results. Data are expressed as a percentage of control. *, p < 0.004 versus control (n = 4); #, p < 0.007 versus control (n = 4); §, p < 0.0001 versus control (n = 5); **, p < 0.03 versus control (n = 5). D, knockdown of endogenous OS9 increases NKCC2 stability and maturation. HEK cells were first transfected in the absence (Control) or presence of OS9 siRNA followed by transfection with NKCC2 plasmids 24 h later. 12–14 h post-transfection of NKCC2, cells were chased for the indicated times after addition of cycloheximide. Total cell lysates were subjected to immunoblot analysis for NKCC2 and OS9. Lower left panel, quantitative analysis of immature NKCC2. The density of the immature form of NKCC2 proteins was normalized to the density at time 0 (100%). Lower right panel, quantitative analysis of NKCC2 maturation. The results are presented as relative intensity. Each point represents the mean ± S.E. of three independent experiments. *, p < 0.05 versus controls (n = 4). Error bars represent S.E.

Similar articles

Cited by

References

    1. Greger R., and Velázquez H. (1987) The cortical thick ascending limb and early distal convoluted tubule in the urinary concentrating mechanism. Kidney Int. 31, 590–596 - PubMed
    1. Gamba G. (2005) Molecular physiology and pathophysiology of electroneutral cation-chloride cotransporters. Physiol. Rev. 85, 423–493 - PubMed
    1. Gamba G. (1999) Molecular biology of distal nephron sodium transport mechanisms. Kidney Int. 56, 1606–1622 - PubMed
    1. Wu J., Liu X., Lai G., Yang X., Wang L., and Zhao Y. (2013) Synergistical effect of 20-HETE and high salt on NKCC2 protein and blood pressure via ubiquitin-proteasome pathway. Hum. Genet. 132, 179–187 - PubMed
    1. Kim D., Sands J. M., and Klein J. D. (2004) Role of vasopressin in diabetes mellitus-induced changes in medullary transport proteins involved in urine concentration in Brattleboro rats. Am. J. Physiol. Renal Physiol. 286, F760–F766 - PubMed

Publication types

MeSH terms

Supplementary concepts