. 2016 Jan 1;351(6268):aac9698.
doi: 10.1126/science.aac9698.

Prefrontal cortical regulation of brainwide circuit dynamics and reward-related behavior

Affiliations

Prefrontal cortical regulation of brainwide circuit dynamics and reward-related behavior

Emily A Ferenczi et al. Science. .

Abstract

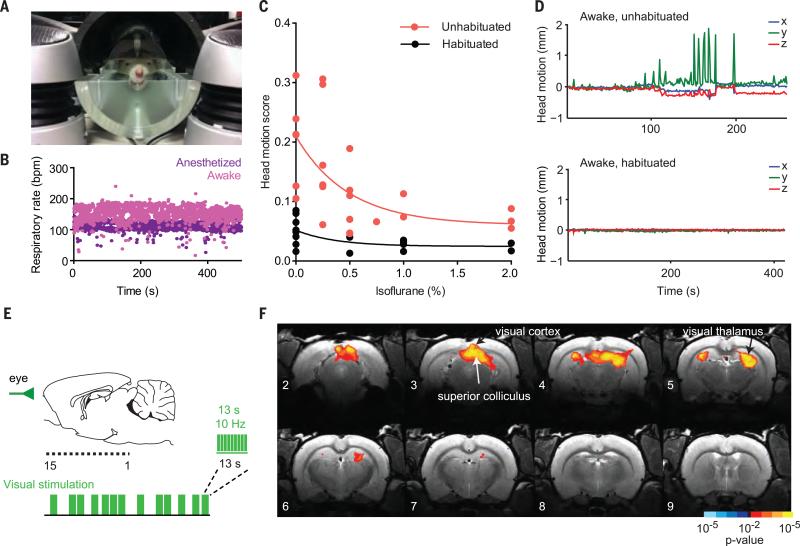
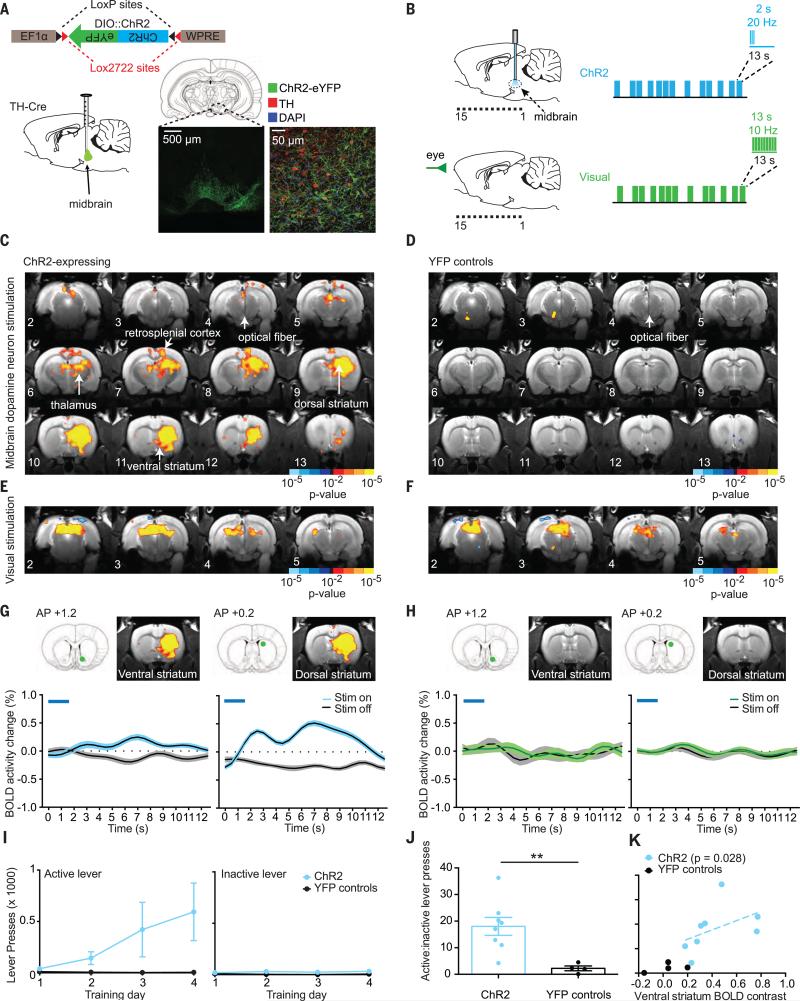
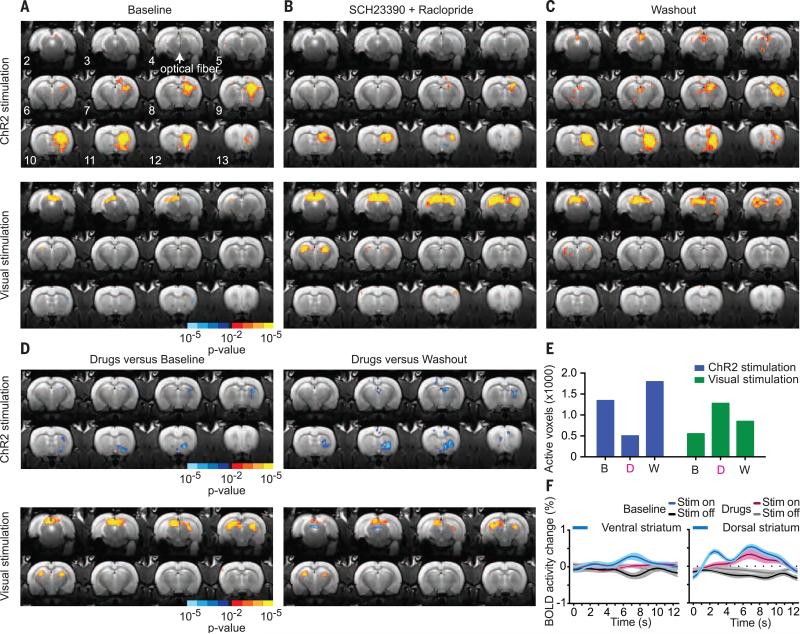
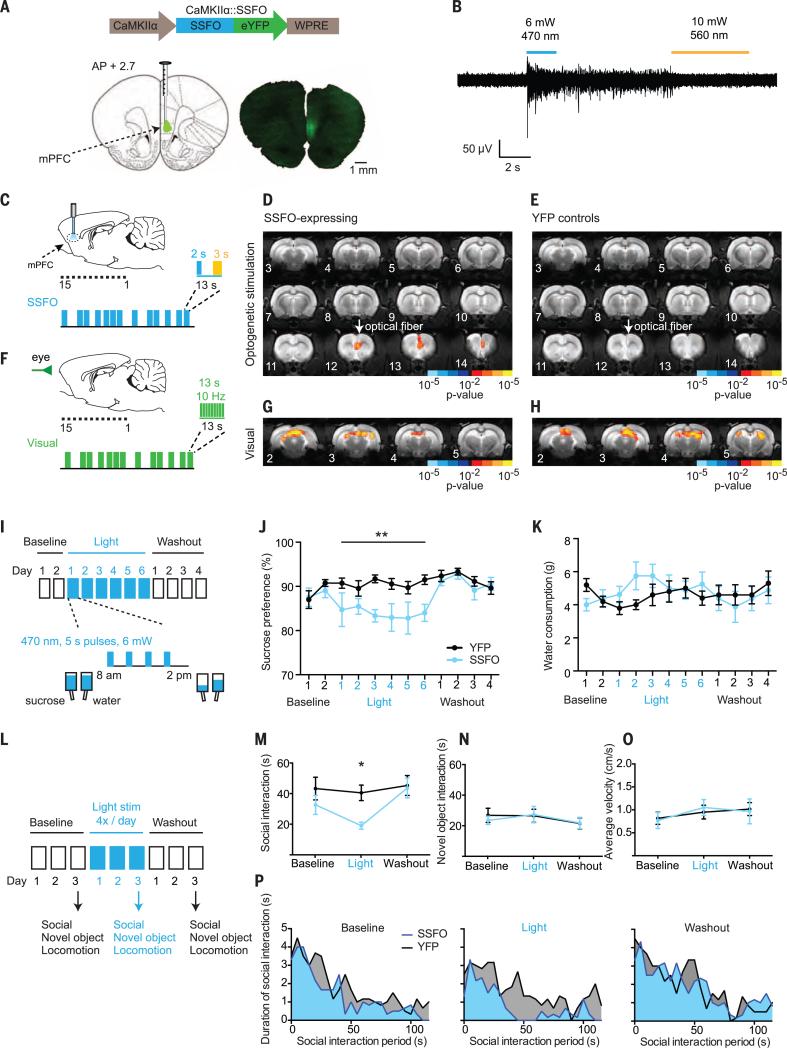
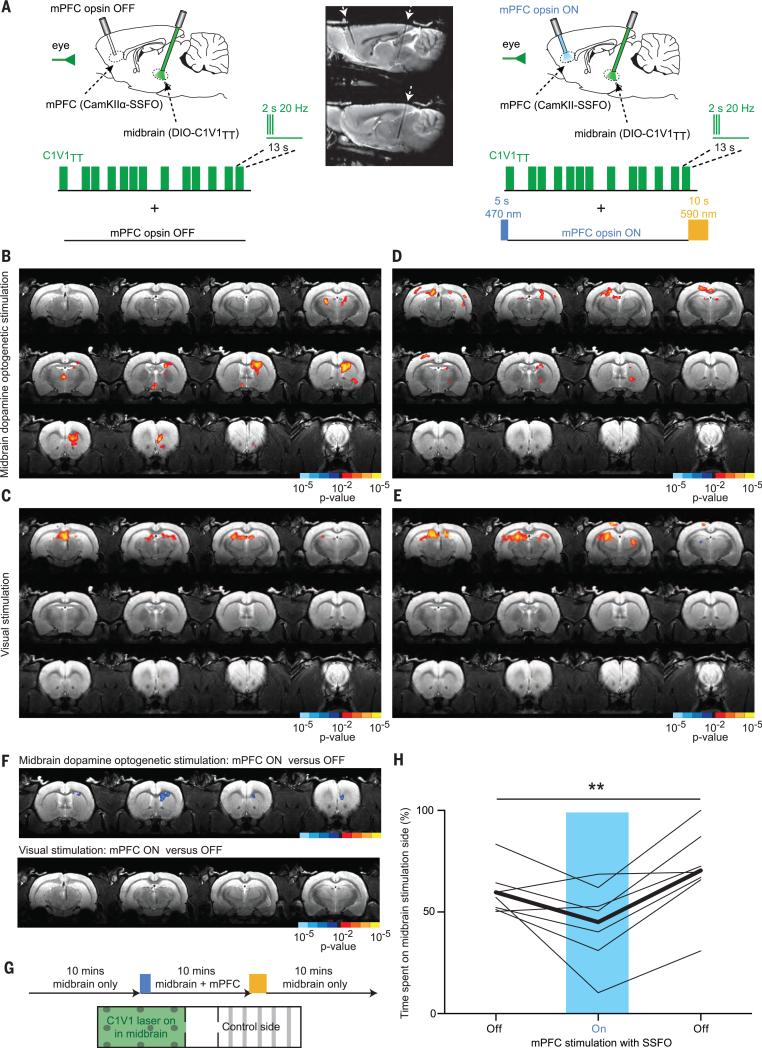
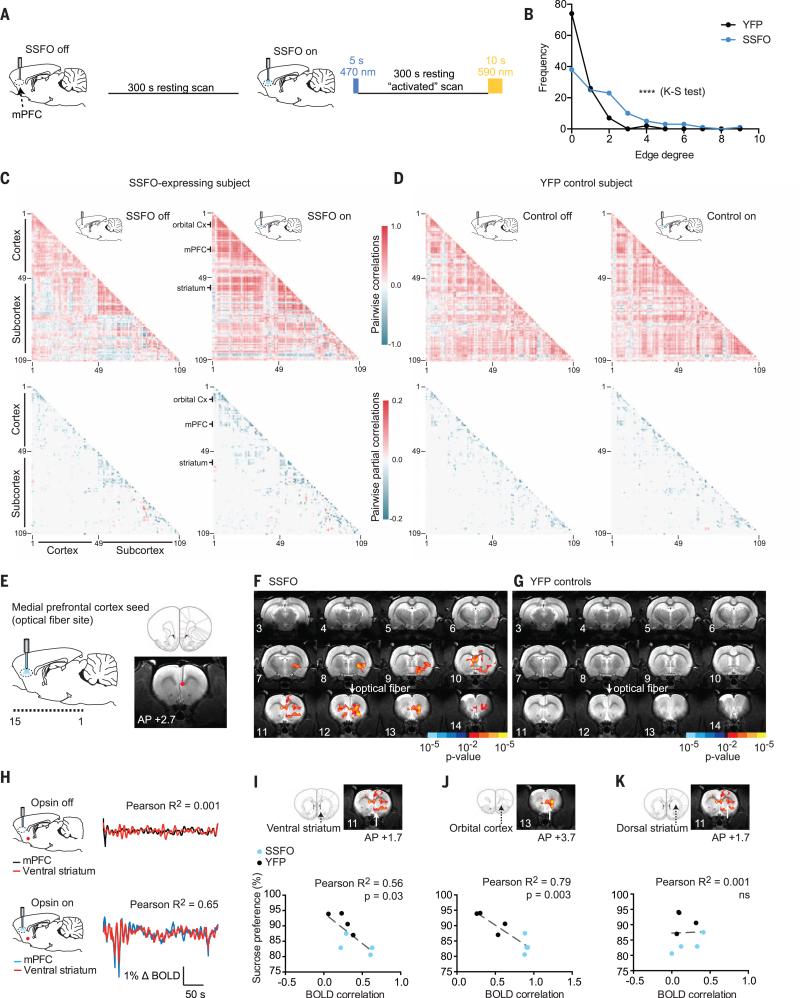
Motivation for reward drives adaptive behaviors, whereas impairment of reward perception and experience (anhedonia) can contribute to psychiatric diseases, including depression and schizophrenia. We sought to test the hypothesis that the medial prefrontal cortex (mPFC) controls interactions among specific subcortical regions that govern hedonic responses. By using optogenetic functional magnetic resonance imaging to locally manipulate but globally visualize neural activity in rats, we found that dopamine neuron stimulation drives striatal activity, whereas locally increased mPFC excitability reduces this striatal response and inhibits the behavioral drive for dopaminergic stimulation. This chronic mPFC overactivity also stably suppresses natural reward-motivated behaviors and induces specific new brainwide functional interactions, which predict the degree of anhedonia in individuals. These findings describe a mechanism by which mPFC modulates expression of reward-seeking behavior, by regulating the dynamical interactions between specific distant subcortical regions.


Figures

Fig. 1
Fig. 1. Optogenetic functional MRI (ofMRI) in awake rats
(A) MRI simulation environment for rodent habituation to the scanning procedure. (B) Example of respiratory rate monitoring [bpm, breaths per minute; n = 1 rat; eight sequential scans, four anesthetized (1 to 2% isoflurane) and four awake (0% isoflurane)]. (C) Effect of habituation on head motion during scanning, as a function of anesthesia depth (n = 2 rats). Head motion score is the root mean square of head translation in three dimensions over the course of a scan. (D) Example head motion plots (head translation in three dimensions, calculated as shifts in the center of mass of all voxels in the image over the course of a single scan) for an unhabituated (top) and a habituated (bottom) subject. The unhabituated scan was aborted early. (E) Visual stimulation during fMRI. A sagittal view of the brain indicates the location of MRI images from anterior (image 15) to posterior (image 1). The schematic illustrates event-related stimulation design. (F) Z-score map of BOLD activity in visual brain regions in response to visual stimulation in control subjects (n = 5 rats, 20 runs). For this figure and all subsequent statistical maps, maps were thresholded at P < 0.05 (corrected) [K > 5 functional voxels (80 transformed voxels), uncorrected P < 0.01]. Gradations in color (e.g., red-orange-yellow) indicate incremental P-value thresholds of one order of magnitude.
Fig. 2
Fig. 2. Influence of midbrain optogenetic dopamine stimulation on brainwide BOLD activity and behavior
(A) Schematic of Cre-dependent ChR2 construct and sagittal view of injection site in the midbrain. Confocal images demonstrate ChR2 expression in dopaminergic neurons in the midbrain. Green, ChR2-YFP; red, tyrosine hydroxylase (TH); blue, 4′,6-diamidino-2-phenylindole (DAPI). (B) Schematic of event-related design for midbrain ChR2 stimulation and visual stimulation. (C) Z-score map of BOLD activity in response to ChR2 stimulation of midbrain dopamine neurons (n = 8 rats, 34 runs). (D) Z-score map for YFP-control subjects in response to blue light stimulation in the midbrain (n = 4 rats, 21 runs). (E) Z-score maps for ChR2-expressing subjects (n = 8 rats, 34 runs) and (F) YFP-control subjects (n = 4 rats, 21 runs) in response to visual stimulation. (G) Average ChR2 stimulation–locked BOLD activity time courses in the ventral and dorsal striatum for ChR2-expressing subjects (n = 8 rats, 34 runs) and (H) YFP-control subjects (n = 4 rats, 16 runs). Mean and SEM (n = number of runs) are shown. Timing of light delivery is indicated by the blue lines above the plots. Regions of interest (ROIs) used for time-course extraction are indicated by green dots on atlas images above plots. (I) Active and inactive lever presses as a function of training day for ChR2-expressing (n = 8) and YFP-control (n = 4) rats. (J) Active-to-inactive lever press ratio on the final day of training for ChR2 and YFP rats (two-tailed Mann-Whitney U test: sum of ranks = 68, 11; U = 1; **P = 0.0081). (K) Relationship between BOLD activity contrast in the ventral striatum and active-to-inactive lever press ratio for ChR2-expressing subjects (n = 8 rats, Spearman ρ = 0.78, P = 0.028) and YFP-expressing subjects (n = 4 rats).
Fig. 3
Fig. 3. Sensitivity of brainwide ofMRI BOLD patterns to dopamine receptor pharmacological inhibition
(A to C) Sequential pharmacological experiments in ChR2-expressing TH-cre rats undergoing ChR2 stimulation of midbrain dopamine neurons (top) and visual stimulation (bottom). (A) Baseline scan (no drugs or vehicle administered, n = 4 rats, 16 runs). (B) Drug scan: systemic (intraperitoneal) administration of D1 (SCH23390, 0.6 mg/kg) and D2 (raclopride, 0.3 mg/kg) dopamine receptor antagonists immediately before acquisition of functional scans (n = 4 rats, 22 runs). (C) Vehicle control washout scan: 48 to 24 hours after drug administration (n = 4 rats, 18 runs). (D) Statistical comparison between drug-versus-baseline and drug-versus-washout conditions for ChR2 and visual stimulation. (E) Total number of activated voxels in response to ChR2 and visual stimulation under each pharmacological condition. B, baseline; D, drug; W, washout. (F) Average stimulation-locked BOLD activity time courses in the ventral and dorsal striatum in response to ChR2 stimulation of midbrain dopamine neurons at baseline (n = 4 rats, 16 runs) in the presence of systemic D1 and D2 receptor antagonists (n = 4 rats, 22 runs). Mean and SEM (n = number of runs) are shown.
Fig. 4
Fig. 4. Prefrontal cortical excitability modulation of multiple natural reward-related behaviors
(A) Schematic of the optogenetic construct CKIIα-SSFO-eYFP. Confocal image of SSFO-YFP expression in the mPFC. WPRE, woodchuck hepatitis virus posttranscriptional regulatory element. (B) Example of multiunit in vivo anesthetized optrode recording of SSFO stimulation in the mPFC, terminated by yellow light. (C) Event-related SSFO stimulation of the mPFC during fMRI scanning (optical fiber positioned in mPFC image 12). (D) Brainwide Z-score map of BOLD activity in response to SSFO stimulation of the mPFC in SSFO-expressing subjects (n = 6 rats, 17 runs) and (E) YFP-control subjects (n = 5 rats, 20 runs). (F) Event-related visual stimulation. (G) Z-score map in response to visual stimulation in SSFO-expressing subjects (n = 6 rats, 17 runs) and (H) YFP-control subjects (n = 5 rats, 20 runs). (I) Sucrose preference testing paradigm. (J) Sucrose preference across test days for SSFO-expressing subjects (blue, n = 8 rats) and YFPcontrols (black, n = 10 rats). Mean and SEM are shown. We found a significant interaction between group and test day [F11,176 = 2.555, **P = 0.0051, two-way repeated measures analysis of variance (ANOVA)], with significant differences between SSFO and YFP-control groups on days 3, 4, and 6 of light stimulation (P < 0.05, Sidak's multiple comparisons test). (K) Plain water consumption across test days for SSFO-expressing subjects (blue, n = 8 rats) and YFP-controls (black, n = 10 rats). Mean and SEM are shown.We found no significant difference between SSFO-expressing and YFP-control groups after multiple comparison testing. (L) Social interaction test paradigm. (M to O) Total duration of social interaction, novel object interaction, and mean velocity are compared across the three test days (n = 6 rats for SSFO social behavior, n = 5 for novel object and velocity, and n = 6 for YFP). We found a significant main effect of light (F2,20 = 5.470, *P = 0.0127, two-way repeated measures ANOVA), with a significant difference between SSFO and YFP-control groups only on the light-stimulation day (P < 0.05, Sidak's multiple comparisons test). (P) Social investigation (in 5-s bins) over the course of the interaction period. Shaded regions indicate the mean across all rats.
Fig. 5
Fig. 5. Cortical suppression of striatal BOLD and behavioral response to midbrain dopaminergic stimulation
(A) Schematic illustrating the design of the dual-stimulation experiment.The sagittal T2 anatomy scan (two adjacent sections shown) demonstrates the angled orientation of the two fibers. (B) Brain-wide Z-score map of BOLD activity in response to C1V1TTstimulation in midbrain dopaminergic neurons and (C) visual stimulation alone (n = 6 rats, 32 runs). (D) Z-score map in response to C1V1TTstimulation and (E) visual stimulation in combination with SSFO activation in the mPFC (n = 6 rats, 32 runs). (F) Statistical comparison of mPFC-activated versus nonactivated condition for midbrain dopaminergic stimulation and visual stimulation. (G) Real-time place preference test for C1V1TTstimulation alone and in combination with mPFC activation with SSFO. The percentage of time spent on the C1V1TT stimulation side was assessed for all three bursts. (H) One-way repeated measures ANOVA shows a significant effect of mPFC activation (**P = 0.0047, F = 8.652, number of groups = 3, number of rats = 7), with a significant difference from baseline and washout conditions after Newman-Keuls multiple comparison testing.
Fig. 6
Fig. 6. Evoked changes in brainwide interregional relationships and joint statistics after focal optogenetic modulation of mPFC excitability
(A) Brainwide graphical analysis was performed on resting-state fMRI scans for SSFO-expressing and YFP-control subjects to assess changes in BOLD activity partial correlations between mPFC-activated versus nonactivated scans. (B) Change in edge degree distribution across SSFO (n = 4 rats, 14 runs) and YFP subjects (n = 4 rats, 15 runs) in response to mPFC activation by light (Kolmogov-Smirnov test for difference in distributions between SSFO and YFP groups: D = 0.3394, ****P < 0.0001). (C) Pairwise correlation and sparse partial correlation matrices for 109 brain regions for an example SSFO-expressing subject and (D) a YFP-control subject under nonactivated and mPFC-activated conditions. Each matrix represents the data from a single scan. Brain regions (individual ROIs) are labeled by number; the index key is provided in fig. S12. Selected brain regions have been highlighted. (E) Seed-based correlation analysis (for mPFC seed). (F) Z-score map for changes in correlated BOLD activity with mPFC after SSFO activation for SSFO-expressing subjects (n = 4 rats, 14 runs) and (G) YFP-control subjects (n = 4 rats, 15 runs). (H) Example BOLD activity time series in two ROIs: mPFC (black or blue) and ventral striatum (red) during opsin-off (Pearson R2 = 0.001, P = 0.06) and opsin-on (Pearson R2 = 0.65, P < 0.0001) conditions. (I to K) Relationship between sucrose preference and mPFC-activated BOLD correlations between the mPFC and three brain regions for SSFO-expressing (blue, n = 4 rats) and YFP-control subjects (black, n = 4 rats). (I) Ventral striatum (Pearson R2 = 0.56, P = 0.032, n = 8 pairs). (J) Orbital cortex (Pearson R2 = 0.79, P = 0.0031, n = 8 pairs). (K) Dorsal striatum (Pearson R2 = 0.001, P = 0.95, n = 8 pairs).

Comment in

References

    1. Kelley AE, Berridge KC. The neuroscience of natural rewards: Relevance to addictive drugs. J. Neurosci. 2002;22:3306–3311. pmid: 11978804. - PMC - PubMed
    1. Schultz W. Predictive reward signal of dopamine neurons. J. Neurophysiol. 1998;80:1–27. pmid: 9658025. - PubMed
    1. Sesack SR, Grace AA. Cortico-basal ganglia reward network: Microcircuitry. Neuropsychopharmacology. 2010;35:27–47. doi: 10.1038/npp.2009.93; pmid: 19675534. - PMC - PubMed
    1. Howe MW, Tierney PL, Sandberg SG, Phillips PEM, Graybiel AM. Prolonged dopamine signalling in striatum signals proximity and value of distant rewards. Nature. 2013;500:575–579. doi: 10.1038/nature12475; pmid: 23913271. - PMC - PubMed
    1. Fiorillo CD, Tobler PN, Schultz W. Discrete coding of reward probability and uncertainty by dopamine neurons. Science. 2003;299:1898–1902. doi: 10.1126/science.1077349; pmid: 12649484. - PubMed

Publication types

MeSH terms