

Retinoic Acid Induced-Autophagic Flux Inhibits ER-Stress Dependent Apoptosis and Prevents Disruption of Blood-Spinal Cord Barrier after Spinal Cord Injury
- PMID: 26722220
- PMCID: PMC4679401
- DOI: 10.7150/ijbs.13229
Retinoic Acid Induced-Autophagic Flux Inhibits ER-Stress Dependent Apoptosis and Prevents Disruption of Blood-Spinal Cord Barrier after Spinal Cord Injury
Abstract
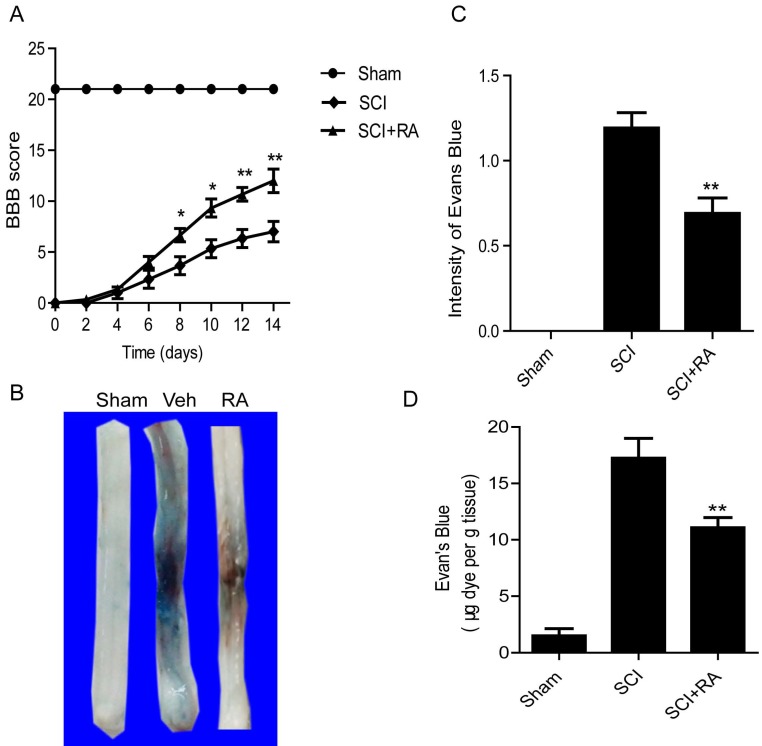
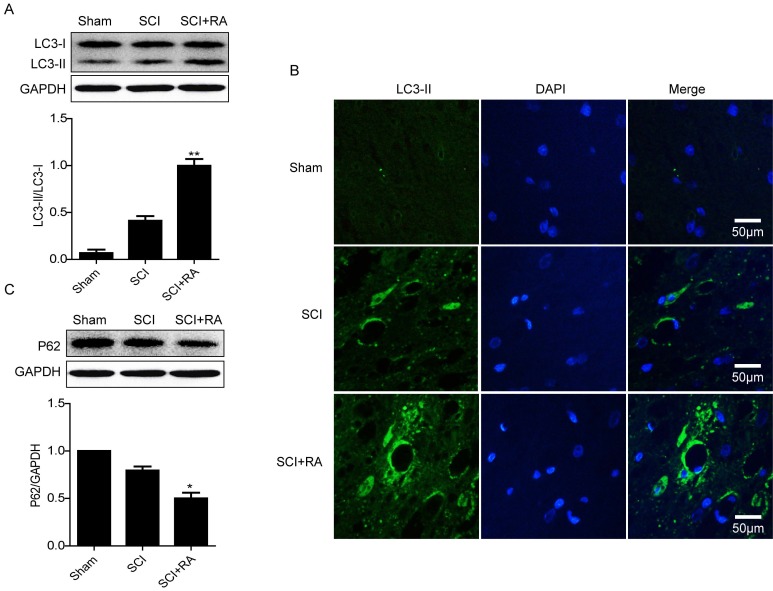
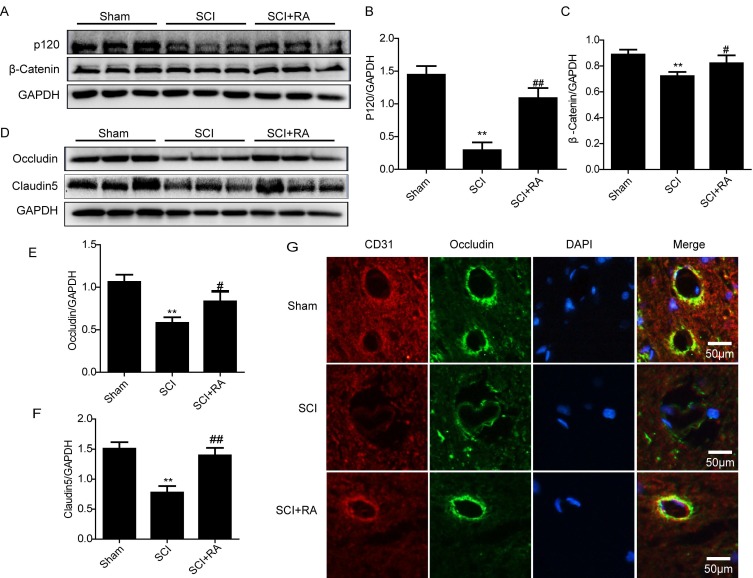
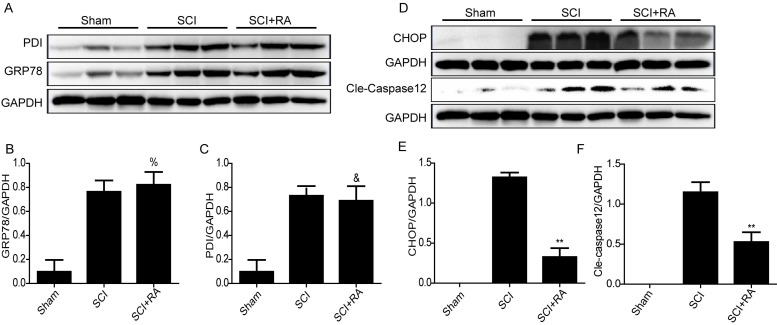
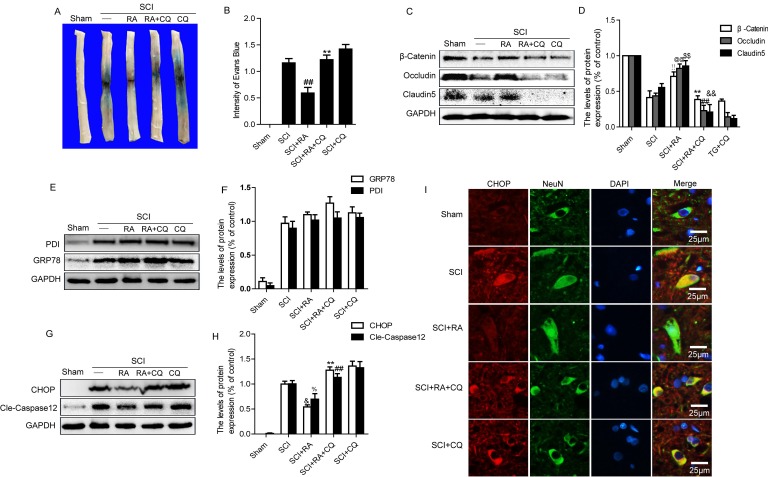
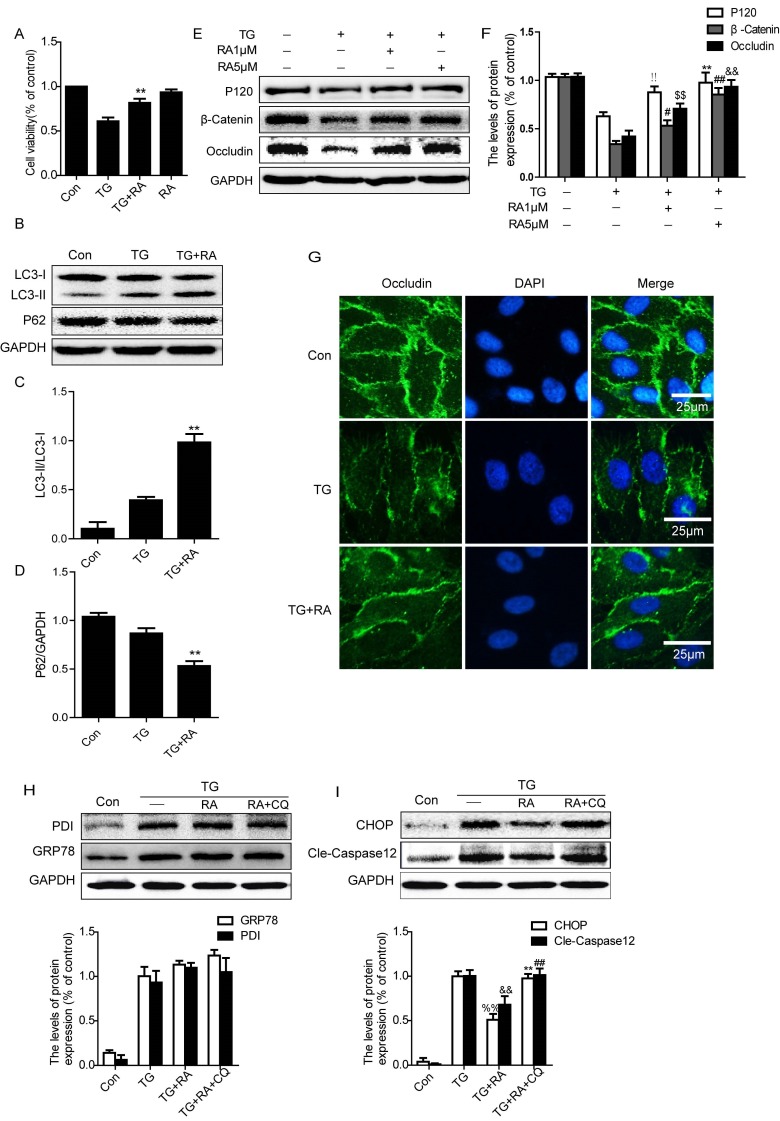
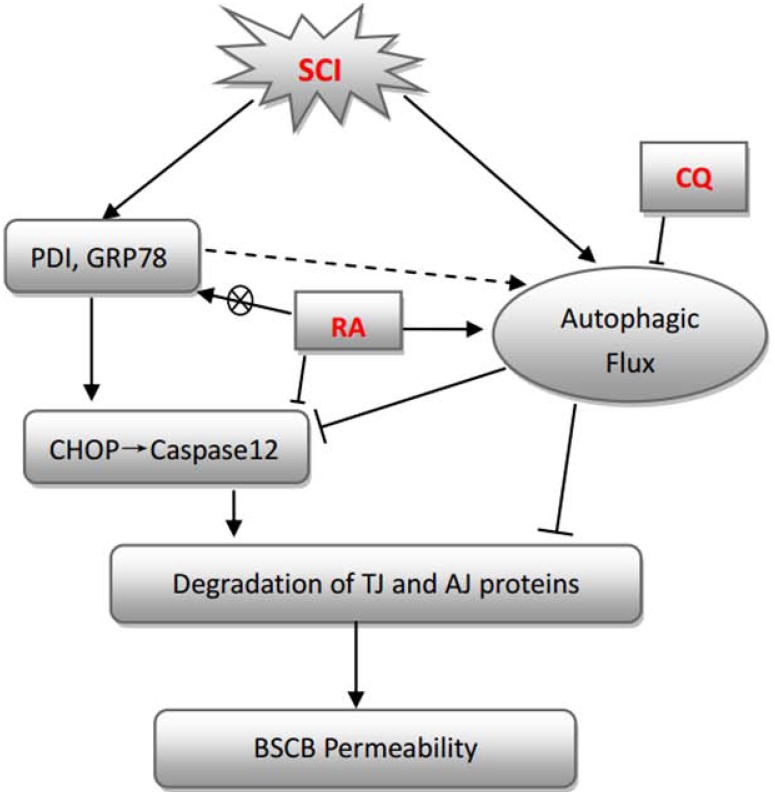
Spinal cord injury (SCI) induces the disruption of the blood-spinal cord barrier (BSCB) which leads to infiltration of blood cells, an inflammatory response, and neuronal cell death, resulting spinal cord secondary damage. Retinoic acid (RA) has a neuroprotective effect in both ischemic brain injury and SCI, however the relationship between BSCB disruption and RA in SCI is still unclear. In this study, we demonstrated that autophagy and ER stress are involved in the protective effect of RA on the BSCB. RA attenuated BSCB permeability and decreased the loss of tight junction (TJ) molecules such as P120, β-catenin, Occludin and Claudin5 after injury in vivo as well as in Brain Microvascular Endothelial Cells (BMECs). Moreover, RA administration improved functional recovery in the rat model of SCI. RA inhibited the expression of CHOP and caspase-12 by induction of autophagic flux. However, RA had no significant effect on protein expression of GRP78 and PDI. Furthermore, combining RA with the autophagy inhibitor chloroquine (CQ) partially abolished its protective effect on the BSCB via exacerbated ER stress and subsequent loss of tight junctions. Taken together, the neuroprotective role of RA in recovery from SCI is related to prevention of of BSCB disruption via the activation of autophagic flux and the inhibition of ER stress-induced cell apoptosis. These findings lay the groundwork for future translational studies of RA for CNS diseases, especially those related to BSCB disruption.
Keywords: autophagy; blood-spinal cord barrier (BSCB); endocytoplasmic reticulum (ER) stress; retinoic acid (RA); spinal cord injury (SCI).
Conflict of interest statement
Competing Interests: The authors have declared that no competing interest exists.
Figures
Similar articles
-
Dl-3-n-butylphthalide prevents the disruption of blood-spinal cord barrier via inhibiting endoplasmic reticulum stress following spinal cord injury.Int J Biol Sci. 2017 Nov 27;13(12):1520-1531. doi: 10.7150/ijbs.21107. eCollection 2017. Int J Biol Sci. 2017. PMID: 29230100 Free PMC article.
-
Retinoic Acid Prevents Disruption of Blood-Spinal Cord Barrier by Inducing Autophagic Flux After Spinal Cord Injury.Neurochem Res. 2016 Apr;41(4):813-25. doi: 10.1007/s11064-015-1756-1. Epub 2015 Nov 18. Neurochem Res. 2016. Retraction in: Neurochem Res. 2021 Feb;46(2):423. doi: 10.1007/s11064-020-03149-1. PMID: 26582233 Retracted.
-
Lithium chloride contributes to blood-spinal cord barrier integrity and functional recovery from spinal cord injury by stimulating autophagic flux.Biochem Biophys Res Commun. 2018 Jan 22;495(4):2525-2531. doi: 10.1016/j.bbrc.2017.12.119. Epub 2017 Dec 21. Biochem Biophys Res Commun. 2018. PMID: 29274777
-
Experimental treatments to attenuate blood spinal cord barrier rupture in rats with traumatic spinal cord injury: A meta-analysis and systematic review.Front Pharmacol. 2022 Aug 23;13:950368. doi: 10.3389/fphar.2022.950368. eCollection 2022. Front Pharmacol. 2022. PMID: 36081932 Free PMC article.
-
Blood-Spinal Cord Barrier in Spinal Cord Injury: A Review.J Neurotrauma. 2021 May 1;38(9):1203-1224. doi: 10.1089/neu.2020.7413. Epub 2021 Feb 16. J Neurotrauma. 2021. PMID: 33292072 Review.
Cited by
-
Dl-3-n-butylphthalide prevents the disruption of blood-spinal cord barrier via inhibiting endoplasmic reticulum stress following spinal cord injury.Int J Biol Sci. 2017 Nov 27;13(12):1520-1531. doi: 10.7150/ijbs.21107. eCollection 2017. Int J Biol Sci. 2017. PMID: 29230100 Free PMC article.
-
Retraction Note to: Retinoic Acid Prevents Disruption of Blood-Spinal Cord Barrier by Inducing Autophagic Flux After Spinal Cord Injury.Neurochem Res. 2021 Feb;46(2):423. doi: 10.1007/s11064-020-03149-1. Neurochem Res. 2021. PMID: 33057960 No abstract available.
-
Pyroptosis, ferroptosis, and autophagy in spinal cord injury: regulatory mechanisms and therapeutic targets.Neural Regen Res. 2025 Oct 1;20(10):2787-2806. doi: 10.4103/NRR.NRR-D-24-00112. Epub 2024 Jul 29. Neural Regen Res. 2025. PMID: 39101602 Free PMC article.
-
Crosstalk Between Cell Death and Spinal Cord Injury: Neurology and Therapy.Mol Neurobiol. 2024 Dec;61(12):10271-10287. doi: 10.1007/s12035-024-04188-3. Epub 2024 May 7. Mol Neurobiol. 2024. PMID: 38713439 Review.
-
Metformin relieves neuropathic pain after spinal nerve ligation via autophagy flux stimulation.J Cell Mol Med. 2019 Feb;23(2):1313-1324. doi: 10.1111/jcmm.14033. Epub 2018 Nov 19. J Cell Mol Med. 2019. PMID: 30451370 Free PMC article.
References
-
- Abbott NJ, Patabendige AA, Dolman DE, Yusof SR, Begley DJ. Structure and function of the blood-brain barrier. Neurobiology of disease. 2010;37:13–25. - PubMed
-
- Cardoso FL, Brites D, Brito MA. Looking at the blood-brain barrier: molecular anatomy and possible investigation approaches. Brain research reviews. 2010;64:328–63. - PubMed
-
- Bartanusz V, Jezova D, Alajajian B, Digicaylioglu M. The blood-spinal cord barrier: morphology and clinical implications. Annals of neurology. 2011;70:194–206. - PubMed
-
- Palmer AM. The role of the blood-CNS barrier in CNS disorders and their treatment. Neurobiology of disease. 2010;37:3–12. - PubMed
Publication types
MeSH terms
Substances
Grants and funding
LinkOut - more resources
Full Text Sources
Other Literature Sources
Medical
Research Materials
Miscellaneous
