. 2016 Jan 12;23(1):206-19.
doi: 10.1016/j.cmet.2015.12.004. Epub 2015 Dec 24.

NANOG Metabolically Reprograms Tumor-Initiating Stem-like Cells through Tumorigenic Changes in Oxidative Phosphorylation and Fatty Acid Metabolism

Affiliations

NANOG Metabolically Reprograms Tumor-Initiating Stem-like Cells through Tumorigenic Changes in Oxidative Phosphorylation and Fatty Acid Metabolism

Chia-Lin Chen et al. Cell Metab. .

Erratum in

Abstract

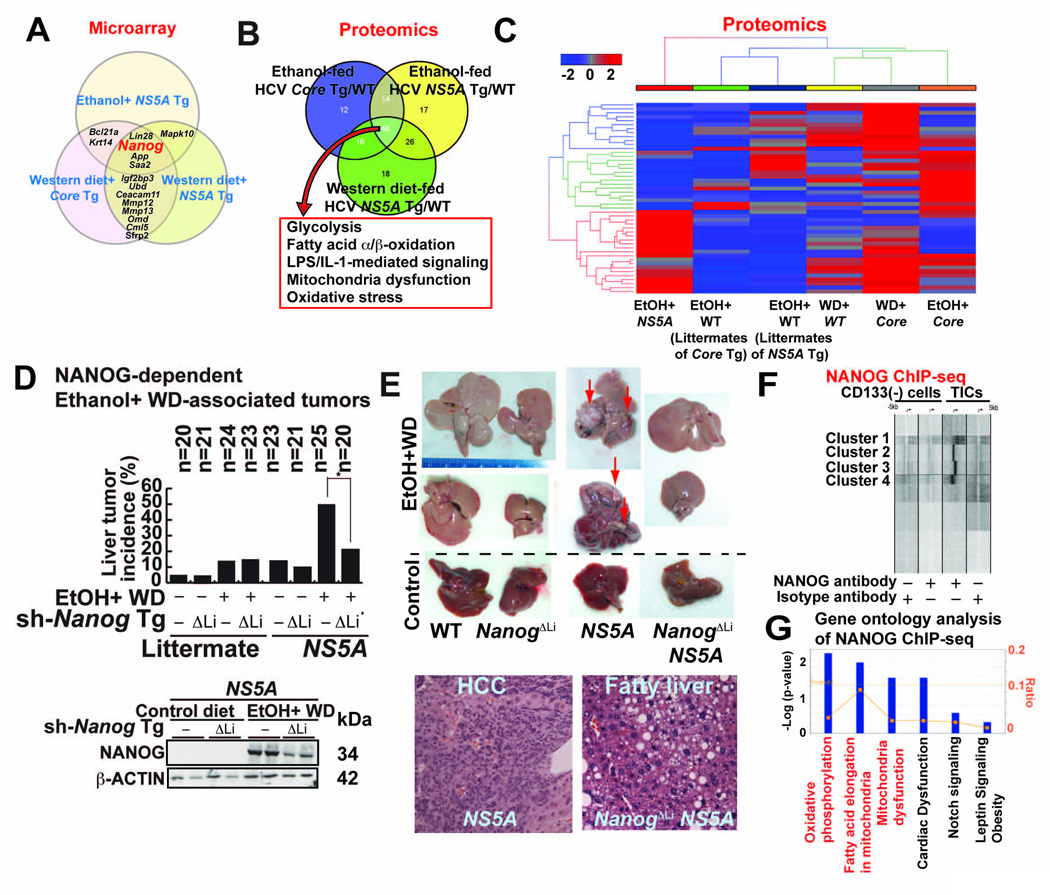
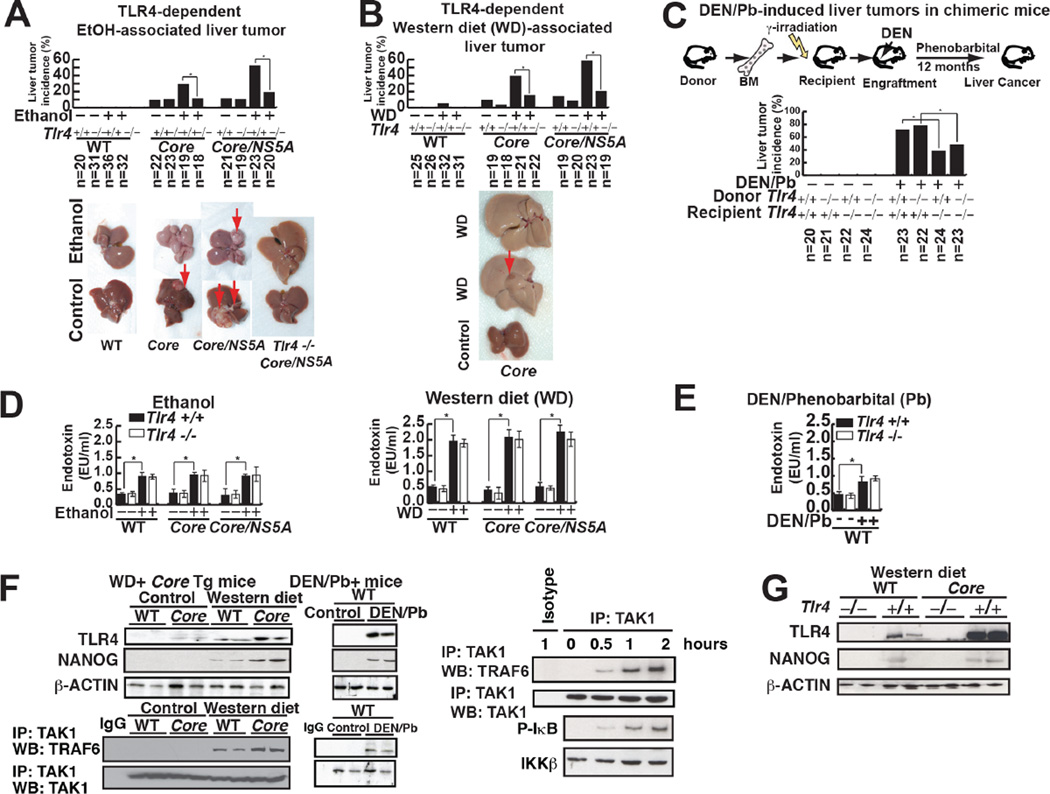
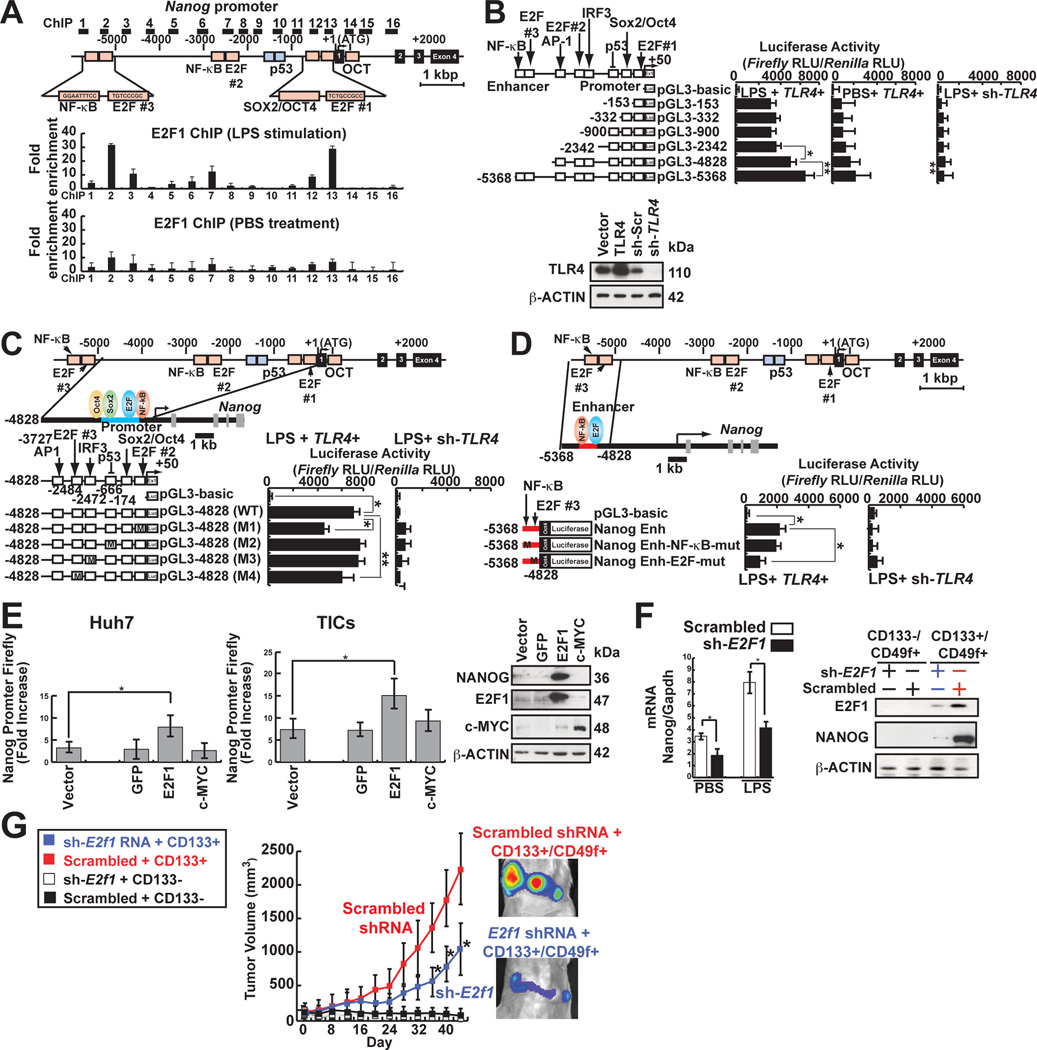
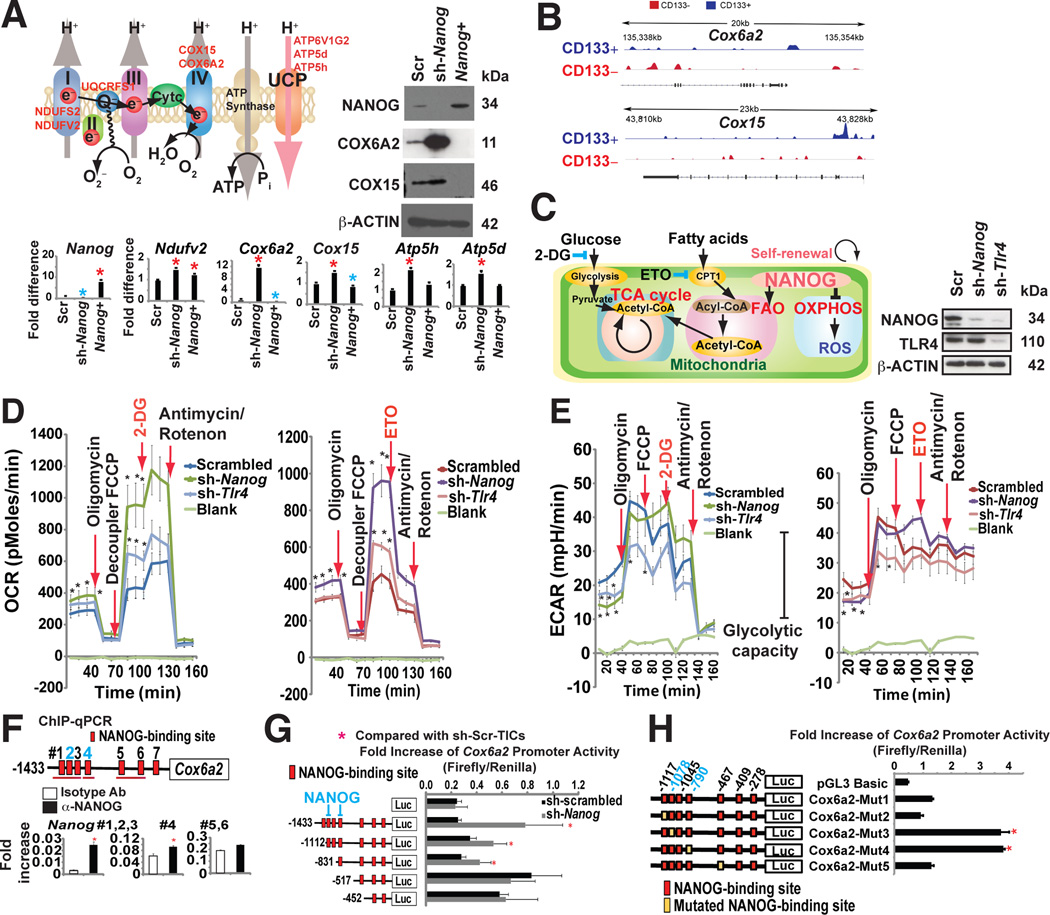
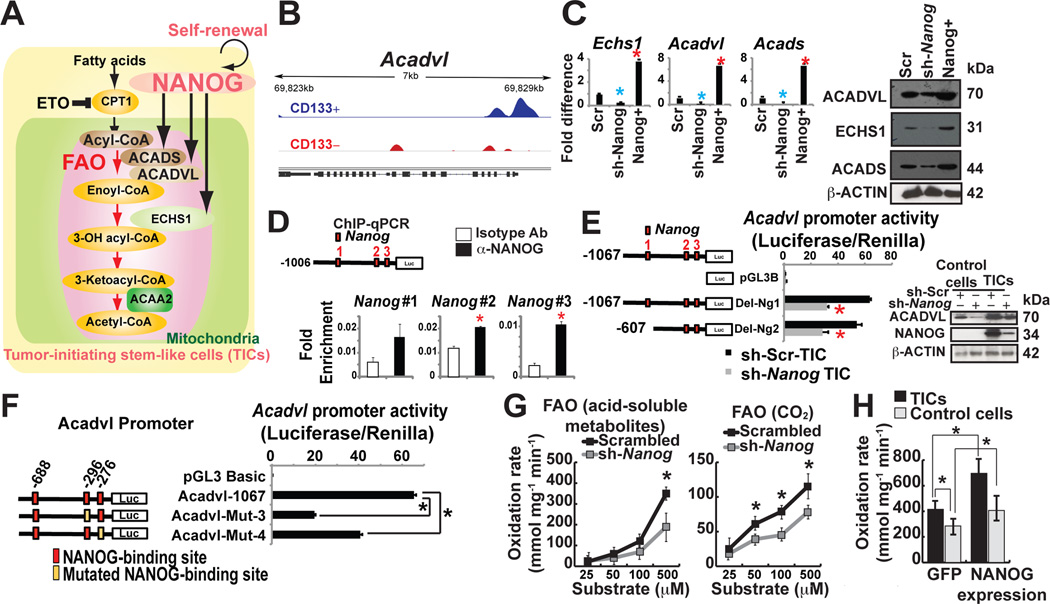
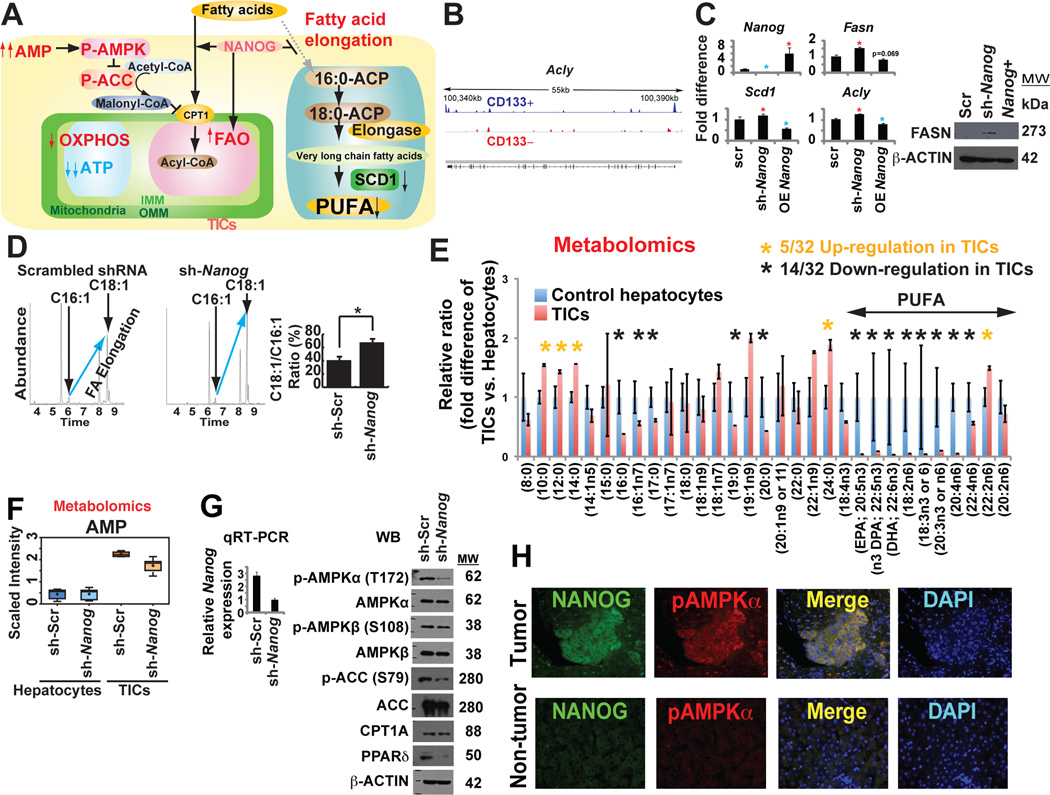
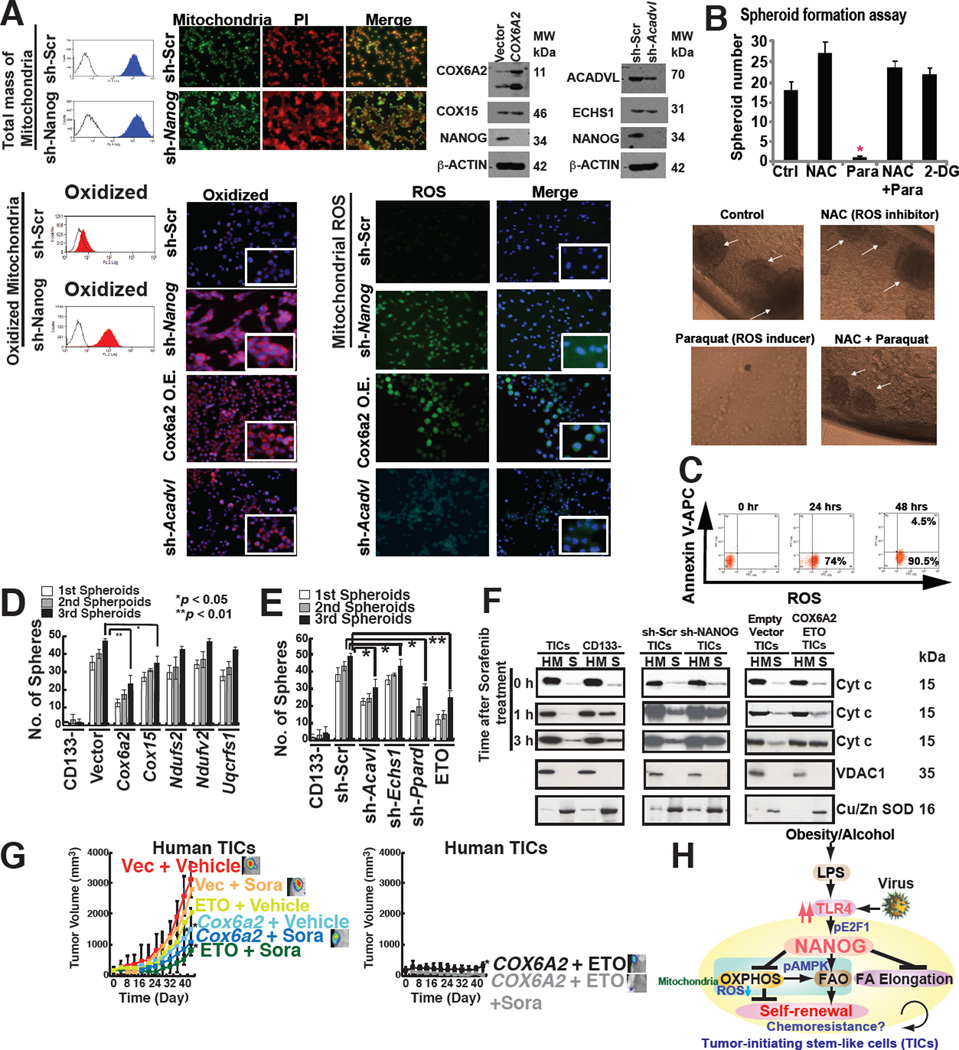
Stem cell markers, including NANOG, have been implicated in various cancers; however, the functional contribution of NANOG to cancer pathogenesis has remained unclear. Here, we show that NANOG is induced by Toll-like receptor 4 (TLR4) signaling via phosphorylation of E2F1 and that downregulation of Nanog slows down hepatocellular carcinoma (HCC) progression induced by alcohol western diet and hepatitis C virus protein in mice. NANOG ChIP-seq analyses reveal that NANOG regulates the expression of genes involved in mitochondrial metabolic pathways required to maintain tumor-initiating stem-like cells (TICs). NANOG represses mitochondrial oxidative phosphorylation (OXPHOS) genes, as well as ROS generation, and activates fatty acid oxidation (FAO) to support TIC self-renewal and drug resistance. Restoration of OXPHOS activity and inhibition of FAO renders TICs susceptible to a standard care chemotherapy drug for HCC, sorafenib. This study provides insights into the mechanisms of NANOG-mediated generation of TICs, tumorigenesis, and chemoresistance through reprogramming of mitochondrial metabolism.

Keywords: HCC; NANOG; OXPHOS; fatty acid; liver; metabolic reprogramming; self-renewal; tumor-initiating stem-like cells (TICs).


Figures

Fig. 1
Fig. 1. NANOG plays a critical role in liver oncogenesis
(A) Results of gene expression microarray comparing liver cancers arising from feeding of ethanol or Western diet (WD)-fed in HCV NS5A transgenic mice and WD+ HCV Core transgenic (Tg) mice. Venn diagram shows genes associated with each etiology and those shared among two or more liver cancer models. (B) Summary of proteomic analysis of three mouse liver cancer models listed in A. All models showed similar metabolomic properties as shown in the Venn diagram. (C) Heat map showing more extensive proteomic signatures in liver cancer models: alcohol+NS5A; alcohol alone, high cholesterol high- fat Western diet (WD); WD+HCV core gene, and alcohol + HCV core gene. Animals used were either wt, transgenic for either NS5A or core, as indicated. (D) Western diet (WD) combined with alcohol increased tumor incidence in NS5A Tg mice compared to control. Upper panel-tumor incidence percentage. Lower panel-immunoblot of Nanog expression. Sh-Nanog Tg indicates animals receiving inducible transgene for NANOG silencing. (E) Liver tumor formation in NANOG and NS5A Tg mice. Upper panel, liver tumors arising from NS5A and Nanog showing contributions of alcohol+Western diet. Knockdown of NANOG (ΔLi), as indicated, reduced tumor incidence in wt control and NS5A mice. Lower panel-liver histology showing pathology is increased following Nanog knockdown in NS5A Tg mice. (F) NANOG ChIP analysis: comparison of promoter fragments from CD133 and CD133+ cell populations. (G) Summary of gene ontology families identified by NANOG ChIP-seq analysis.
Fig. 2
Fig. 2. The tumor incidence in several HCC mouse models is TLR4-dependent
(A) Effect of alcohol feeding on tumor formation in Core and NS5A transgenic mice. Upper panel summary of liver tumor incidence among experimental animals: wt, HCV-Core (Core) and HCV-Core+NS5A (Core/NS5A) transgenic mice. Lower panel-the effect of ethanol feeding to wt and transgenic mice on liver tumor development. (B) TLR4 is required for tumor development in Western diet fed (WD) HCV Tg mice. Upper panel-tumor incidence among wt and transgenic mice fed WD. Lower panel-the effect of WD on wt and Tg mice tumor development. (C) TLR4-dependent TICs from DEN/Phenobarbital (Pb) and human HCC (non-viral etiology: no HCV) models. Chimeric mice were generated by transplantation of BM from Tlr4+/+ or Tlr4−/− mice into irradiated Tlr4+/+ or Tlr4−/− mice. DEN-Pb-induced tumor incidence is reduced by recipient TLR4 deficiency but not by donor Tlr4 deficiency. (D and E) Effect of alcohol and WD feeding on plasma endotoxin levels in transgenic mouse genotypes. Alcohol WD feeding equally elevated plasma endotoxin levels in all genotype mice. Serum endotoxin levels are elevated equally in both Tlr4+/+ and Tlr4−/− mice fed ethanol or WD (D) or diethylnitrosamine (DEN)/phenobarbital (Pb) treatment (E). Left panel-effect of alcohol feeding on single and double-transgenic animals. Right panel-effect of WD feeding on single and double transgenic animals. Plasma endotoxin levels were measured in wt, HCV-Core, HCV-NS5A and Tlr4−/− double Tg strains of the wt and single Tg animals, as indicated. (F) TLR4 is induced in the liver tumor samples from the DEN/Phenobarbital HCC models. Activated TLR4 signaling is evident only in HCV Core fed Western diet (WD) as demonstrated by co-immunoprecipitation analysis showing TRAF6 interaction with TAK1. Induction of TLR4 and NANOG were detected in HCV Core Tg livers fed WD or DEN/Phenobarbital-treated mice. (G) Tlr4 mutant mice fed Western diet for 12 months have less NANOG protein levels.
Fig. 3
Fig. 3. TLR4 signaling transactivates Nanog promoter through E2F1-binding sites
(A) Nanog promoter ChIP assay using anti-E2F1 antibody following qPCR in TICs. E2F1 showed enrichment in Nanog promoter. (B) Truncated promoter luciferase constructs were used to map the region responsive to TLR4 signaling. LPS-mediated Nanog promoter activity is compare with PBS (Vehicle)-treated cells to demonstrate Nanog promoter activity upon TLR4 stimulation (n=3). *: P < 0.05, **: P < 0.01. (C and D) E2F1-binding sites were required for efficient Nanog transactivation (n=4). Four mutant-luciferase plasmids were constructed by in vitro mutagenesis “M” indicates the sites of mutation. (D) E2F1 (blue oval) regulated Nanog enhancer for LPS-induced activation. (E) Overexpression of E2F1 resulted in NANOG promoter activation. Gfp, E2F1 or c-MYC were overexpressed in Huh7 cells and examined for luciferase reporter activities in response to LPS stimulation. (F) Silencing E2F1 reduced Nanog mRNA and protein levels in response to LPS. (G) Silencing E2F1 reduced tumor growth in NOG mice.
Fig. 4
Fig. 4. NANOG reduced mitochondrial OXPHOS preventing mitochondrial ROS production
(A) Effect of NANOG on expression of selected OXPHOS enzymes. A representative model (inset) shows the putative relationship of Nanog silencing to corresponding increased OXPHOS gene expression in TICs. (B) NANOG ChIP-seq analysis identified mitochondrial OXPHOS genes are major NANOG regulated genes. (C) The Etomoxir (ETO: CPT1 inhibitor)-blocked component of oxygen consumption rate (OCR) and glycolysis inhibitor 2-deoxyglucose (2-DG)-blocked the glycolytic component of extracellular acidification rate. ETO inhibits CPT1 to block entry of fatty acid into mitochondria. (D) Seahorse assays demonstrated that NANOG silencing promoted increased oxygen consumption rate (OCR). Effects of oligomycin, FCCP, 2-DG or ETO, and antimycin/rotenone on OCR were evaluated in the Nanog-silenced TICs (sh-Nanog) and scrambled shRNA-transduced TICs. Real-time measurement of OCR showed that ETO but not 2-DG abrogated FCCP-induced OCR. NANOG silencing switched between FAO and glucose utilization (an adult-like metabolic pattern). (E) Silencing Nanog or Tlr4 reduced ECAR, demonstrating that inhibition of Nanog or Tlr4 reduced glycolytic activity. (Left and Right) ECAR of sh-Scr-TICs represented with a dark blue plot cells that were transduced with lenti-sh-Nanog is shown with a dark green line and lenti-sh-Tlr4 transduced cells are indicated by a light blue line (Left) ECAR represents the sum of FAO and glycolysis, respectively. ECAR measurement after ETO inhibition of β-oxidation showed a rapid decrease of glycolysis only in the sh-Nanog-TICs; yet, sh-Scr-TICs, ETO did not affect ECAR (glycolysis). (Right) ETO treatment does not affect ECAR in sh-Scr-TICs while ETO treatment inhibits ECAR in sh-Nanog-TICs, indicating that TICs are dependent on glycolysis, but inhibition of fatty acid import into mitochondria only inhibits glycolytic activity in sh-Nanog-TICs, but not sh-Scr-TICs. (F) ChIP-qPCR of NANOG in Cox6a2 promoter of TICs. (G) Truncation of Nanog promoter identified region responsive to NANOG-mediated inhibition (n=3, *: P < 0.05). Promoter activity increased by deletion of the promoter segment containing critical cis-element(s). (H) Mutagenesis in NANOG binding sites (−1078 and −790) promotes Cox6a2 promoter activity (n=3, *: P < 0.05).
Figure 5
Figure 5. NANOG promoted mitochondrial FAO
(A) Hypothetical model of NANOG-mediated metabolic reprogramming. (B) NANOG ChIP-seq analysis identified FAO genes are NANOG regulated genes (i.e., Acadvl). (C) qRT-PCR and immunoblot analysis of NANOG-target FAO genes in sh-Nanog or Nanog-overexpressing TICs. (D) ChIP-qPCR of NANOG in the Acadvl promoter in TICs. (E, left) Acadvl promoter luciferase constructs used to map the region responsive to NANOG-mediated inhibition. (E, right) Protein levels of FAO enzymes (ACADVL) were measured by immunoblot in TICs expressing sh-NANOG. (F) Mutations in NANOG binding sites in ACADVL promoter reduced ACADVL promoter activity. (G) FAO was measured by incubation of extracts from sh-scrambled and sh-Nanog-TICs with [14C]palmitate; recovery of acid-soluble metabolites (G, left) and captured 14CO2 (G, right) (n = 5 per genotype, *P < 0.05). (H) Overexpression of Nanog induced FAO oxidation rate. FAO was measured by incubation of [3H] palmitate in TICs transfected with NANOG-expression vectors and vector control one week after transfection of vectors expressing GFP or sh-Nanog (acid-soluble metabolites, n = 3–4 per category). *P < 0.05.
Fig. 6
Fig. 6. NANOG inhibited mitochondrial fatty acid elongation and promotes AMP/ATP ratio increase with AMPKα phosphorylation
(A) Schematic diagram of the proposed role of NANOG in mitochondrial metabolic reprogramming. AMPK activation in the increased ratio of AMP/ATP leads to phosphorylation of ACC to reduce malonyl CoA levels and thus increase mitochondrial fatty acid uptake (via de-repression of CPT1). (B) NANOG ChIP-seq analysis identified that FAO elongation genes (i.e., Acly) were NANOG-regulated genes. (C) qRT-PCR analysis of representative genes associated with fatty acid elongation and synthesis. (D) Rate of fatty acid elongation was affected in Nanog silenced TICs using GC-MS with stable isotope 14C. The relative ratio of C18:1/C16:1 (oleate/palmitoleate) was determined from measured levels. (E) Abnormal reduction of unsaturated long-chain or polyunsaturated fatty acids (PUFA) in TICs compared to those in hepatocytes. Metabolomics analyses were performed on mouse TICs and control hepatocytes transduced with sh-Nanog or scrambled shRNA control (n = 5 per group). (F) Adenosine 5’-monophosphate (AMP) levels increased in TICs whereas Nanog silencing reduced AMP level as determined from metabolomics analysis. (G) The sh-Nanog treatment of TICs affected phosphorylation of AMPKα and AMPKβ associated with ACC phosphorylation. (H) Phospho-AMPK level was increased in human tumor tissues.
Fig. 7
Fig. 7. NANOG orchestrated TIC oncogenic and therapeutic resistance mechanisms via mitochondrial metabolic reprogramming
(A) Mitochondrial ROS production increased in sh-Nanog TICs, but total mitochondrial levels were unchanged in TICs compared to sh-Nanog TICs. (B) ROS inducer Paraquat (Para), but not ROS scavenger (NAC), inhibited spheroid formation, but minimal cell death induction was observed (C). (D) Restoration of OXPHOS genes in TICs promoted self-renewal ability. (E) Silencing OXPHOS genes and FAO genes inhibited spheroid formation. (F) Mitochondrial cytochrome c release was increased by the combination of sorafenib and ETO treatment or overexpression of Cox6a2 in TICs. Cytochrome c release from mitochondria was analyzed by immunoblotting of the cytosol (soluble fraction) and mitochondria-rich (heavy membrane: HM) fractions of the cell lysates. TICs and CD133(−) cells transduced with sh-Nanog were lysed and fractionated into purified heavy membrane (HM) and cytosolic (S) fractions. The fractions were then probed for cytochrome c (Cyt c), VDAC1 and Cu/Zn SOD. (G) Overexpression of Cox6a2 and ETO treatment abrogated drug-resistance and reduced tumor growth. (H) A summary diagram depicting the proposed roles of TLR4/NANOG for metabolic reprogramming and genesis of TICs in liver oncogenesis due to alcohol and HCV. NANOG-induced chemotherapy-resistance occurred via mitochondrial metabolic reprogramming (suppression of mitochondrial OXPHOS and promotion of FAO).

References

    1. Chen CL, Tsukamoto H, Liu JC, Kashiwabara C, Feldman D, Sher L, Dooley S, French SW, Mishra L, Petrovic L, et al. Reciprocal regulation by TLR4 and TGF-beta in tumor-initiating stem-like cells. The Journal of clinical investigation. 2013;123:2832–2849. - PMC - PubMed
    1. Dapito DH, Mencin A, Gwak GY, Pradere JP, Jang MK, Mederacke I, Caviglia JM, Khiabanian H, Adeyemi A, Bataller R, et al. Promotion of hepatocellular carcinoma by the intestinal microbiota and TLR4. Cancer Cell. 2012;21:504–516. - PMC - PubMed
    1. Ferrick DA, Neilson A, Beeson C. Advances in measuring cellular bioenergetics using extracellular flux. Drug Discov Today. 2008;13:268–274. - PubMed
    1. Gripon P, Rumin S, Urban S, Le Seyec J, Glaise D, Cannie I, Guyomard C, Lucas J, Trepo C, Guguen-Guillouzo C. Infection of a human hepatoma cell line by hepatitis B virus. Proceedings of the National Academy of Sciences of the United States of America. 2002;99:15655–15660. - PMC - PubMed
    1. Gutgesell A, Wen G, Konig B, Koch A, Spielmann J, Stangl GI, Eder K, Ringseis R. Mouse carnitine-acylcarnitine translocase (CACT) is transcriptionally regulated by PPARalpha and PPARdelta in liver cells. Biochim Biophys Acta. 2009;1790:1206–1216. - PubMed

Publication types

MeSH terms