

Long-Term In Vitro Expansion of Salivary Gland Stem Cells Driven by Wnt Signals
- PMID: 26724906
- PMCID: PMC4720006
- DOI: 10.1016/j.stemcr.2015.11.009
Long-Term In Vitro Expansion of Salivary Gland Stem Cells Driven by Wnt Signals
Abstract
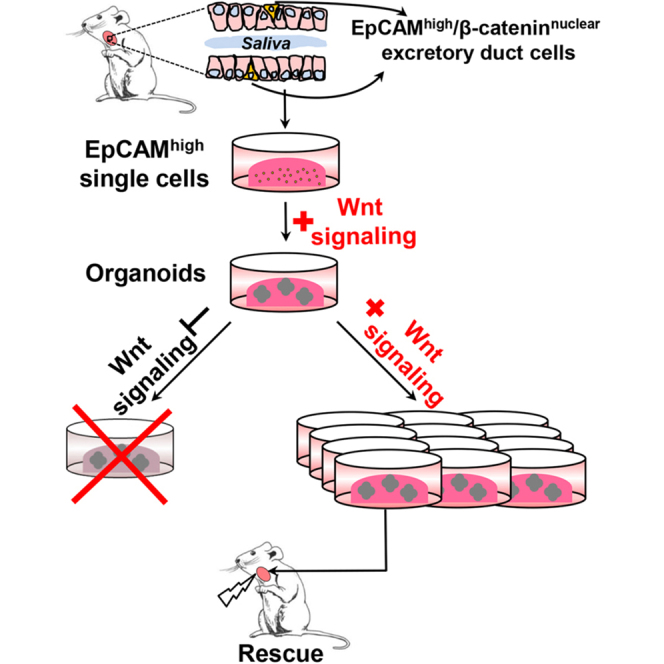
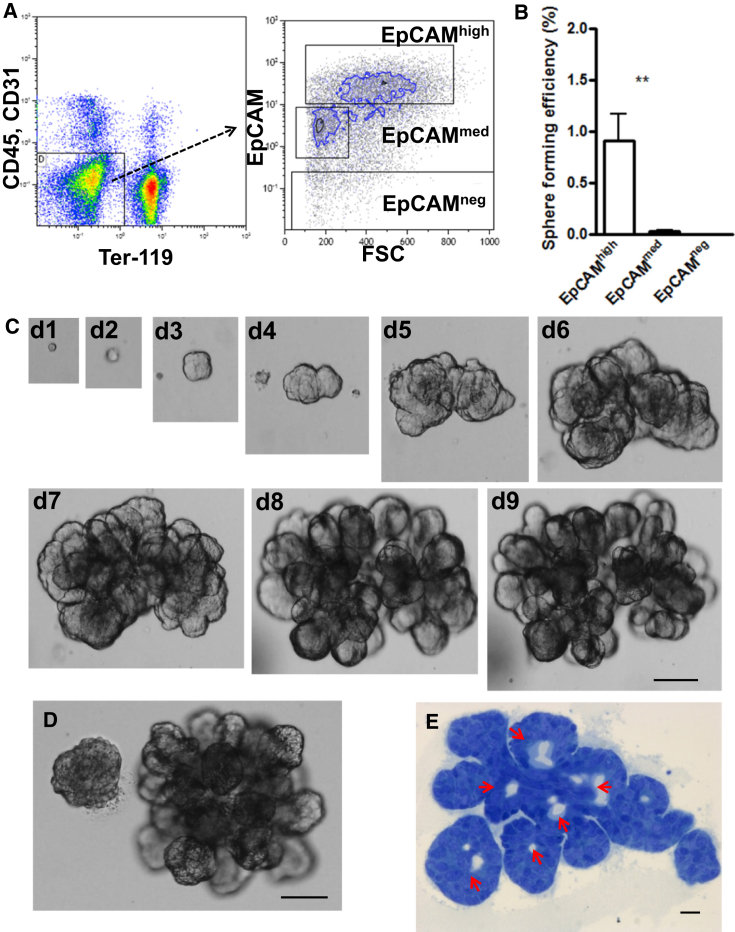
Adult stem cells are the ultimate source for replenishment of salivary gland (SG) tissue. Self-renewal ability of stem cells is dependent on extrinsic niche signals that have not been unraveled for the SG. The ductal compartment in SG has been identified as the location harboring stem cells. Here, we report that rare SG ductal EpCAM(+) cells express nuclear β-catenin, indicating active Wnt signaling. In cell culture experiments, EpCAM(high) cells respond potently to Wnt signals stimulating self-renewal and long-term expansion of SG organoids, containing all differentiated SG cell types. Conversely, Wnt inhibition ablated long-term organoid cultures. Finally, transplantation of cells pre-treated with Wnt agonists into submandibular glands of irradiated mice successfully and robustly restored saliva secretion and increased the number of functional acini in vivo. Collectively, these results identify Wnt signaling as a key driver of adult SG stem cells, allowing extensive in vitro expansion and enabling restoration of SG function upon transplantation.
Copyright © 2016 The Authors. Published by Elsevier Inc. All rights reserved.
Figures


Similar articles
-
Wnt/β-catenin signaling regulates postnatal development and regeneration of the salivary gland.Stem Cells Dev. 2010 Nov;19(11):1793-801. doi: 10.1089/scd.2009.0499. Epub 2010 Sep 10. Stem Cells Dev. 2010. PMID: 20367250 Free PMC article.
-
Stem cell properties of human clonal salivary gland stem cells are enhanced by three-dimensional priming culture in nanofibrous microwells.Stem Cell Res Ther. 2018 Mar 22;9(1):74. doi: 10.1186/s13287-018-0829-x. Stem Cell Res Ther. 2018. PMID: 29566770 Free PMC article.
-
Protective efficacy of intravenous transplantation of adipose-derived stem cells for the prevention of radiation-induced salivary gland damage.Arch Oral Biol. 2015 Oct;60(10):1488-96. doi: 10.1016/j.archoralbio.2015.07.016. Epub 2015 Jul 29. Arch Oral Biol. 2015. PMID: 26263537
-
Unveiling Stem Cell Heterogeneity Toward the Development of Salivary Gland Regenerative Strategies.Adv Exp Med Biol. 2019;1123:151-164. doi: 10.1007/978-3-030-11096-3_9. Adv Exp Med Biol. 2019. PMID: 31016599 Review.
-
Concise Review: A Critical Evaluation of Criteria Used to Define Salivary Gland Stem Cells.Stem Cells. 2019 Sep;37(9):1144-1150. doi: 10.1002/stem.3046. Epub 2019 Jun 19. Stem Cells. 2019. PMID: 31175700 Free PMC article. Review.
Cited by
-
Organoids from patient biopsy samples can predict the response of BC patients to neoadjuvant chemotherapy.Ann Med. 2022 Dec;54(1):2581-2597. doi: 10.1080/07853890.2022.2122550. Ann Med. 2022. PMID: 36194178 Free PMC article.
-
Strategies for Developing Functional Secretory Epithelia from Porcine Salivary Gland Explant Outgrowth Culture Models.Biomolecules. 2019 Oct 25;9(11):657. doi: 10.3390/biom9110657. Biomolecules. 2019. PMID: 31717706 Free PMC article.
-
Fabrication of Dentin-Pulp-Like Organoids Using Dental-Pulp Stem Cells.Cells. 2020 Mar 6;9(3):642. doi: 10.3390/cells9030642. Cells. 2020. PMID: 32155898 Free PMC article.
-
Establishment of nasal and olfactory epithelium organoids for unveiling mechanism of tissue regeneration and pathogenesis of nasal diseases.Cell Mol Life Sci. 2025 Jan 3;82(1):33. doi: 10.1007/s00018-024-05557-w. Cell Mol Life Sci. 2025. PMID: 39751829 Free PMC article. Review.
-
Extracellular Vesicles for the Treatment of Radiation Injuries.Front Pharmacol. 2021 May 18;12:662437. doi: 10.3389/fphar.2021.662437. eCollection 2021. Front Pharmacol. 2021. PMID: 34084138 Free PMC article. Review.
References
-
- Ball W.D. Development of the rat salivary glands. 3. Mesenchymal specificity in the morphogenesis of the embryonic submaxillary and sublingual glands of the rat. J. Exp. Zool. 1974;188:277–288. - PubMed
-
- Barker N., van Es J.H., Kuipers J., Kujala P., van den Born M., Cozijnsen M., Haegebarth A., Korving J., Begthel H., Peters P.J. Identification of stem cells in small intestine and colon by marker gene Lgr5. Nature. 2007;449:1003–1007. - PubMed
-
- Barker N., Huch M., Kujala P., van de Wetering M., Snippert H.J., van Es J.H., Sato T., Stange D.E., Begthel H., van den Born M. Lgr5(+ve) stem cells drive self-renewal in the stomach and build long-lived gastric units in vitro. Cell Stem Cell. 2010;6:25–36. - PubMed
-
- Barker N., Rookmaaker M.B., Kujala P., Ng A., Leushacke M., Snippert H., van de Wetering M., Tan S., Van Es J.H., Huch M. Lgr5(+ve) stem/progenitor cells contribute to nephron formation during kidney development. Cell Rep. 2012;2:540–552. - PubMed
Publication types
MeSH terms
Substances
LinkOut - more resources
Full Text Sources
Other Literature Sources
Medical
Miscellaneous
