. 2016 Jan 21;61(2):260-73.
doi: 10.1016/j.molcel.2015.12.001. Epub 2015 Dec 24.

Nuclear Architecture Organized by Rif1 Underpins the Replication-Timing Program

Affiliations

Nuclear Architecture Organized by Rif1 Underpins the Replication-Timing Program

Rossana Foti et al. Mol Cell. .

Abstract

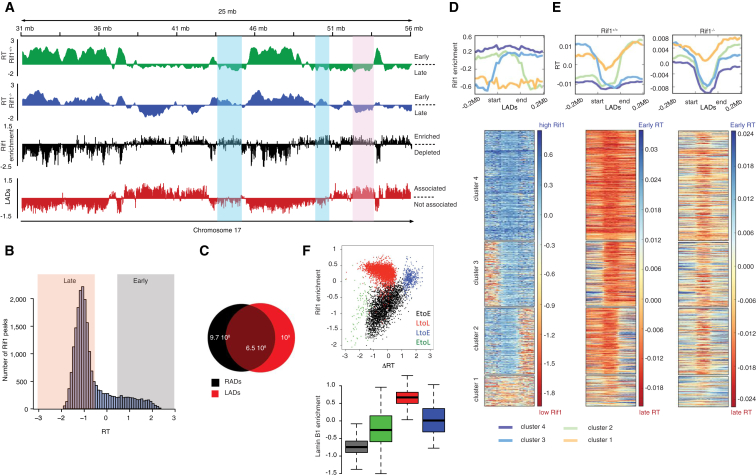
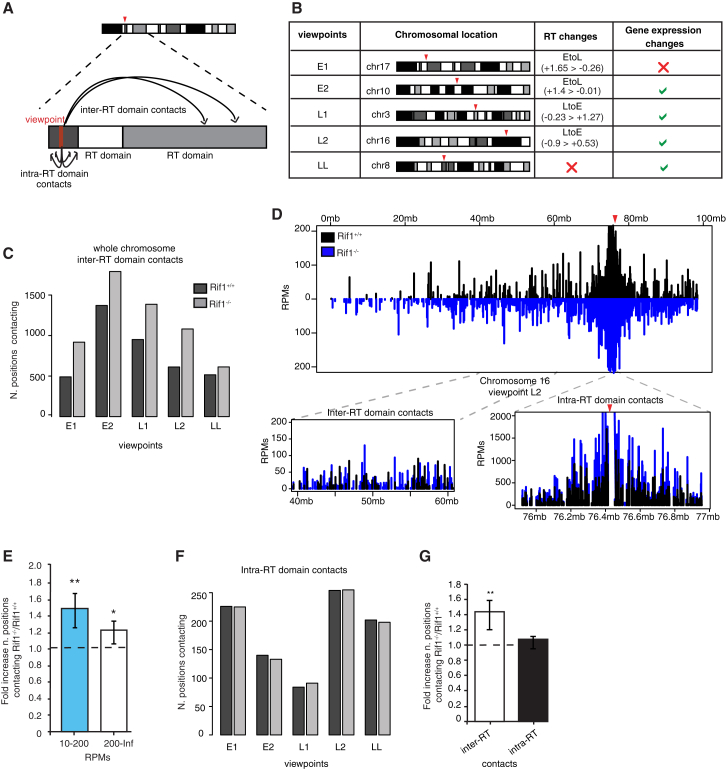
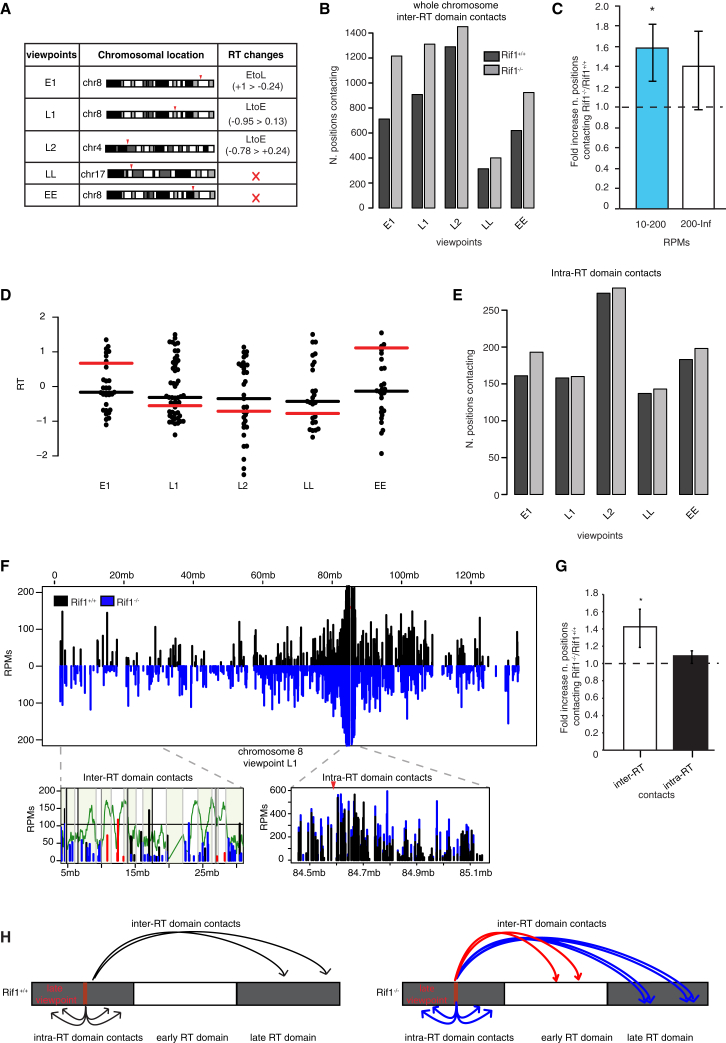
DNA replication is temporally and spatially organized in all eukaryotes, yet the molecular control and biological function of the replication-timing program are unclear. Rif1 is required for normal genome-wide regulation of replication timing, but its molecular function is poorly understood. Here we show that in mouse embryonic stem cells, Rif1 coats late-replicating domains and, with Lamin B1, identifies most of the late-replicating genome. Rif1 is an essential determinant of replication timing of non-Lamin B1-bound late domains. We further demonstrate that Rif1 defines and restricts the interactions between replication-timing domains during the G1 phase, thereby revealing a function of Rif1 as organizer of nuclear architecture. Rif1 loss affects both number and replication-timing specificity of the interactions between replication-timing domains. In addition, during the S phase, Rif1 ensures that replication of interacting domains is temporally coordinated. In summary, our study identifies Rif1 as the molecular link between nuclear architecture and replication-timing establishment in mammals.


Figures

None
Graphical abstract
Figure 1
Figure 1
Cell Cycle Responses to Rif1 Deficiency in ESCs (A) Western blot analysis of the Rif1 deletion time course in six independent Rif1−/− and Rif1+/+ cells lines. Left and right panels show 2 and 4 days, respectively, after Cre induction. Smc1 is the loading control. (B) Loess smoothed representative RT profiles averaged from two Rif1+/+ and four Rif1−/− ESC lines. RT = log2(early/late). Regions showing RT switches are shadowed in green. The table summarizes the percentage of RT changes. (C) Using tiles of 60 bp, the genome-wide distribution of the RT scores is shown for averages of two Rif1+/+ and four Rif1−/− lines in ESCs. (D) The 3-(4,5-dimethylthiazol-2-yl)-2,5-diphenyltetrazolium bromide (viability) assay 4 days after Cre induction. Shown are the averages from triplicates of six independent Rif1+/+ versus Rif1−/− ESCs from three experiments. Error bars indicate SDs, and p values were calculated by t test. (E) Cell proliferation measured as the averages from triplicates of six independent Rif1+/+ versus Rif1−/− ESCs from three experiments (paired t test, ∗∗∗p < 0.0001). Error bars indicate SDs. (F) Results 2 and 4 days after Cre-induction cells were assayed for alkaline phosphatase activity. +OHT, Rif1+/+ or Rif1F/F ESCs treated with 4-hydroxytamoxifen for the indicated duration; −OHT, untreated cells. The average of two biological replicas assayed in triplicates is shown. The error bars indicate SDs. The t test reveals no significant difference. See also Figure S1.
Figure 2
Figure 2
ChIP-Seq Analysis of Genome-wide Rif1 Occupancy in ESCs (A) Representative profile from chromosome 17, comparing RT (RT = log2(early/late)) averaged from two Rif1+/+ and four Rif1−/− ESCs, with Rif1 distribution from one representative out of three replicas (enrichment = log2(ChIP/input)) and LADs. Shadowed in blue are late-replicating RAD-LB, switching to early replication in Rif1−/−. In red is highlighted one example of late-replicating RAD-LB+, where Rif1 deletion does not affect RT. (B) Distribution of the RT score over the Rif1 binding profile in one representative ESC line out of three. Late-replicating domains (RT ≤ 0.5) are shadowed pink, and early ones are in gray (RT ≥ 0.5). (C) Venn diagram indicating the overlap in base pairs between LADs and RADs, as defined by the EDD algorithm. One representative out of two independent cell lines analyzed is shown. (D) Meta-analysis of Rif1 distribution over LADs. Flanking regions of ±0.2 Mb (non-LADs) were included around the start and end of each LAD. ChIP-seq data were obtained and analyzed from three independent ESC lines. The results presented are from one representative line. The heatmap shows four classes of LADs that were obtained from unsupervised clustering of the Rif1 data and correspond to the different distributions of Rif1 around the LAD boundaries. (E) Replication status of LADs is shown for Rif1+/+ and Rif1−/− ESCs. The LADs are ordered in the same way as the cluster solution of Rif1 enrichment in (D). (F) Scatter plot showing Rif1 enrichment relative to the RT changes (ΔRT = Rif1−/− − Rif1+/+) and, boxplot showing Lamin B1 association for regions switching (EtoL and LtoE) or not switching (EtoE and LtoL) their RT upon Rif1 deletion. See also Figure S2.
Figure 3
Figure 3
Rif1-Bound Early SNSs Are Not Enriched in EtoL Regions (A) Representative heatmap showing the distribution of the Rif1 signal around SNSs on chromosome 11 for one out of three ESC lines analyzed. For comparison, a random set of loci was chosen from the same region of chromosome 11. (B–F) Analysis of Rif1 enrichment, GC and CpG content, and G4 and OGRE association of early and late SNSs stratified by their overlap with TSSs for one representative out of three ESC lines analyzed. The order of SNSs is identical for all heatmaps. The SNSs were classified as early or late depending on the average score of their replication domains (late: RT < −0.5, early: RT > 0.5, 200 kb bins). (B) Rif1 enrichment (enrichment = log2(ChIP/input)) ±5 kb at the center of SNSs. Rif1 presence depends on SNS association with TSSs in early domains and for a very small number of late-replicating, overlapping SNSs and TSSs. (C and D) Analysis of SNSs’ GC and CpG content. TSS-associated SNSs (same cluster displaying Rif1 enrichment) feature high CG (C) and CpG (D) content. Mean CpG content = CpG/(GC/2)2. (E) G4 motif instances are plotted as black lines in a discretized matrix at the center of SNSs. The heatmap and average profile reveal that SNSs show a prevalence of G4 motifs in all groups, independent of their replication status or overlap with TSSs. (F) As in (E), but for the less abundant OGRE motif. There is no clear association with SNSs, but there is on average a slight preference for origins without TSSs. (G) Changes of RT (ΔRT = Rif1−/− − Rif1+/+) within 500 kb at the center of SNSs. Regions that upon Rif1 deletion change their RT of more than ±1 (LtoE and EtoL; ΔRT > +1 and ΔRT < −1) are considered switching while the others (−1 < ΔRT < +1) are not (EtoE and LtoL). TSS-associated SNSs (same cluster displaying Rif1 enrichment) have the same ΔRT as SNSs that are not associated with TSSs.
Figure 4
Figure 4
Rif1 Is Associated with CpG-Rich TSSs (A–E) Rif1-bound TSSs in the region of chromosome 11, where SNSs have been mapped, were subdivided based on their overlap with SNSs or lack thereof. Data from one representative ESC line out of three analyzed are shown. (A) The mean Rif1’s enrichment at early TSSs is independent of their association with SNSs. However, SNS presence contributes to better enrichment. (B and E) GC content and CpG ratio surrounding TSSs, respectively. Both features are largely independent of RT of the TSSs and their association with SNSs (apart from the group of late TSSs without SNSs). (C and D) Motif content for G4s and OGREs surrounding TSSs, respectively. A clear enrichment of G4s can be observed around early TSSs with SNSs, while the OGRE motif does not correlate with any of the predefined groups. (F and G) Unsupervised clustering of the two largest TSS groups from the investigated region of chromosome 11, based on the CpG ratio. (F) Early TSSs overlapping with SNSs form two clusters differing in their CpG content. Rif1’s enrichment in each cluster is proportional to the corresponding CpG ratio. (G) Early TSSs not associated to SNSs are clearly divided in CpG-rich and no-CpG clusters. Rif1 is enriched only at CpG-rich TSSs.
Figure 5
Figure 5
Rif1 Deficiency Affects Inter-RT Domain Interactions in ESCs (A) Schematic representation of the chromatin contacts, highlighting the distinction between inter- and intra-RT domain interactions. Contacts are positions consistently identified by the r3Cseq software package analysis of 4C-seq data in the two replicates for each Rif1+/+ and Rif1−/− ESC line. (B) Chromosomal location of each viewpoint and associated properties: RT, region associated with RT switches; gene expression changes, region within 1 Mb of a gene whose expression is affected by Rif1 deletion. (C) Plots showing the total number of same-chromosome contacts per viewpoint. (D) Contacts for the viewpoint L2 (red arrowhead). The whole of chromosome 16 is shown, with the insets displaying zoom-in views of the RT domain around the viewpoint (intra-RT domain interactions) and of a more distal region (inter-RT domain interactions). (E) Ratio (fold increase) between the total of positions, with the number of RPMs indicated on the x axis in Rif1−/− versus Rif1+/+ (dashed line), averaged over all viewpoints. Positions are grouped by the supporting number of RPMs as indicated on the x axis. The increase of the number of interactions in both the mid- to low-RPM range (10–200) and the high range (200–information [Inf]) in Rif1−/− is significant, as determined by paired t test (∗∗p = 0.006, p = 0.03). The error bars indicate SDs. (F) Plots showing the total number of interactions per viewpoint inside the corresponding RT domain. (G) Ratio (fold increase) between the number of interactions averaged over all viewpoints, as shown in (C) and (F), in Rif1−/− over Rif1+/+ ESCs (dashed line), taking into consideration the whole genome or only the interactions taking place within the RT domain (paired t test, ∗∗p = 0.006). Error bars indicate SDs. See also Figures S5 and S6.
Figure 6
Figure 6
Rif1 Deletion Affects Nuclear Architecture during the G1 Phase Contacts are positions consistently identified by the r3Cseq software package analysis of 4C-seq data in the two replicates for each Rif1+/+ and Rif1−/− pMEF line in the first G1 phase after deletion. One representative experiment out of two is shown. (A) Summary of the chromosomal location of each viewpoint and associated features. RT, region associated with RT switches. In pMEFs, there are no gene expression changes induced by Rif1 deletion. (B) Plots showing the total number of same-chromosome interactions per viewpoint. (C) Ratio (fold increase) between the total of positions in Rif1−/− versus Rif1+/+ (dashed line). Positions are divided in two classes depending on the number of supporting RPMs. The increase of the number of positions in the low- to mid-RPM range (10–200) in Rif1−/− is significant, as determined by paired t test (p = 0.02). Error bars indicate the SDs. (D) Distribution of RT (RT = log2(early/late)) of the 4C-seq contacts within the TADs that are interacting with the indicated viewpoints, specifically in Rif1−/− pMEFs in the G1 phase. The black line indicates their median RT. The red line is the median RT of the TADs that interact with the viewpoint in both synchronized Rif1+/+ and Rif1−/− pMEFs in Figure S7D and is placed as a reference to appreciate the difference. (E) Plots showing the total number of contacts per viewpoint inside the corresponding RT domain. (F) Contacts for the viewpoint L1 (red arrowhead). The whole of chromosome 8 is shown, with the insets displaying zoom-in views of the RT domain around the viewpoint (right) or a more distal region (left). The insets also show the distributions of TADs in the same regions (gray lines and alternate green shadowing). The RT domain (right) is fully enclosed in a single TAD. In the inset showing the distal region (left), the contacts mapping in TADs that selectively interact with the viewpoint in Rif1−/− cells are shown in red. In green, the RT profile of synchronous Rif1+/+ pMEFs is shown. (G) Ratio between the number of interactions averaged over all viewpoints, as shown in (B) and (E), in Rif1−/− over Rif1+/+ pMEFs (dashed line) calculated for the chromosome hosting the viewpoint (in cis) or only inside the RT domain (paired t test, p = 0.01). Error bars indicate SDs. (H) Schematic interpretation of the data in (B), (E), and (F), illustrating the gain of inter-RT domain interactions (arrows) and the loss of RT specificity of some acquired contacts in Rif1−/− pMEFs for a putative viewpoint (red). The interactions established by the viewpoint in Rif1+/+ are represented by black arrows; the ones established by Rif1−/− cells that fall into TADs shared with Rif1+/+ are blue. The new contacts established by the viewpoint exclusively in Rif1−/− cells and that fall into gained TADs are represented by red arrows. See also Figure S7.

References

    1. Andrulis E.D., Neiman A.M., Zappulla D.C., Sternglanz R. Perinuclear localization of chromatin facilitates transcriptional silencing. Nature. 1998;394:592–595. - PubMed
    1. Beck D.B., Burton A., Oda H., Ziegler-Birling C., Torres-Padilla M.E., Reinberg D. The role of PR-Set7 in replication licensing depends on Suv4-20h. Genes Dev. 2012;26:2580–2589. - PMC - PubMed
    1. Besnard E., Babled A., Lapasset L., Milhavet O., Parrinello H., Dantec C., Marin J.M., Lemaitre J.M. Unraveling cell type-specific and reprogrammable human replication origin signatures associated with G-quadruplex consensus motifs. Nat. Struct. Mol. Biol. 2012;19:837–844. - PubMed
    1. Bianchi A., Shore D. Early replication of short telomeres in budding yeast. Cell. 2007;128:1051–1062. - PubMed
    1. Buonomo S.B., Wu Y., Ferguson D., de Lange T. Mammalian Rif1 contributes to replication stress survival and homology-directed repair. J. Cell Biol. 2009;187:385–398. - PMC - PubMed

Publication types