. 2016 Jan 21;61(2):199-209.
doi: 10.1016/j.molcel.2015.12.002. Epub 2015 Dec 24.

TCA Cycle and Mitochondrial Membrane Potential Are Necessary for Diverse Biological Functions

Affiliations

TCA Cycle and Mitochondrial Membrane Potential Are Necessary for Diverse Biological Functions

Inmaculada Martínez-Reyes et al. Mol Cell. .

Abstract

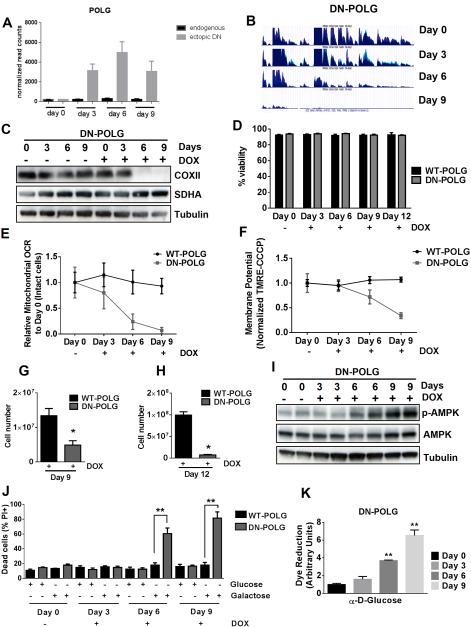
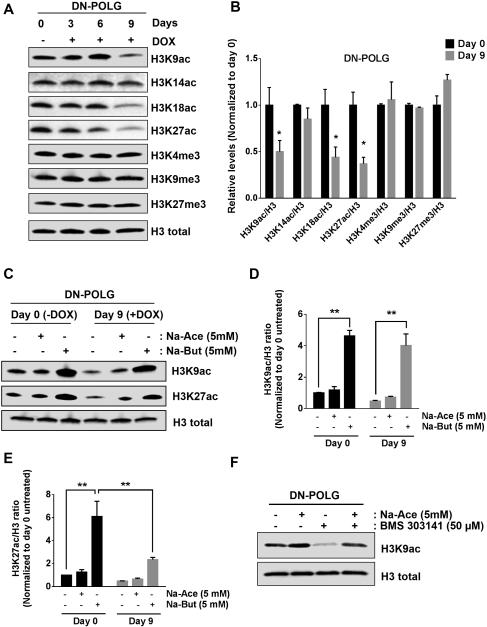
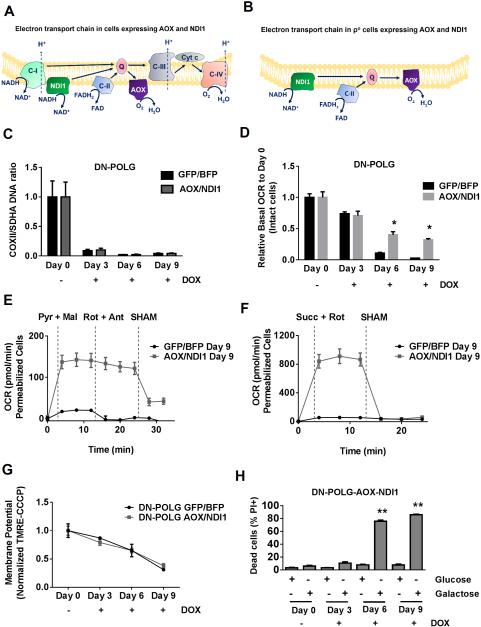
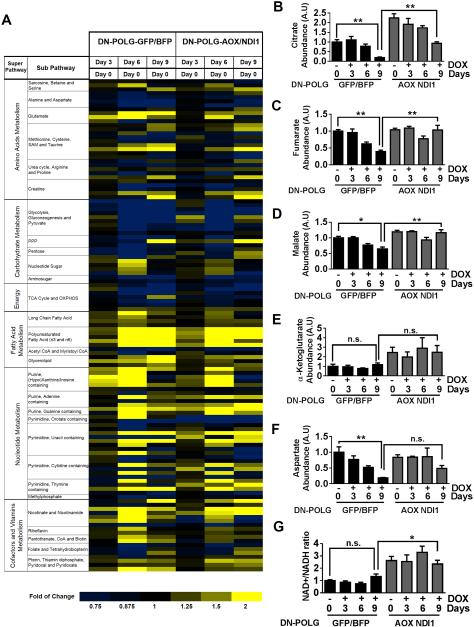
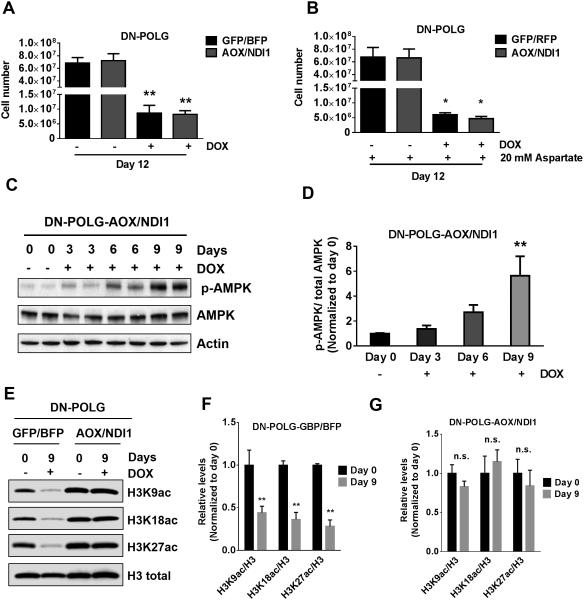
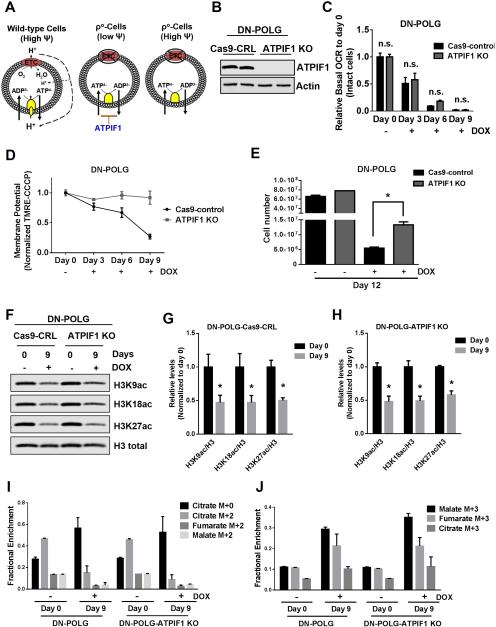
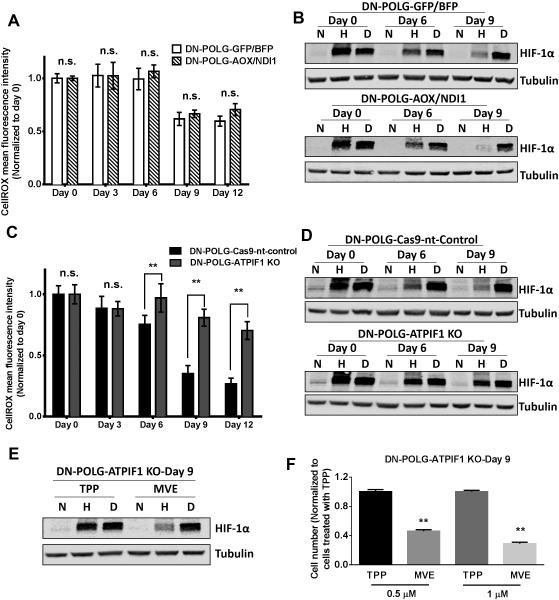
Mitochondrial metabolism is necessary for the maintenance of oxidative TCA cycle function and mitochondrial membrane potential. Previous attempts to decipher whether mitochondria are necessary for biological outcomes have been hampered by genetic and pharmacologic methods that simultaneously disrupt multiple functions linked to mitochondrial metabolism. Here, we report that inducible depletion of mitochondrial DNA (ρ(ο) cells) diminished respiration, oxidative TCA cycle function, and the mitochondrial membrane potential, resulting in diminished cell proliferation, hypoxic activation of HIF-1, and specific histone acetylation marks. Genetic reconstitution only of the oxidative TCA cycle function specifically in these inducible ρ(ο) cells restored metabolites, resulting in re-establishment of histone acetylation. In contrast, genetic reconstitution of the mitochondrial membrane potential restored ROS, which were necessary for hypoxic activation of HIF-1 and cell proliferation. These results indicate that distinct mitochondrial functions associated with respiration are necessary for cell proliferation, epigenetics, and HIF-1 activation.


Figures

Figure 1
Figure 1. Inducible expression of DN-POLG in HEK293 cells diminishes mitochondrial respiration, mitochondrial membrane potential, and cell proliferation
(A) Expression of the ectopic DN-POLG increases in cells treated with doxycycline (10 ng/ml) for 3, 6 and 9 days. Mean ± SEM (n=3). (B) RNA-seq analysis of mitochondrial transcripts in three independent samples of DN-POLG cells untreated or treated with doxycycline (10 ng/ml) for 3, 6 and 9 days. (C) Representative western blots of the expression of COXII (mtDNA encoded) and SDHA (nuclear encoded) in DN-POLG cells untreated or treated with doxycycline (10 ng/ml) for 3, 6 and 9 days from 3 independent experiments. (D) WT and DN-POLG cells were left untreated or treated with doxycycline (10 ng/ml) for 3, 6, 9 for 12 days and viability was measured. Mean ± SEM (n=4). (E-F) Relative mitochondrial oxygen consumption rate (OCR) (E) and mitochondrial membrane potential (F) of intact WT and DN-POLG cells untreated or treated with doxycycline (10 ng/ml) for 3, 6 and 9 days. Mean ± SEM (n=4). (G-H) WT and DN-POLG cells were treated with doxycycline (10 ng/ml) and cell number was assessed at days 9 (G) and 12 (H). Mean ± SEM (n=3). (I) Western blot analysis of p-AMPK, AMPK and Tubulin proteins in DN-POLG cells untreated or treated with doxycycline (10 ng/ml) for 3, 6 and 9 days. (J) WT and DN-POLG untreated or treated with doxycycline (10 ng/ml) for 3, 6 and 9 days were grown in media containing 10 mM glucose or 10 mM galactose for 48h and assessed for cell death. Mean ± SEM (n=3). (K) Glucose oxidation by DN-POLG cells untreated or treated with doxycycline (10 ng/ml) for 3, 6 and 9 days. Mean ± SEM (n=3). * indicates significance p < 0.05. ** indicates significance p <0.01 throughout figure 1. See also Figure S1.
Figure 2
Figure 2. Inducible expression of DN-POLG in HEK293 cells diminishes specific histone H3 acetylation marks
(A-B) Western blot analysis and quantification of histone 3 acetylation and methylation marks in DN-POLG cells untreated or treated with doxycycline (10 ng/ml) for 3, 6 and 9 days. Mean ± SEM (n=3). (C) Acetylation state of H3K9 and H3K27 after treating DN-POLG cells at days 0 and 8 of doxycycline (10 ng/ml) treatment with 5 mM sodium acetate (Na-Ace) or 5 mM sodium butyrate (Na-But) for 24h. (D-E) Quantification of the western blots assessing the acetylation of H3K9 (D) and H2K27 (E) of DN-POLG cells at days 0 and 8 of doxycycline (10 ng/ml) treatment in the presence or absence of 5 mM sodium acetate or sodium butyrate for 24h. Mean ± SEM (n=3). (F) Acetylation state of H3K9 after treating DN-POLG cells with 5 mM sodium acetate (Na-Ace), 50 μM BMS 303141 (ACL inhibitor) and the combination of both treatments for 48h. * indicates significance p < 0.05. ** indicates significance p <0.01 throughout Figure 2. See also Figure S2.
Figure 3
Figure 3. NDI and AOX expression in inducible mtDNA depleted cells restores oxygen consumption but not mitochondrial membrane potential
(A-B) Schematic representation of the electron transport chain in cells expressing the non-mammalian proteins NDI1 and AOX in wild-type (A) and ρ° cells (B). NDI1 can rescue electron transport capacity but not the proton pumping ability of complex I. Thus is can oxidize NADH to NAD+. AOX can accept electrons from ubiquinol and transfer them to oxygen thus bypassing complexes III and IV. (C) mtDNA content in DN-POLG expressing AOX and NDI1 and control cells untreated or treated with doxycycline (10 ng/ml) for 3, 6 and 9 days. Mean ± SEM (n=3). (D) Relative mitochondrial oxygen consumption rate (OCR) of intact DN-POLG-GFP/BFP and DN-POLG-AOX/NDI1 cells untreated or treated with doxycycline (10 ng/ml) for 3, 6 and 9 days. Mean ± SEM (n=3). (E-F) Complex I (E) or Complex II (F) driven oxygen consumption rate of saponin permeabilized Control-DN-POLG-GFP/BFP and DN-POLG-AOX/NDI1 cells untreated or treated with doxycycline (10 ng/ml) for 9 days. Rotenone (1 μM) and antimycin A (1 μM) were used to inhibit complex I and III respectively. SHAM (2 mM) was used to inhibit AOX activity. Mean ± SEM (n=3). (G) Mitochondrial membrane potential assessed by TMRE (50nM) staining and corrected by CCCP (50 μM) of DN-POLG-GFP/BFP and DN-POLG-AOX/NDI1 cells untreated or treated with doxycycline (10 ng/ml) for 3, 6 and 9 days. Mean ± SEM (n=3). (H) DN-POLG-AOX/NDI1 untreated or treated with doxycycline (10 ng/ml) for 3, 6 and 9 days were grown in media containing 10 mM glucose or 10 mM galactose for 48h and subsequently viability was assessed. Mean ± SEM (n=3). * Indicates significance p < 0.05. ** Indicates significance p <0.01 throughout figure 3. See also Figure S3.
Figure 4
Figure 4. NDI1 and AOX expression in inducible mtDNA depleted cells restores the levels of TCA cycle metabolites
(A) The heat map displays the fold of change in metabolites involved in important metabolic pathways in DN-POLG-GFP/BFP and DN-POLG-AOX/NDI1 cells treated with doxycycline (10 ng/ml) for 3, 6 and 9 days relative to untreated cells. A yellow-blue color scale depicts the abundance of the metabolites (Yellow: high, Blue: low). Data represent the average of 4 independent experiments. (B-G) Intracellular citrate (B), fumarate (C), malate (D), α-Ketoglutarate (E), aspartate (F) levels and NAD+/NADH ratio (G) in DN-POLG-GFP/BFP and DN-POLG-AOX/NDI1 cells untreated or treated with doxycycline (10 ng/ml) for 3, 6 and 9 days. Mean ± SEM (n=4). * indicates significance p < .05. ** indicates significance p <0.01 throughout figure 4. See also Figure S4.
Figure 5
Figure 5. Restoration of the oxidative TCA cycle activity in inducible mtDNA depleted cells is sufficient to rescue specific histone 3 acetylation marks but not cell proliferation
(A-B) DN-POLG-GFP/BFP and DN-POLG-AOX/NDI1 cells were grown in the presence or absence of doxycycline (10 ng/ml) for 12 days and cell number was assessed. Cells were supplemented with pyruvate and uridine in the presence (B) or absence (A) of aspartate (20 mM). Mean ± SEM (n=3). (C) Western blot analysis of p-AMPK, AMPK and Tubulin in DN-POLG-AOX/NDI1 untreated or treated with doxycycline (10 ng/ml) for 3, 6 and 9 days. (D) Quantification of the western blots assessing the phosphorylation state of AMPK in DN-POLG-AOX/NDI1. Data is represented relative to total levels of AMPK and the mean value in untreated cells. Mean ± SEM (n=3). (E-G) Western blot analysis and quantification of the acetylation of H3K9, H3K18 and H3K27 and the total expression of H3 in DN-POLG-GFP/BFP and DN-POLG-AOX/NDI1 cells untreated or treated with doxycycline (10 ng/ml) for 9 days. Data was normalized to the mean value in untreated cells. Mean ± SEM (n=3). * indicates significance p < .05. ** indicates significance p <0.01 throughout figure 5. See also Figure S5.
Figure 6
Figure 6. Restoration of the mitochondrial membrane potential in inducible mtDNA depleted cells partially rescues cell proliferation but not specific histone 3 acetylation marks
(A) A functional ETC generates a mitochondrial membrane potential that is used to produce ATP. In ρ° cells, an impaired ETC is not able to generate a mitochondrial membrane potential. ρ° cells are able to sustain mitochondrial membrane potential through the electrogenic exchange of ATP4- for ADP3- by the adenine nucleotide carrier. This mechanism relies on the F1-ATPase activity of an incomplete F0F1-ATPase that is loosely associated with the membrane. However, the ATPIF1 protein, an inhibitor of the F1-ATPase prevents the maintenance of the mitochondrial membrane potential. The loss of ATPIF1 increases the F1-ATPase activity to sustain the mitochondrial membrane potential. (B) Western blot analysis of ATPIF1 protein levels in DN-POLG-Cas9-control cells and DN-POLG-ATPIF1 KO cells. (C-D) Relative mitochondrial oxygen consumption rate (OCR) (C) and mitochondrial membrane potential (D) of intact DN-POLG-Cas9-control cells and DN-POLG-ATPIF1 KO cells untreated or treated with doxycycline (10 ng/ml) for 3, 6 and 9 day. Mean ± SEM (n=3). (E) DN-POLG-Cas9-control cells and DN-POLG-ATPIF1 KO cells were grown in the presence or absence of doxycycline (10 ng/ml) for 12 days and assessed for cell number. Mean ± SEM (n=3). (F-H) Western blot analysis and quantification of the acetylation of H3K9, H3K18 and H3K27 and the total expression of H3 in DN-POLG-Cas9-nt-control and DN-POLG-ATPIF1 KO cells untreated or treated with doxycycline (10 ng/ml) for 9 days. Data was normalized to the mean value in untreated cells. Mean ± SEM (n=3). (I-J) DN-POLG and DN-POLG-ATPIF1 KO cells untreated or treated with doxycycline (10 ng/ml) for 9 days were labeled for six hours with [U-13C]glucose and subsequently metabolite pools were examined. m+0 pools represent unlabeled fractions. m+2 and m+3 pools results from glucose flow through pyruvate dehydrogenase and pyruvate carboxylase, respectively. Mean ± SEM (n=3). * Indicates significance p < 0.05 throughout figure 6. See also Figure S6.
Figure 7
Figure 7. Mitochondrial membrane potential dependent ROS is essential for hypoxic stabilization of HIF-1α protein and cell proliferation
(A) ROS levels were measured in DN-POLG-GFP/BFP and DN-POLG-AOX/NDI1 cells untreated or treated with doxycycline (10 ng/ml) for 3, 6, 9 and 12 days. Mean ± SEM (n=3). (B) Representative western blot from 3 independent experiments of DN-POLG-GFP/BFP and DN-POLG-AOX/NDI1 cells untreated or treated with doxycycline (10 ng/ml) for 6 and 9 days and placed in normoxia (21% O2), hypoxia (1.5% O2) or treated with 1 mM DMOG (21% O2) for 4 hours. Hypoxic induction of HIF-1α was analyzed by western blot. (C) ROS levels were measured in DN-POLG-Cas9-nt-control and DN-POLG-ATPIF1 KO cells untreated or treated with doxycycline (10 ng/ml) for 3, 6, 9 and 12 days. Mean ± SEM (n=3). (D) Representative western blot from 3 independent experiments of DN-POLG-Cas9-nt-control and DN-POLG-ATPIF1 KO cells untreated or treated with doxycycline (10 ng/ml) for 6 and 9 days and placed in normoxia (21% O2), hypoxia (1.5% O2) or treated with 1 mM DMOG (21% O2) for 4 hours. Hypoxic stabilization of HIF-1α was analyzed by western blot. (E) Representative western blot from 3 independent experiments of DN-POLG-ATPIF1 KO cells treated with doxycycline (10 ng/ml) for 9 days pretreated with TPP or MVE for 2 hours and subsequently placed in normoxia (21% O2), hypoxia (1.5% O2) or treated with 1 mM DMOG (21% O2) for 4 hours. Hypoxic stabilization of HIF-1α was analyzed by western blot. (F) DN-POLG-ATPIF1 KO cells treated with doxycycline (10 ng/ml) for 9 days were exposed to 0.5 μM or 1 μM TPP or MVE for the last 3 days of doxycycline treatment and cell number was assessed. Mean ± SEM (n=3). ** Indicates significance p <0.01 throughout figure 7. See also Figure S7.

Similar articles

Cited by

References

    1. Appleby RD, Porteous WK, Hughes G, James AM, Shannon D, Wei YH, Murphy MP. Quantitation and origin of the mitochondrial membrane potential in human cells lacking mitochondrial DNA. European journal of biochemistry / FEBS. 1999;262:108–116. - PubMed
    1. Birsoy K, Wang T, Chen WW, Freinkman E, Abu-Remaileh M, Sabatini DM. An Essential Role of the Mitochondrial Electron Transport Chain in Cell Proliferation Is to Enable Aspartate Synthesis. Cell. 2015;162:540–551. - PMC - PubMed
    1. Boroughs LK, DeBerardinis RJ. Metabolic pathways promoting cancer cell survival and growth. Nature cell biology. 2015;17:351–359. - PMC - PubMed
    1. Buchet K, Godinot C. Functional F1-ATPase essential in maintaining growth and membrane potential of human mitochondrial DNA-depleted rho degrees cells. The Journal of biological chemistry. 1998;273:22983–22989. - PubMed
    1. Cannino G, El-Khoury R, Pirinen M, Hutz B, Rustin P, Jacobs HT, Dufour E. Glucose modulates respiratory complex I activity in response to acute mitochondrial dysfunction. The Journal of biological chemistry. 2012;287:38729–38740. - PMC - PubMed

Publication types

MeSH terms

LinkOut - more resources