

Microtubule-Dependent Mitochondria Alignment Regulates Calcium Release in Response to Nanomechanical Stimulus in Heart Myocytes
- PMID: 26725114
- PMCID: PMC4983655
- DOI: 10.1016/j.celrep.2015.12.014
Microtubule-Dependent Mitochondria Alignment Regulates Calcium Release in Response to Nanomechanical Stimulus in Heart Myocytes
Abstract
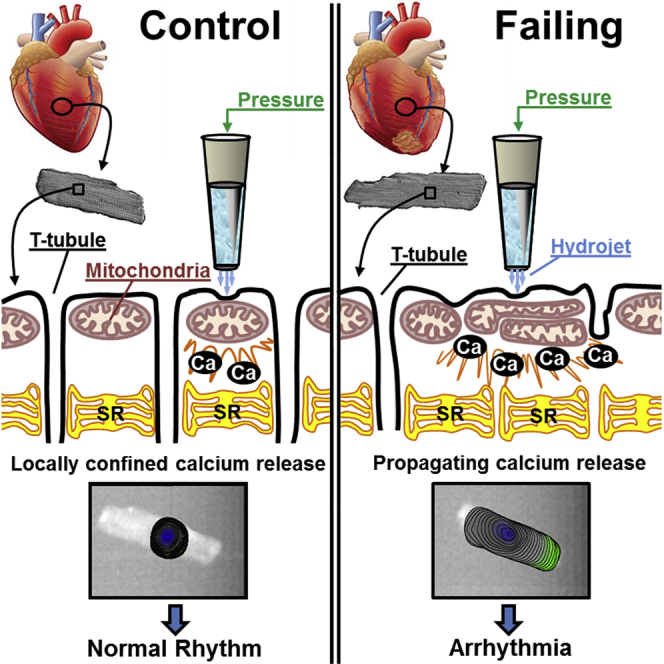
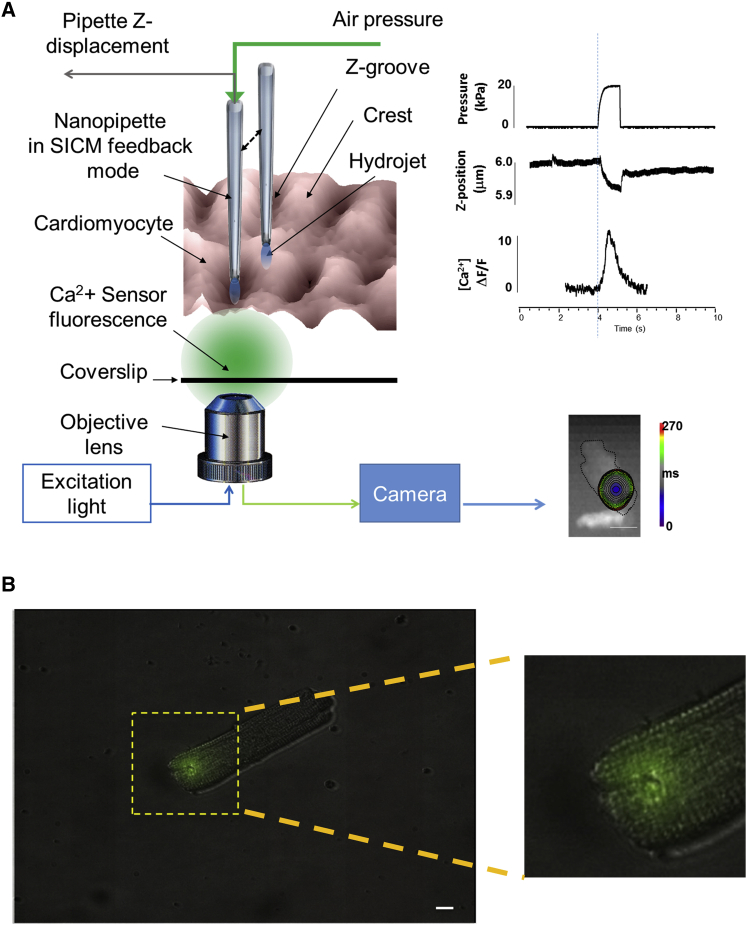
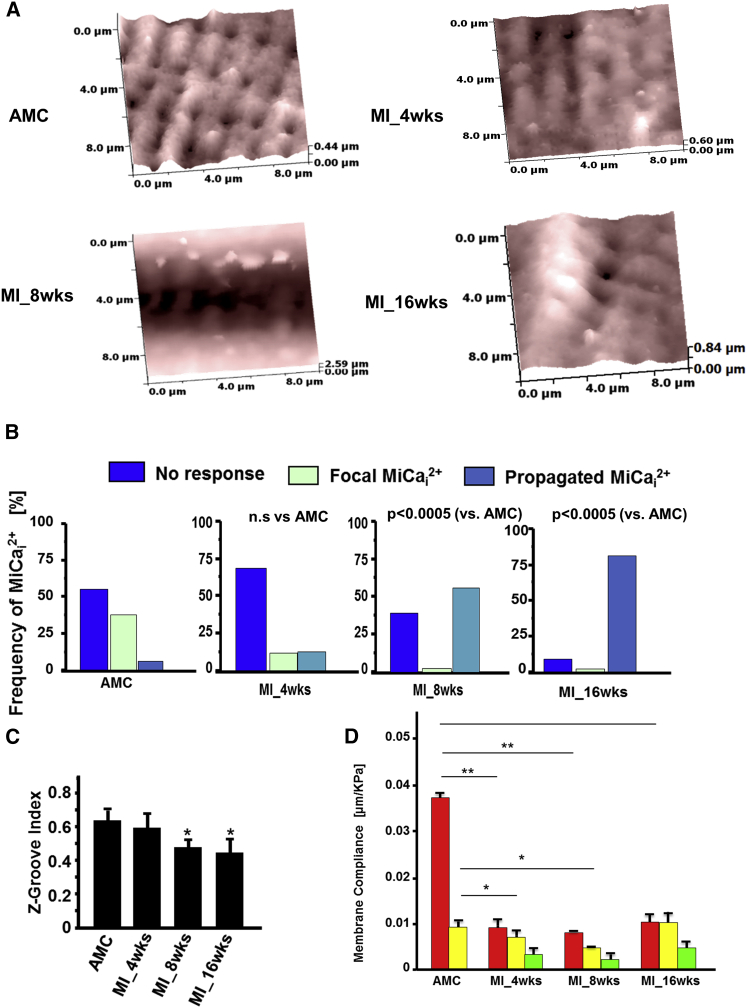
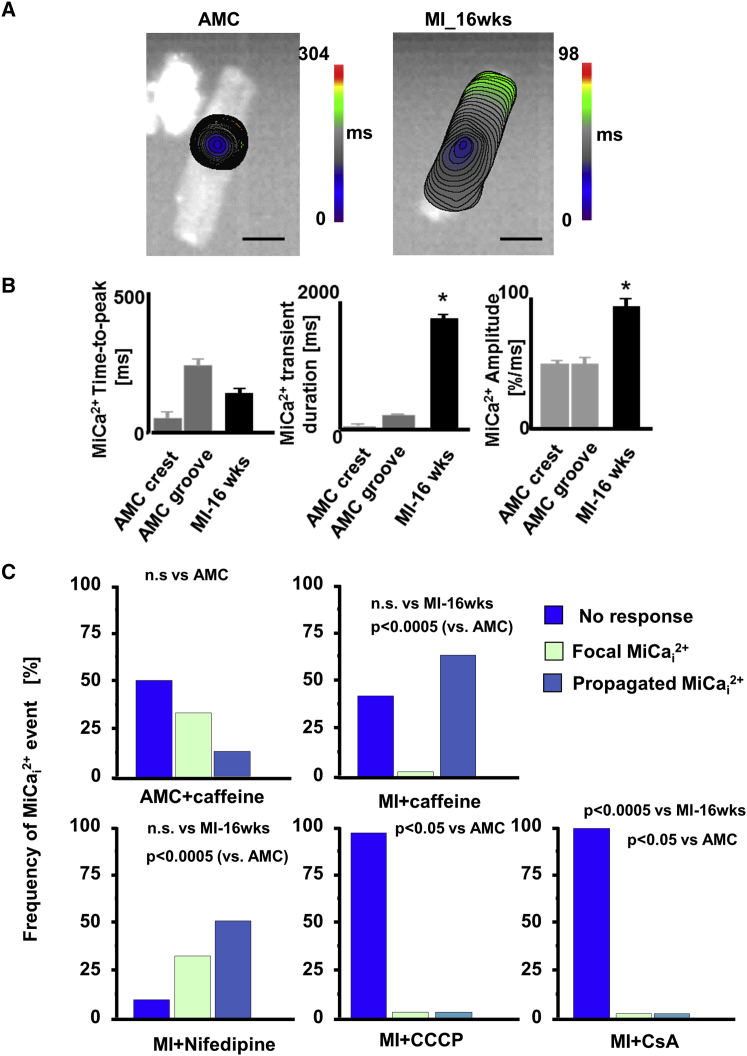
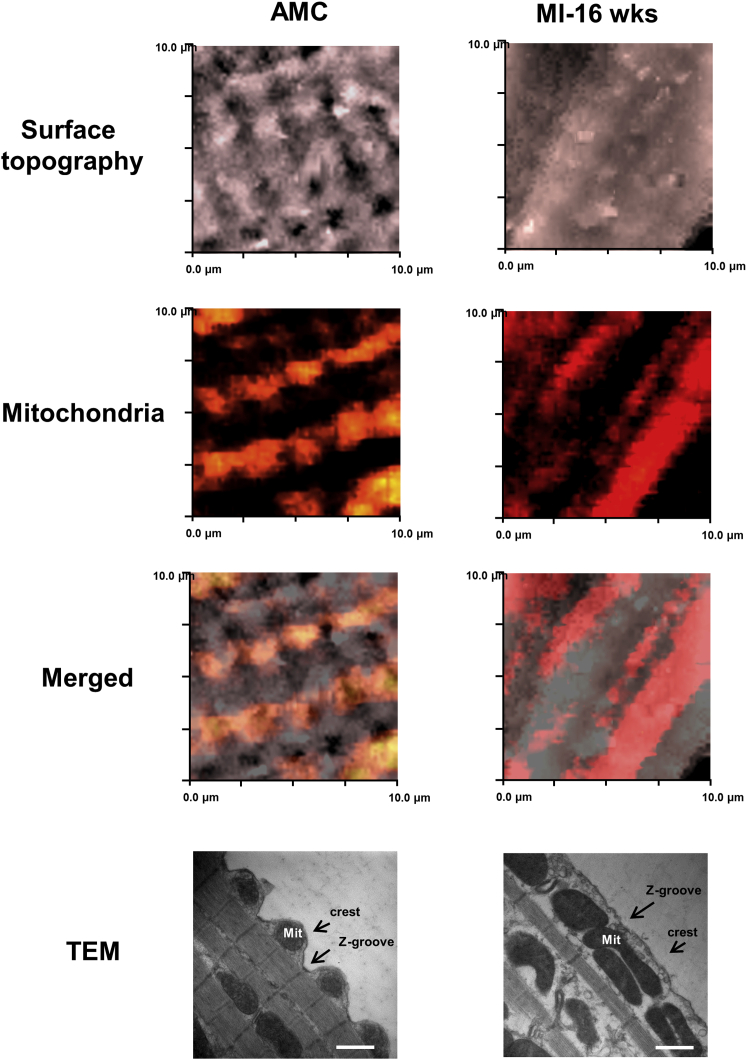
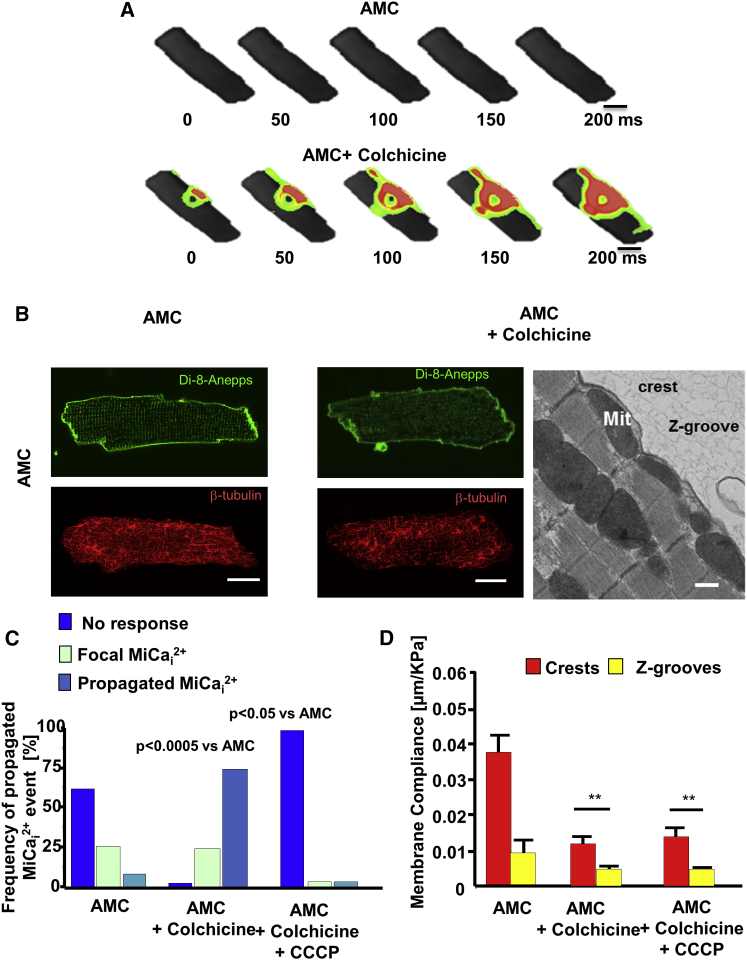
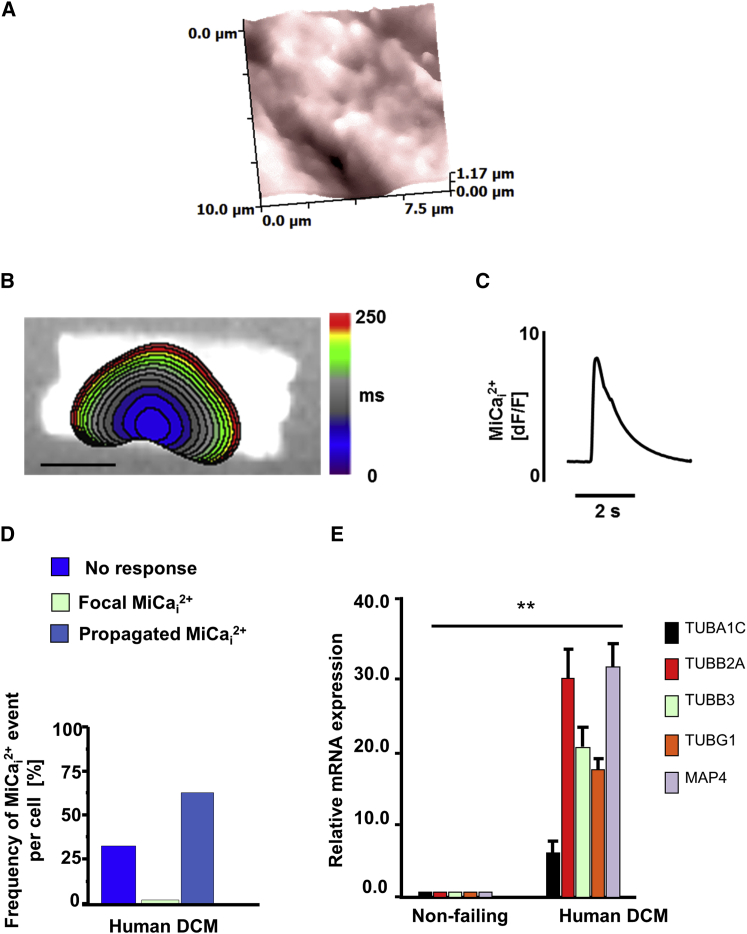
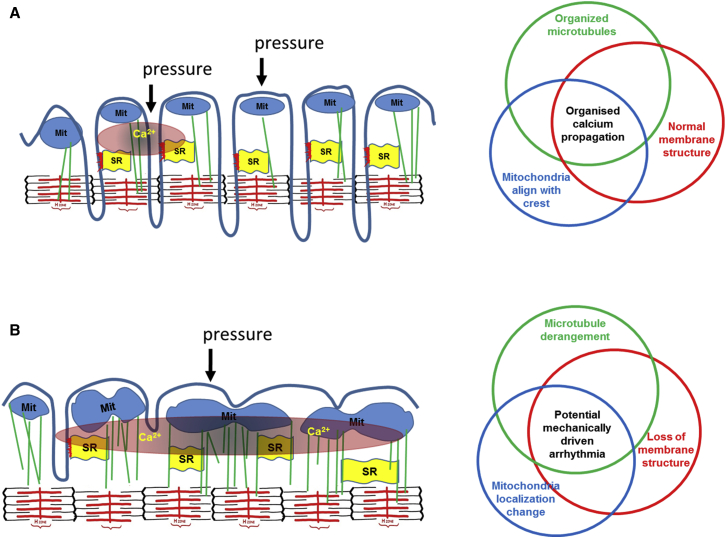
Arrhythmogenesis during heart failure is a major clinical problem. Regional electrical gradients produce arrhythmias, and cellular ionic transmembrane gradients are its originators. We investigated whether the nanoscale mechanosensitive properties of cardiomyocytes from failing hearts have a bearing upon the initiation of abnormal electrical activity. Hydrojets through a nanopipette indent specific locations on the sarcolemma and initiate intracellular calcium release in both healthy and heart failure cardiomyocytes, as well as in human failing cardiomyocytes. In healthy cells, calcium is locally confined, whereas in failing cardiomyocytes, calcium propagates. Heart failure progressively stiffens the membrane and displaces sub-sarcolemmal mitochondria. Colchicine in healthy cells mimics the failing condition by stiffening the cells, disrupting microtubules, shifting mitochondria, and causing calcium release. Uncoupling the mitochondrial proton gradient abolished calcium initiation in both failing and colchicine-treated cells. We propose the disruption of microtubule-dependent mitochondrial mechanosensor microdomains as a mechanism for abnormal calcium release in failing heart.
Copyright © 2016 The Authors. Published by Elsevier Inc. All rights reserved.
Figures
Similar articles
-
Altered Mitochondrial Metabolism and Mechanosensation in the Failing Heart: Focus on Intracellular Calcium Signaling.Int J Mol Sci. 2017 Jul 10;18(7):1487. doi: 10.3390/ijms18071487. Int J Mol Sci. 2017. PMID: 28698526 Free PMC article. Review.
-
Mitochondrial Mechanosensor Microdomains in Cardiovascular Disorders.Adv Exp Med Biol. 2017;982:247-264. doi: 10.1007/978-3-319-55330-6_13. Adv Exp Med Biol. 2017. PMID: 28551791 Review.
-
Microtubule-mediated defects in junctophilin-2 trafficking contribute to myocyte transverse-tubule remodeling and Ca2+ handling dysfunction in heart failure.Circulation. 2014 Apr 29;129(17):1742-50. doi: 10.1161/CIRCULATIONAHA.113.008452. Epub 2014 Feb 11. Circulation. 2014. PMID: 24519927 Free PMC article.
-
Binding of FUN14 Domain Containing 1 With Inositol 1,4,5-Trisphosphate Receptor in Mitochondria-Associated Endoplasmic Reticulum Membranes Maintains Mitochondrial Dynamics and Function in Hearts in Vivo.Circulation. 2017 Dec 5;136(23):2248-2266. doi: 10.1161/CIRCULATIONAHA.117.030235. Epub 2017 Sep 23. Circulation. 2017. PMID: 28942427 Free PMC article.
-
Role of sarcoplasmic reticulum in mitochondrial permeability transition and cardiomyocyte death during reperfusion.Am J Physiol Heart Circ Physiol. 2009 Oct;297(4):H1281-9. doi: 10.1152/ajpheart.00435.2009. Epub 2009 Aug 14. Am J Physiol Heart Circ Physiol. 2009. PMID: 19684187
Cited by
-
Suppression of detyrosinated microtubules improves cardiomyocyte function in human heart failure.Nat Med. 2018 Aug;24(8):1225-1233. doi: 10.1038/s41591-018-0046-2. Epub 2018 Jun 11. Nat Med. 2018. PMID: 29892068 Free PMC article.
-
Altered Mitochondrial Metabolism and Mechanosensation in the Failing Heart: Focus on Intracellular Calcium Signaling.Int J Mol Sci. 2017 Jul 10;18(7):1487. doi: 10.3390/ijms18071487. Int J Mol Sci. 2017. PMID: 28698526 Free PMC article. Review.
-
Mitochondrial-cytoskeletal interactions: dynamic associations that facilitate network function and remodeling.Curr Opin Physiol. 2018 Jun;3:94-100. doi: 10.1016/j.cophys.2018.03.003. Epub 2018 Apr 7. Curr Opin Physiol. 2018. PMID: 30555978 Free PMC article.
-
Supporting the heart: Functions of the cardiomyocyte's non-sarcomeric cytoskeleton.J Mol Cell Cardiol. 2019 Jun;131:187-196. doi: 10.1016/j.yjmcc.2019.04.002. Epub 2019 Apr 9. J Mol Cell Cardiol. 2019. PMID: 30978342 Free PMC article. Review.
-
Growth hormone-releasing hormone attenuates cardiac hypertrophy and improves heart function in pressure overload-induced heart failure.Proc Natl Acad Sci U S A. 2017 Nov 7;114(45):12033-12038. doi: 10.1073/pnas.1712612114. Epub 2017 Oct 25. Proc Natl Acad Sci U S A. 2017. PMID: 29078377 Free PMC article.
References
-
- Adamson P.B., Barr R.C., Callans D.J., Chen P.-S., Lathrop D.A., Makielski J.C., Nerbonne J.M., Nuss H.B., Olgin J.E., Przywara D.A. The perplexing complexity of cardiac arrhythmias: beyond electrical remodeling. Heart Rhythm. 2005;2:650–659. - PubMed
-
- Belmonte S., Morad M. Shear fluid-induced Ca2+ release and the role of mitochondria in rat cardiac myocytes. Ann. N Y Acad. Sci. 2008;1123:58–63. - PubMed
-
- Bloch Thomsen P.E., Jons C., Raatikainen M.J., Moerch Joergensen R., Hartikainen J., Virtanen V., Boland J., Anttonen O., Gang U.J., Hoest N., Cardiac Arrhythmias and Risk Stratification After Acute Myocardial Infarction (CARISMA) Study Group Long-term recording of cardiac arrhythmias with an implantable cardiac monitor in patients with reduced ejection fraction after acute myocardial infarction: the Cardiac Arrhythmias and Risk Stratification After Acute Myocardial Infarction (CARISMA) study. Circulation. 2010;122:1258–1264. - PubMed
-
- Borbély A., van der Velden J., Papp Z., Bronzwaer J.G., Edes I., Stienen G.J., Paulus W.J. Cardiomyocyte stiffness in diastolic heart failure. Circulation. 2005;111:774–781. - PubMed
Publication types
MeSH terms
Substances
Grants and funding
LinkOut - more resources
Full Text Sources
Other Literature Sources
Medical
