. 2016 Jan 11;29(1):75-89.
doi: 10.1016/j.ccell.2015.11.011. Epub 2015 Dec 24.

Long-Term ERK Inhibition in KRAS-Mutant Pancreatic Cancer Is Associated with MYC Degradation and Senescence-like Growth Suppression

Affiliations

Long-Term ERK Inhibition in KRAS-Mutant Pancreatic Cancer Is Associated with MYC Degradation and Senescence-like Growth Suppression

Tikvah K Hayes et al. Cancer Cell. .

Abstract

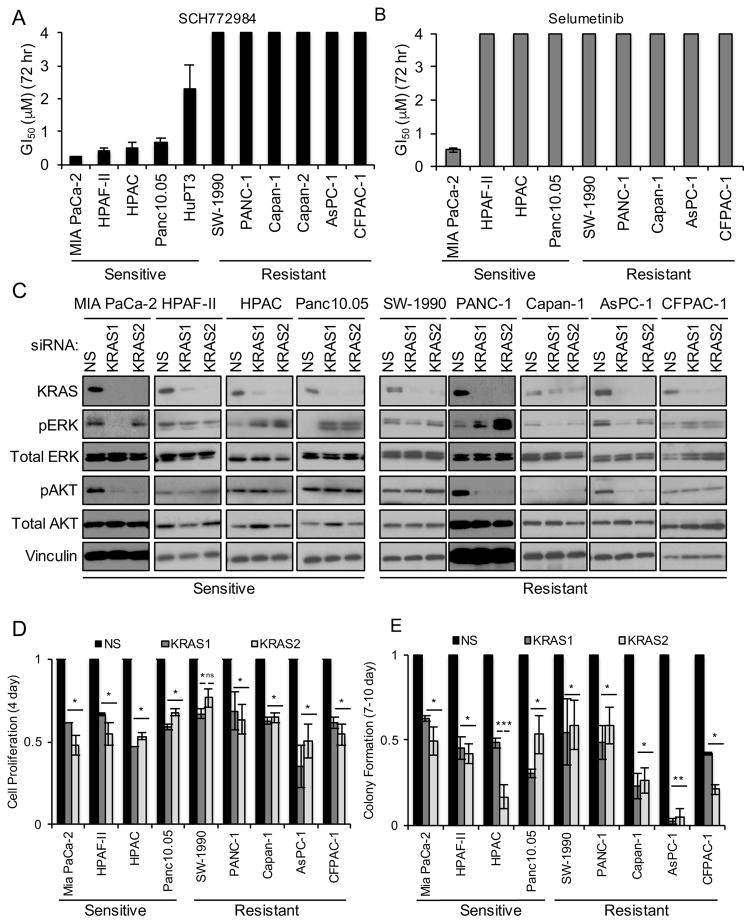
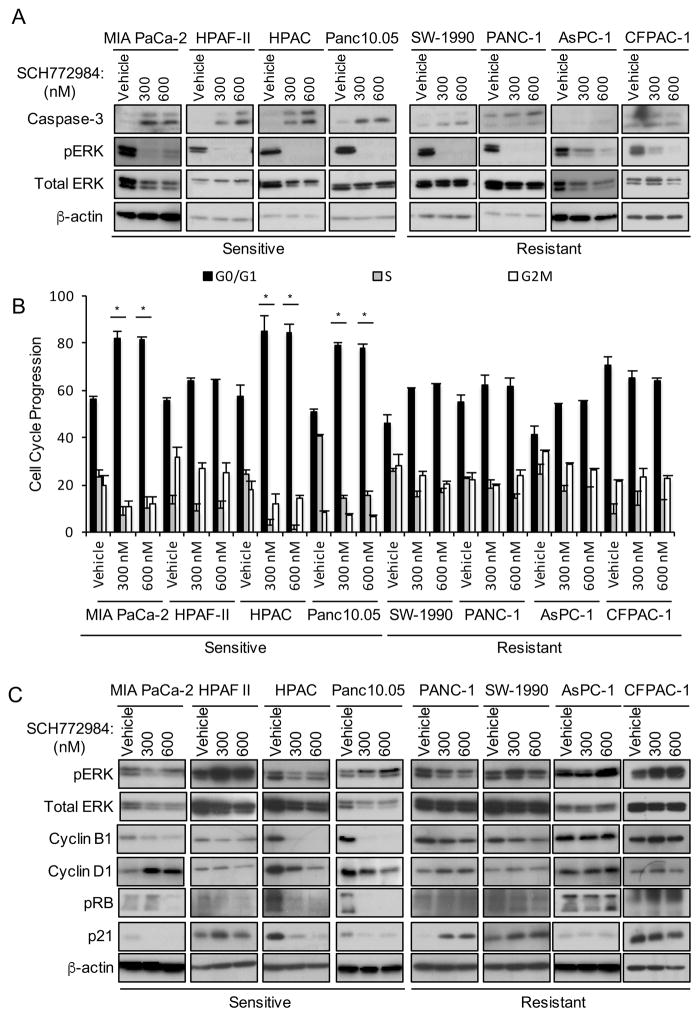
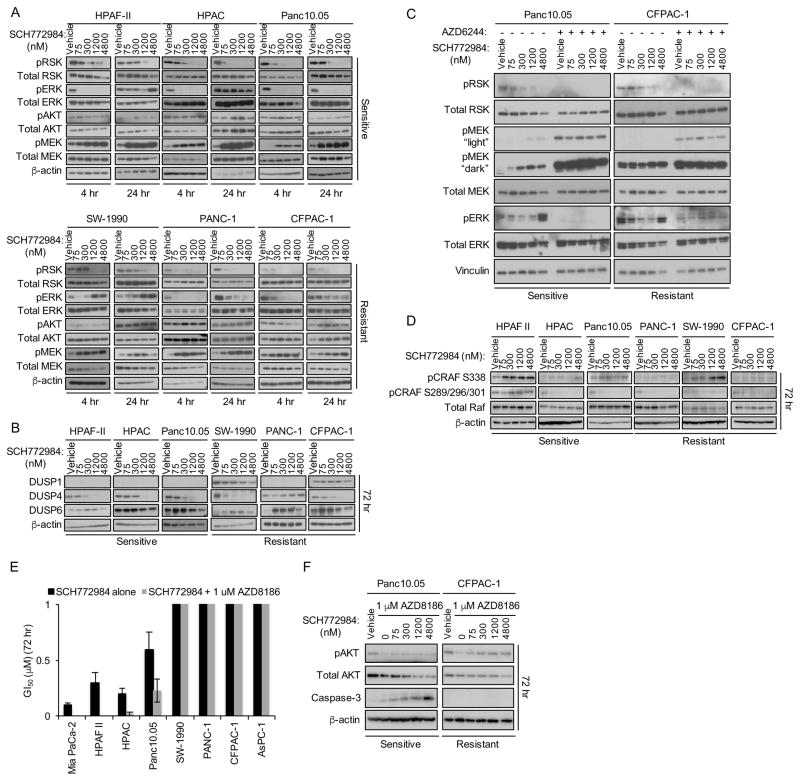
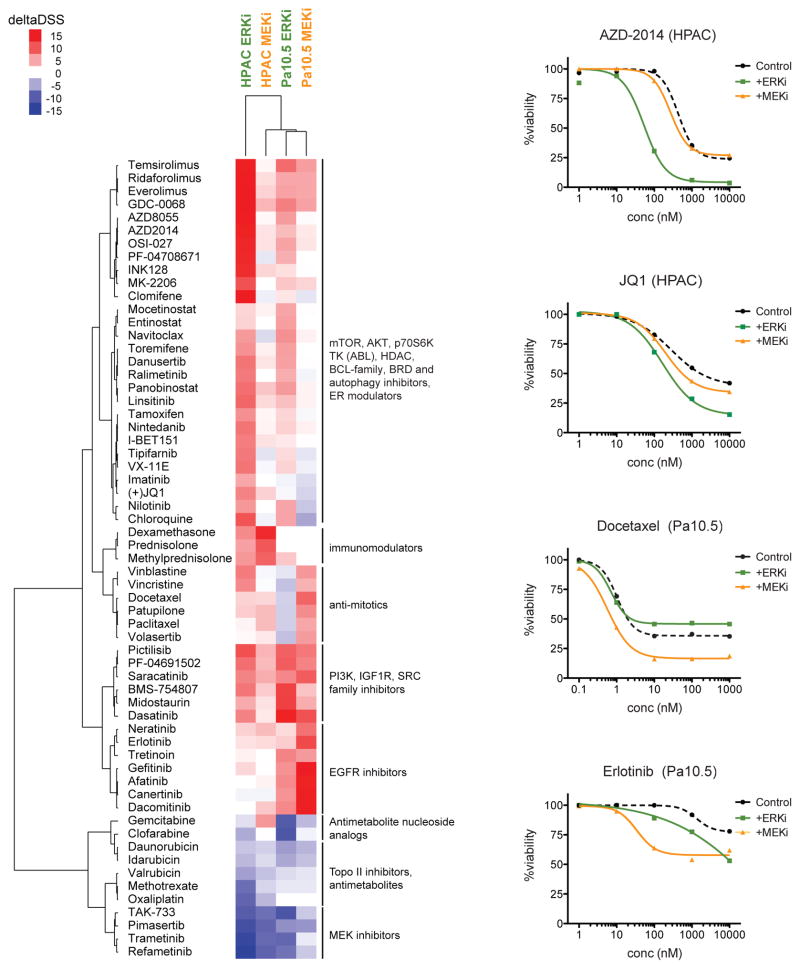
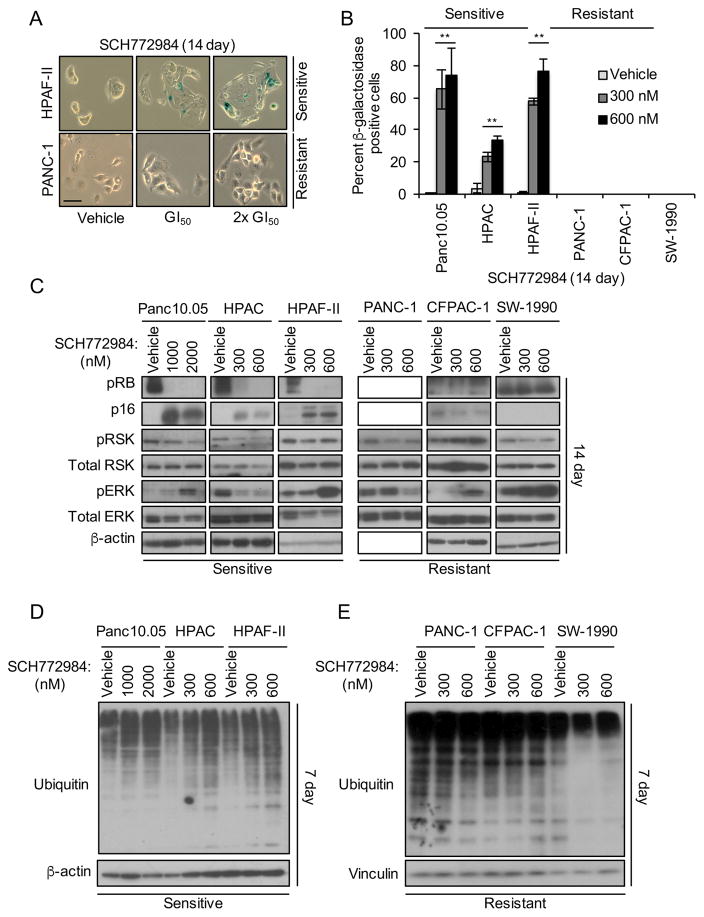
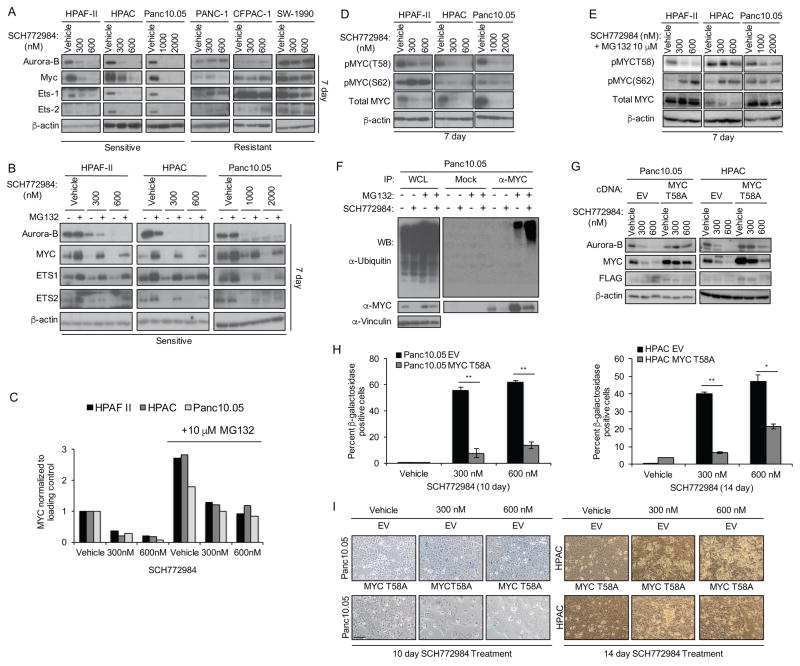
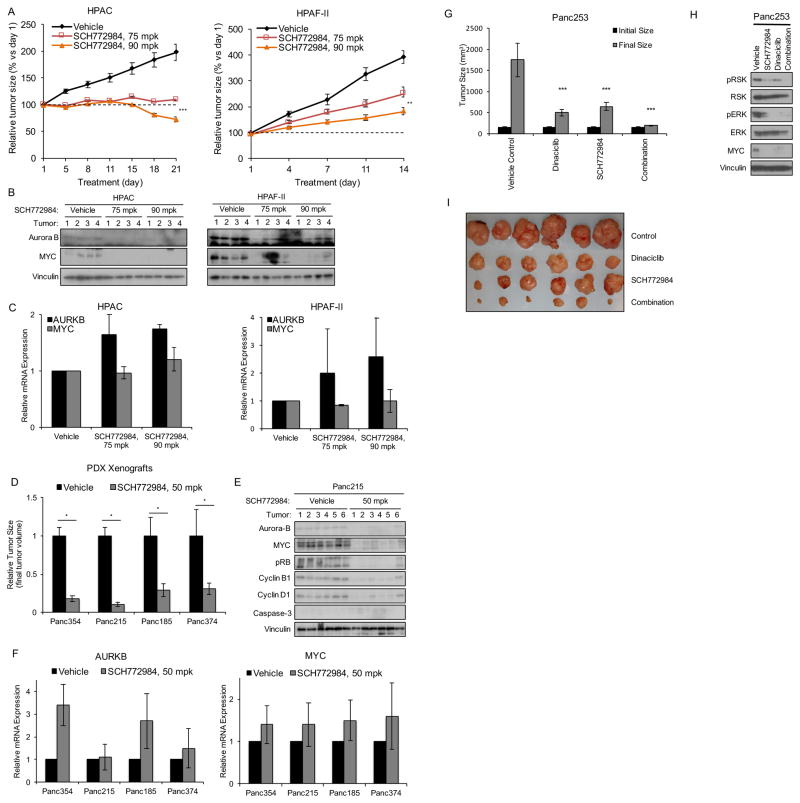
Induction of compensatory mechanisms and ERK reactivation has limited the effectiveness of Raf and MEK inhibitors in RAS-mutant cancers. We determined that direct pharmacologic inhibition of ERK suppressed the growth of a subset of KRAS-mutant pancreatic cancer cell lines and that concurrent phosphatidylinositol 3-kinase (PI3K) inhibition caused synergistic cell death. Additional combinations that enhanced ERK inhibitor action were also identified. Unexpectedly, long-term treatment of sensitive cell lines caused senescence, mediated in part by MYC degradation and p16 reactivation. Enhanced basal PI3K-AKT-mTOR signaling was associated with de novo resistance to ERK inhibitor, as were other protein kinases identified by kinome-wide siRNA screening and a genetic gain-of-function screen. Our findings reveal distinct consequences of inhibiting this kinase cascade at the level of ERK.


Figures

Figure 1
Figure 1. PDAC Cell Line Sensitivity to the ERK-Selective Inhibitor SCH772984 Is Not Associated with KRAS Dependency
(A) KRAS-mutant PDAC cell lines were maintained on plastic in growth medium with DMSO vehicle or SCH772984 (3.9 nM – 4 μM). Proliferation was monitored by MTT assay to assess growth inhibition after 72 hr treatment. GI50 values were determined using CalcuSyn. Data are representative of three independent experiments. Bars indicate standard deviation from triplicate samples for each cell line. (B) SCH772984-sensitive and -resistant PDAC cell lines were maintained on plastic in growth medium with vehicle or the MEK inhibitor selumetinib (3.9 nM – 4 μM). MTT assays were performed and GI50 values were determined as in (A). (C) Cells were transfected with scrambled (NS) or one of two individual siRNAs targeting KRAS (designated KRAS1 or KRAS2) for 48 hr, followed by western blot for total K-Ras4B, ERK1/2 (ERK), AKT1–3 (AKT) and for vinculin to verify equivalent loading of total protein. Phospho-specific antibodies were used to monitor phosphorylation and activation of ERK (T202/Y204; pERK) and AKT (S473; pAKT). Data are representative of two independent experiments. (D) Cells transfected with NS or KRAS siRNAs were monitored for proliferation on plastic at 6 days post-transfection by MTT assay. Error bars represent the standard error of the mean. Data are representative of three independent experiments. Asterisks represent statistical significance using one-way ANOVA analysis, where * = p < 0.05, ** = p < 0.001, and ns = not significant. (E) Cells transfected with NS or KRAS siRNAs were plated at low density and clonogenic growth was monitored at 9–12 days post-transfection. Error bars represent standard error of the mean. Data are representative of three independent experiments. Asterisks represent statistical significance using one-way ANOVA analysis, where * = p < 0.05, ** = p < 0.001, and ns = not significant. See also Figure S1.
Figure 2
Figure 2. Short-term SCH772984 Treatment Induces Apoptosis and Altered Cell Cycle Progression
(A) SCH772984-sensitive or -resistant cell lines were treated for 72 hr with DMSO vehicle or SCH772984. Non-adherent cells were collected and monitored for apoptosis by western blot for cleaved caspase-3. Data are representative of three independent experiments. (B) Cells treated as above were stained with propidium iodide followed by flow cytometry. Error bars represent standard error of the mean. Asterisks represent statistical significance using one-way ANOVA analysis, where * = p < 0.05. (C) Cells treated as above were collected for western blot for total cyclin B1, cyclin D1 and p21, and of phosphorylated, inactivated RB (S807/811; pRB). Western blot for pERK was done to verify SCH772984 inhibition; β-actin was the loading control. See also Figure S2.
Figure 3
Figure 3. SCH772984 Sensitivity Is Associated with Treatment-Induced AKT Phosphorylation
(A) Cells were treated for 4 or 24 hr with DMSO vehicle or SCH772984, then evaluated by western blot with phospho-specific antibodies for RSK (T395/S363; pRSK), MEK1/2 (S217/221; pMEK), AKT (S473; pAKT), and ERK (T202/Y204; pERK). Total RSK, ERK, AKT, MEK and β-actin were also analyzed. Data are representative of three independent experiments. (B) Cells were treated as in (A) for 72 hr and evaluated by western blot for DUSP1, DUSP4, DUSP6 and β-actin. (C) SCH772984-sensitive (Panc10.05) and -resistant (CFPAC-1) cell lines were treated concurrently with selumetinib (5 μM) and either vehicle or the indicated concentrations of SCH772984. Phosphorylated and total RSK, MEK, ERK and vinculin were evaluated by western blot. (D) Cells were treated as above and collected for western blot for pCRAF (S338), pCRAF (S289/296/301), total CRAF and β-actin. (E) Cells were maintained in growth medium with vehicle or SCH772984 (3.9 nM – 4 μM), with or without the PI3K inhibitor AZD8186 (1 μM). MTT was used to assess growth inhibition after 72 hr. Data are representative of three independent experiments. Bars indicate standard deviation from triplicate samples for each cell line. (F) Cells were co-treated with SCH772984 and AZD8186. Western blots were performed for pAKT (S473) and total AKT, caspase-3 and β-actin. See also Figure S3.
Figure 4
Figure 4. Distinct Patterns of Drug Synergies in ERK versus MEK Inhibitor Combinations
HPAC and Panc10.05 cells were exposed to dose-dependent drug sensitivity testing (DSRT) against 309 oncology-related compounds in the presence or absence of the ERK inhibitor SCH772984 (2 μM) or the MEK inhibitor AZD6244/selumetinib (1 μM). Cell viability was measured using CellTiter-Glo and drug responses were calculated as drug sensitivity scores (DSS). Plotted in the heatmap are the deltaDSS values (DSS in the presence of ERK/MEK inhibitor – DSS in the absence of overlaid inhibitor) for each condition, where red signifies potential synergies and blue indicates negative interactions between the two drugs. Drugs where the deltaDSS remained between −5 and 5 for all four conditions were excluded from the heatmap.
Figure 5
Figure 5. Long-term SCH772984 Treatment Induces Markers of Senescence and Ubiquitination in Sensitive but Not Resistant Cell Lines
(A and B) Cells were treated with SCH772984 at GI50 or at 2x GI50 concentrations for 14 days and stained for β-galactosidase. Representative images (scale bar, 50 μm) are shown in the left panel, with quantitation in the right panel. Error bars represent standard error of the mean. Data are representative of three independent experiments. Asterisks represent statistical significance using one-way ANOVA analysis, where * = p < 0.05 and ** = p < 0.001. (C) Cells were treated with SCH772984 for 14 days on plastic, followed by western blot for pRB, pRSK and pERK, and for total p16, RSK and ERK; β-actin was a loading control. (D and E) Cells were treated with vehicle or SCH772984 for 7 days, and then immunoblotted for ubiquitin or for β-actin. See also Figure S4.
Figure 6
Figure 6. Induction of Senescence Is Dependent on Proteasomal Degradation of cMYC
(A) Cells were treated with vehicle or SCH772984 for 7 days, then immunoblotted for Aurora B, MYC, ETS1 or ETS2, and β-actin. Data are representative of three independent experiments. (B) Sensitive cell lines were treated with vehicle or the indicated concentrations of SCH772984 for 7 days, and then co-treated with either vehicle (−) or MG132 (10 μM, +) for an additional 8 hr, followed by western blots for Aurora-B, MYC, ETS-1, and ETS-2. β-actin is the loading control. (C) Densitometry analysis of MYC protein levels from (B). (D) Sensitive cell lines were treated with vehicle or SCH772984 for 7 days, and then immunoblotted with phospho-specific antibodies for Myc residues T58 or S62 (pMYC), or for total MYC and β-actin. (E) Cells were treated as in (C) and then MG132 (10 μM) was added for 8 hr. (F) Sensitive Panc10.05 cells maintained on plastic were treated with either vehicle (−) or SCH772984 (1,000 nM, +) for 7 days, then co-treated with either vehicle (−) or MG132 (10 μM, +) for an additional 8 hr. Whole cell lysates (WCL) were then subjected to control normal serum (mock) or to anti-MYC immunoprecipitation (IP), resolved by SDS-PAGE and then immunoblotted for ubiquitin or for MYC, and for vinculin to verify equivalent loading of total cellular protein. (G) Sensitive Panc10.05 and HPAC cells stably infected with either the empty pMSCV retrovirus vector (EV) or pMSCV encoding a FLAG epitope-tagged ubiquitination-deficient MYC T58A mutant were treated with vehicle or SCH772984 for 10 or 14 days. Western blot was performed to determine levels of Aurora-B, MYC, and FLAG. Asterisk denotes band of interest. β-actin is the loading control. (H) Panc10.05 and HPAC cells expressing either EV or MYC T58A were treated with SCH772984 for 10 or 14 days, then stained for β-galactosidase. The percentage of β-galactosidase-positive cells was determined. Error bars represent standard error of the mean. Asterisks represent statistical significance using an unpaired t-test, where ** = p < 0.01 and * = p < 0.05. (I) Images (scale bar, 100 μm) of β-galactocidase-positive cell staining in Panc10.05 and HPAC cells, stably infected with the empty pMSCV puro retrovirus vector (EV) or pMSCV encoding MYC T58A, after 10 or 14 days of SCH772984 treatment. See also Figure S5.
Figure 7
Figure 7. SCH772984 Inhibition of Tumor Growth Is Associated with Suppression of Myc and Aurora B Abundance
(A) HPAC or HPAF-II cells were injected subcutaneously into the flanks of nude mice. Tumors were allowed to reach 300–450 mm3, then mice were treated i.p. daily with vehicle (20% hydroxypropyl beta-cyclodextrin or HPBCD) or with SCH772984 at 75 or 90 mpk for 21 or 14 days, respectively. Error bars represent standard error of the mean (n=10). (B) Tumors from mice treated as in (A) were harvested after 21 days and lysates were analyzed by blotting for Aurora B and MYC protein. (C) Tumors from mice treated as in (A) were harvested after 21 days and analyzed by RT-PCR for AURKB and MYC mRNA. (D) KRAS-mutant pancreatic cancer patient-derived xenograft (PDX) cell lines (Panc354, Panc215, Panc185, and Panc374) were injected subcutaneously into the flanks of nude mice. Tumors were allowed to reach 200 mm3, then mice were treated with vehicle (10% HPBCD) or SCH772984 at 50 mpk b.i.d. for 14 days. Error bars represent standard error of the mean (n=10). Asterisks represent statistical significance using two-way ANOVA, where * = p < 0.05. (E) Panc215 xenograft tumors treated as in (B) were harvested after 14 days and lysates were analyzed by blotting for Aurora B, MYC, pRB, cyclin B1, cyclin D1, caspase-3 and vinculin. (F) Panc215 xenograft tumors treated as in (C) were harvested after 14 days and lysates were analyzed by RT-PCR for AURKB and MYC mRNA. (G) Panc253 tumors were orthotopically implanted in nude mice and allowed to grow to a mean size of 200 mm3, as measured by ultrasound. Mice were treated i.p. with SCH772984 at 25 mpk three times per week or with dinaciclib at 20 mpk twice weekly. After 25 days, tumors were harvested and weighed. All data represent mean ± SE (n= 7); ***, p < 0.001, each arm versus vehicle control. (H) Tumors harvested from mice treated as in (B) were analyzed by western blot for phospho-RSK and -ERK, and total RSK, ERK, and MYC. Vinculin is a loading control. (I) Images of Panc253 tumors treated as described in (G). See also Figure S6.
Figure 8
Figure 8. Identification of Protein Kinases That Regulate Resistance of PDAC Cell Lines to SCH772984
Pathway analysis based on Ingenuity Pathway Knowledge Base. The highest scoring networks (Post-translational Modification, Cell Morphology, Cellular Assembly and Organization; score 29, p-values < 0.05) were obtained from the proteins identified in our kinome-wide siRNA SCH772984 resistance screen. A black solid line represents a direct relationship between two nodes. A dotted line represents an indirect interaction between two nodes. Shaded nodes are the genes identified in our screen. See also Figure S7.

References

    1. Alagesan B, Contino G, Guimaraes AR, Corcoran RB, Deshpande V, Wojtkiewicz GR, Hezel AF, Wong KK, Loda M, Weissleder R, et al. Combined MEK and PI3K Inhibition in a Mouse Model of Pancreatic Cancer. Clin Cancer Res. 2015;21:396–404. - PMC - PubMed
    1. Bardeesy N, Aguirre AJ, Chu GC, Cheng KH, Lopez LV, Hezel AF, Feng B, Brennan C, Weissleder R, Mahmood U, et al. Both p16(Ink4a) and the p19(Arf)-p53 pathway constrain progression of pancreatic adenocarcinoma in the mouse. Proc Natl Acad Sci USA. 2006;103:5947–5952. - PMC - PubMed
    1. Bonet C, Giuliano S, Ohanna M, Bille K, Allegra M, Lacour JP, Bahadoran P, Rocchi S, Ballotti R, Bertolotto C. Aurora B is regulated by the mitogen-activated protein kinase/extracellular signal-regulated kinase (MAPK/ERK) signaling pathway and is a valuable potential target in melanoma cells. J Biol Chem. 2012;287:29887–29898. - PMC - PubMed
    1. Bryant KL, Mancias JD, Kimmelman AC, Der CJ. KRAS: feeding pancreatic cancer proliferation. Trends Biochem Sci. 2014;39:91–100. - PMC - PubMed
    1. Caldwell ME, DeNicola GM, Martins CP, Jacobetz MA, Maitra A, Hruban RH, Tuveson DA. Cellular features of senescence during the evolution of human and murine ductal pancreatic cancer. Oncogene. 2012;31:1599–1608. - PMC - PubMed

Publication types

MeSH terms

Substances