Comparative Study
. 2016 Feb 26;291(9):4453-61.
doi: 10.1074/jbc.M115.698498. Epub 2016 Jan 2.

The Lipid Bilayer Modulates the Structure and Function of an ATP-binding Cassette Exporter

Affiliations
Comparative Study

The Lipid Bilayer Modulates the Structure and Function of an ATP-binding Cassette Exporter

Maria E Zoghbi et al. J Biol Chem. .

Abstract

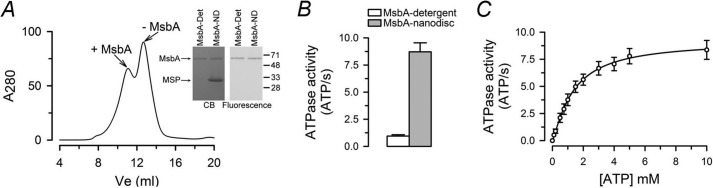
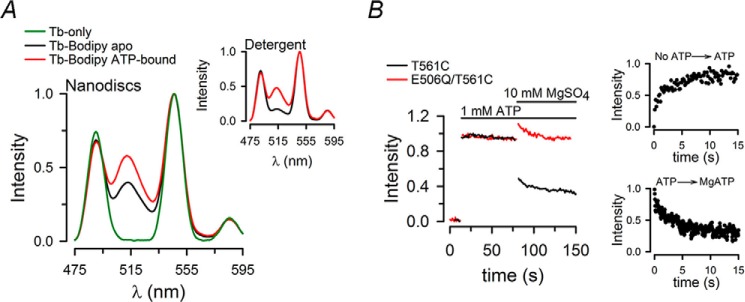
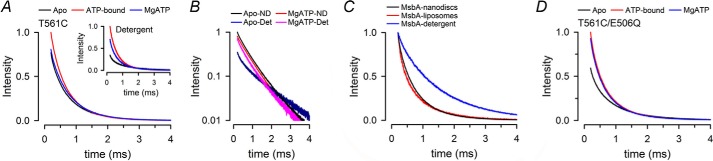
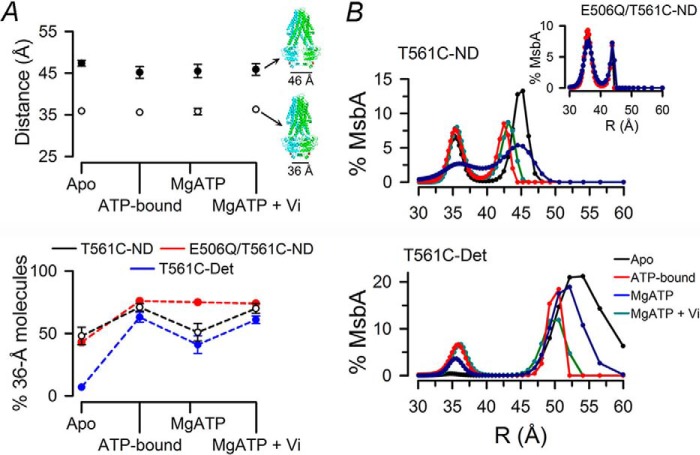
ATP-binding cassette exporters use the energy of ATP hydrolysis to transport substrates across membranes by switching between inward- and outward-facing conformations. Essentially all structural studies of these proteins have been performed with the proteins in detergent micelles, locked in specific conformations and/or at low temperature. Here, we used luminescence resonance energy transfer spectroscopy to study the prototypical ATP-binding cassette exporter MsbA reconstituted in nanodiscs at 37 °C while it performs ATP hydrolysis. We found major differences when comparing MsbA in these native-like conditions with double electron-electron resonance data and the crystal structure of MsbA in the open inward-facing conformation. The most striking differences include a significantly smaller separation between the nucleotide-binding domains and a larger fraction of molecules with associated nucleotide-binding domains in the nucleotide-free apo state. These studies stress the importance of studying membrane proteins in an environment that approaches physiological conditions.

Keywords: ABC transporter; FRET; LRET; MsbA; fluorescence resonance energy transfer (FRET); luminescence resonance energy transfer; membrane bilayer; multidrug transporter; nanodisc; spectroscopy.


Figures

FIGURE 1.
FIGURE 1.
Activity of MsbA-T561C in nanodiscs. A, gel filtration chromatogram of purified MsbA (T561C mutant) reconstituted in nanodiscs. The heavier peak on the left corresponds to MsbA-nanodisc complexes (+ MsbA), whereas the peak on the right corresponds to empty nanodiscs (− MsbA). A280 is the absorbance measured at 280 nm. The panels on the right correspond to purified T561C labeled with Bodipy FL that was either in detergent micelles (MsbA-Det) or reconstituted in nanodiscs (MsbA-ND). The samples were subjected to SDS-PAGE, and the gel was visualized by Coomassie Blue staining (CB) and fluorescence. The positions of molecular mass markers (in kDa) are indicated on the right. The arrows point to purified MsbA and MSP. B, ATPase activity of purified MsbA T561C at 37 °C. The values are presented as means ± S.E. (n = 7 for each condition). The hydrolysis rate of MsbA in nanodiscs was significantly higher than that of MsbA in detergent (p < 0.001). C, dependence of the MsbA-ND ATPase activity on ATP concentration. The measurements were performed at 37 °C, with Mg2+ kept constant at 12 mm. The values are presented as means ± S.E. (n = 4). The solid line is a fit of the Hill equation to the data (Vmax = 9.2 ± 0.2 ATP/s; Km = 1.4 ± 0.1 mm; n = 1.2 ± 0.1).
FIGURE 2.
FIGURE 2.
Effects of ATP on LRET spectra and sensitized emission intensity changes. A, emission spectra from T561C labeled with Tb3+ only in the apo state (Tb-only, green) or Tb3+ and Bodipy FL in the apo (Tb-Bodipy apo, black) and ATP-bound (Tb-Bodipy ATP-bound, red) states. Protein concentration was 0.5 μm, and 1 mm ATP was present for at least 5 min before collecting the spectra. The data were normalized to the 546-nm Tb3+ emission peak. Spectra from MsbA in nanodiscs (main panel) and in detergent (inset) are shown. B, typical changes in Bodipy FL sensitized emission in T561C-nanodisc (T561C, black) and E506Q/T561C-nanodisc (E506Q/T561C, red) complexes in response to sequential additions of ATP and MgSO4. Signals were normalized to the total change elicited by ATP. Stopped flow LRET records are shown in the smaller panels on the right to display changes that were too fast to follow in a standard cuvette (main panel). Records are representative of data from at least five similar experiments. All data were obtained at 37 °C.
FIGURE 3.
FIGURE 3.
Sensitized Bodipy FL emission decays during the ATP-hydrolysis cycle. A, sensitized Bodipy FL emission decays from MsbA in nanodiscs (T561C-ND, main panel) and in detergent (T561C-Det, inset). Black, Apo; red, ATP-bound; blue, MgATP. Intensities were normalized to the ATP intensity at 200 μs. The traces are representative of eight similar experiments. B, semilog graph of selected LRET decays from A. Apo-ND, nucleotide-free T561C in nanodiscs; MgATP-ND, T561C in nanodiscs in the presence of MgATP; Apo-Det, nucleotide-free T561C in detergent; MgATP-ND, T561C in detergent in the presence of MgATP. C, comparison of the sensitized Bodipy FL emission decays from T561C in detergent, nanodiscs and liposomes. The data were obtained in the absence of nucleotides (apo state), and the intensities were normalized to the intensity at 200 μs to emphasize the faster decays in liposomes and nanodiscs, but the intensities in liposomes and nanodiscs were higher than those in detergent as a result of the increased LRET (see A, B, and D). The traces are representative of three similar experiments. D, LRET decays from E506Q/T561C in nanodiscs. See A for details. All experiments were performed at 37 °C.
FIGURE 4.
FIGURE 4.
Conformational changes during the ATP hydrolysis cycle. A, distances calculated from the LRET sensitized Bodipy FL emission decays and changes in the distribution of molecules during the ATP hydrolysis cycle. Top panel, calculated distances (R) in different states during the hydrolysis cycle in T561C-nanodisc complexes (means ± S.D., n = 8; open and filled circles correspond to R1 and R2 in Table 1, respectively). Possible MsbA structures associated with each distance are shown on the right. Monomers in the MsbA homodimer are depicted in blue and cyan; Cys-561 is shown in red. The 36 Å structure is represented by the outward-facing conformation (Protein Data Bank code 3B60) with MgAMPPNP bound, and the 46 Å structure was obtained as an intermediate conformation during the morph transition from the open inward-facing (Protein Data Bank code 3B5W) to the outward-facing conformation using PyMOL (Schrödinger). Bottom panel, percentage of MsbA molecules displaying the shorter distance (∼36 Å). The data obtained from T561C in nanodiscs (T561C-ND, black, n = 8), E506Q/T561 in nanodiscs (E506Q/T561C-ND, red, n = 3), and T561C in detergent (T561C-Det, blue, n = 6) are presented as means ± S.D. Percentages of molecules in each conformation were calculated from the fractional intensity contribution of each exponential component divided by the rate of energy transfer (k = 1/τDA − 1/τD). B, distance distributions calculated from the lifetime distributions of LRET sensitized emission intensity decays under different states during the hydrolysis cycle. Black, Apo; red, ATP-bound; blue, Mg-ATP; cyan, MgATP + Vi. The data are from T561C-nanodiscs (top panel) and T561C in detergent (bottom panel). The inset displays distribution of distances from E506Q/T561C-nanodisc complexes. All data were obtained at 37 °C.

References

    1. Al-Shawi M. K. (2011) Catalytic and transport cycles of ABC exporters. Essays Biochem. 50, 63–83 - PubMed
    1. Bouige P., Laurent D., Piloyan L., and Dassa E. (2002) Phylogenetic and functional classification of ATP-binding cassette (ABC) systems. Curr. Protein Pept. Sci. 3, 541–559 - PubMed
    1. Sharom F. J. (2008) ABC multidrug transporters: structure, function and role in chemoresistance. Pharmacogenomics 9, 105–127 - PubMed
    1. Hopfner K. P., Karcher A., Shin D. S., Craig L., Arthur L. M., Carney J. P., and Tainer J. A. (2000) Structural biology of Rad50 ATPase: ATP-driven conformational control in DNA double-strand break repair and the ABC-ATPase superfamily. Cell 101, 789–800 - PubMed
    1. Smith P. C., Karpowich N., Millen L., Moody J. E., Rosen J., Thomas P. J., and Hunt J. F. (2002) ATP binding to the motor domain from an ABC transporter drives formation of a nucleotide sandwich dimer. Mol. Cell 10, 139–149 - PMC - PubMed

Publication types

MeSH terms