. 2016 Jan 4:7:10262.
doi: 10.1038/ncomms10262.

Mechanism of FGF receptor dimerization and activation

Affiliations

Mechanism of FGF receptor dimerization and activation

Sarvenaz Sarabipour et al. Nat Commun. .

Abstract

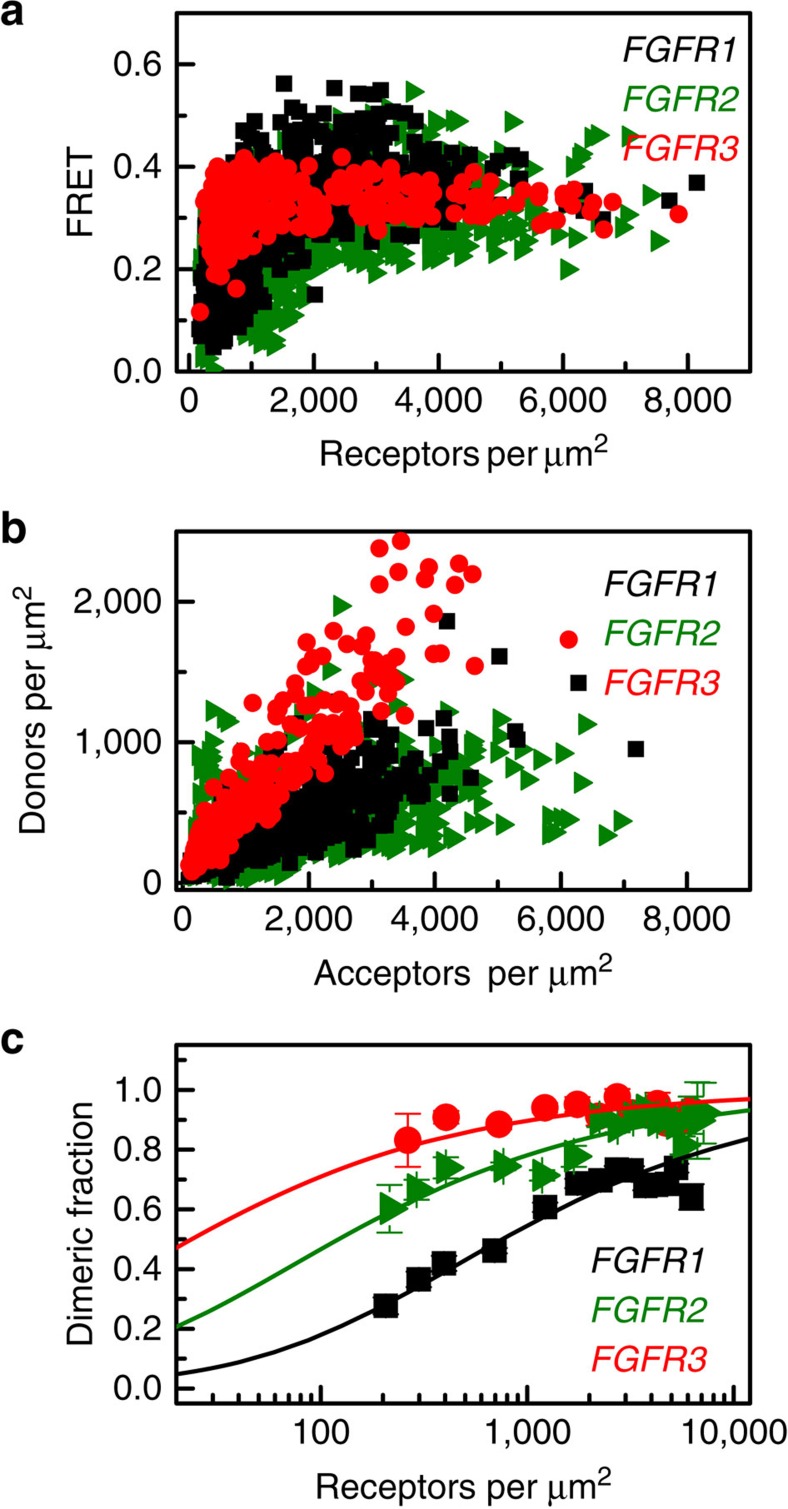
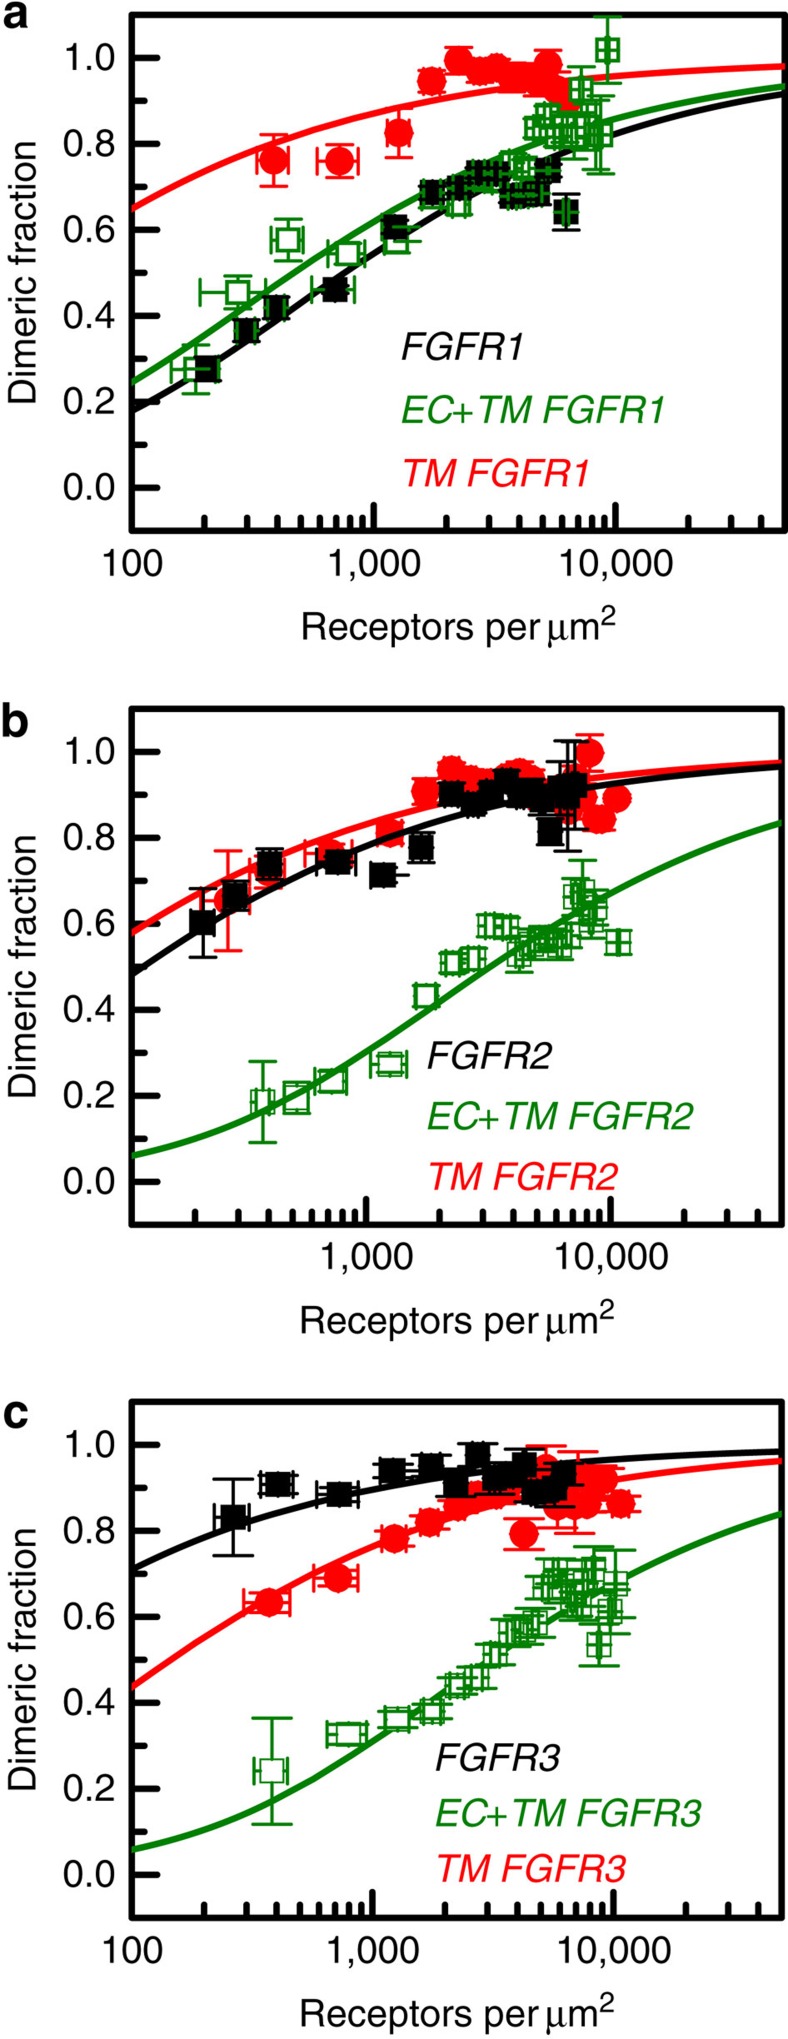
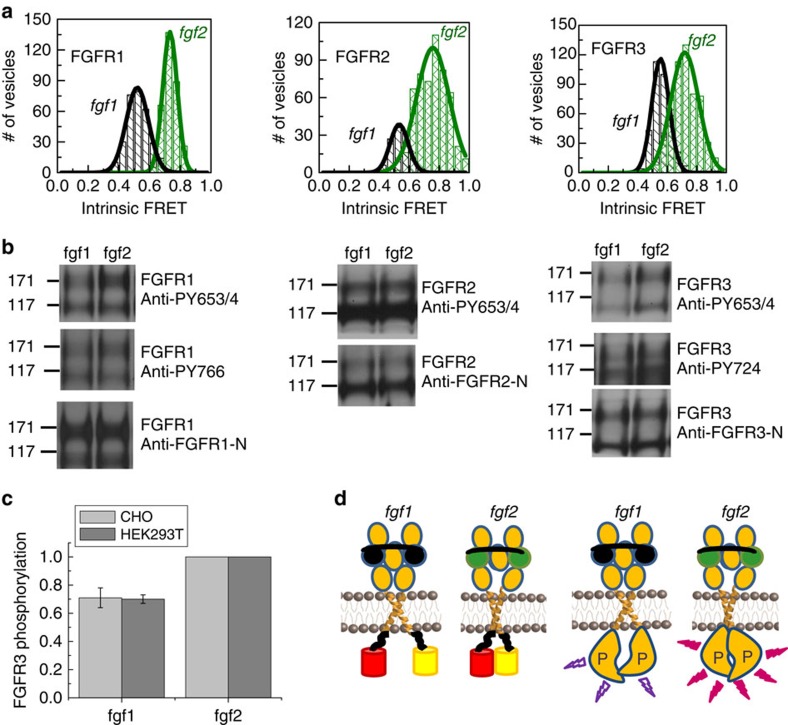
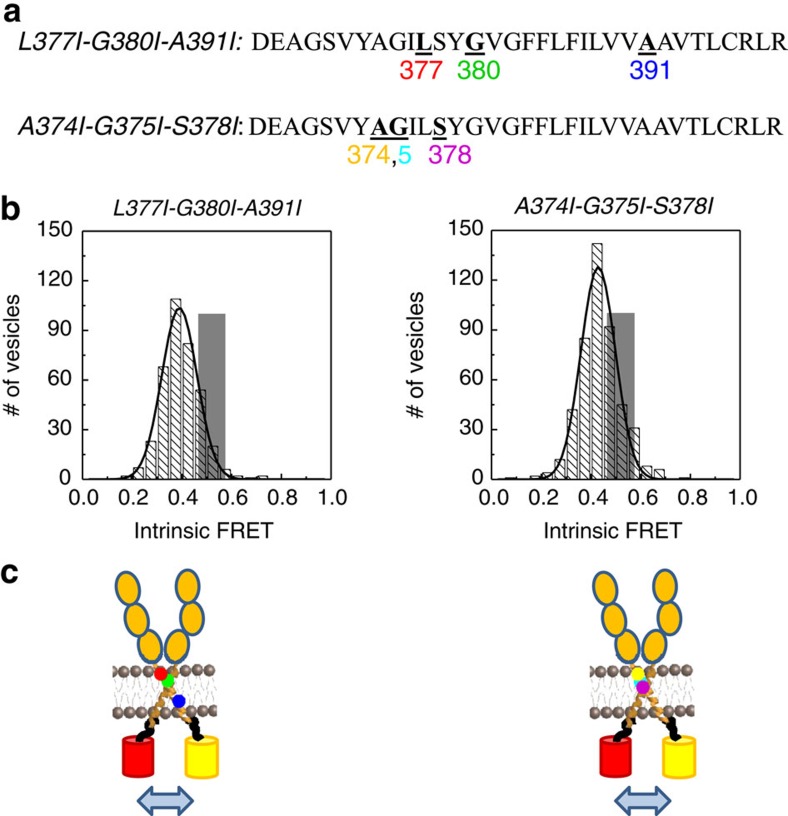
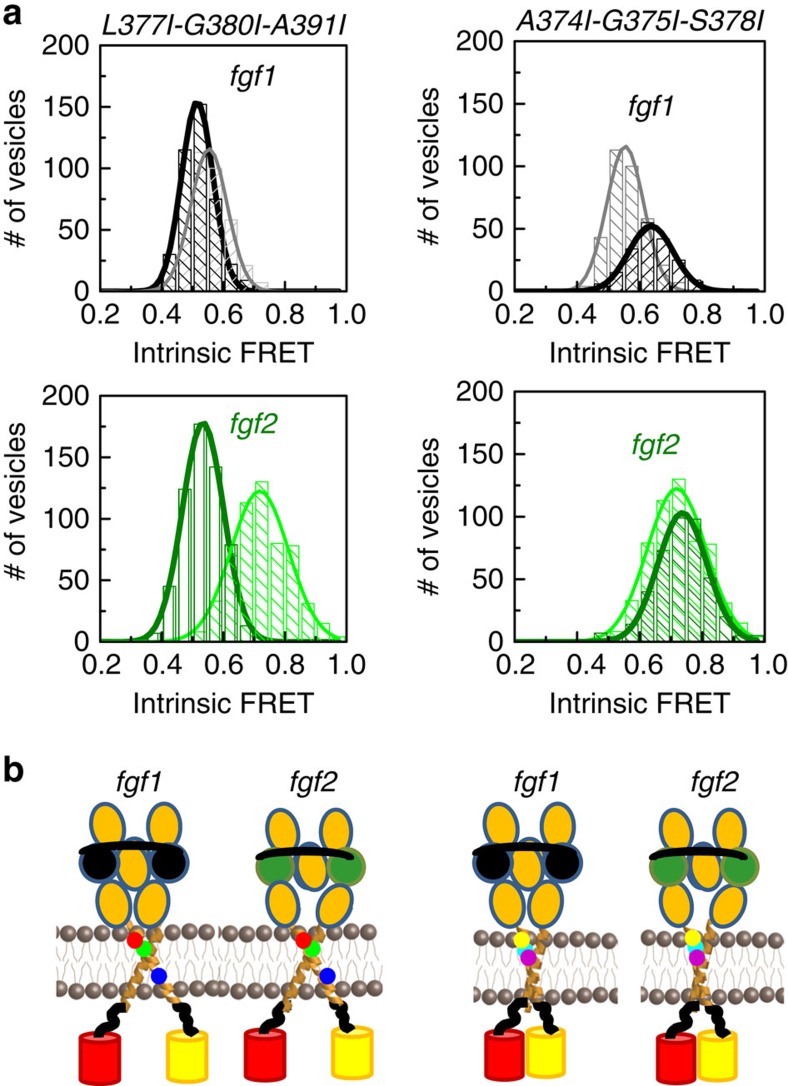
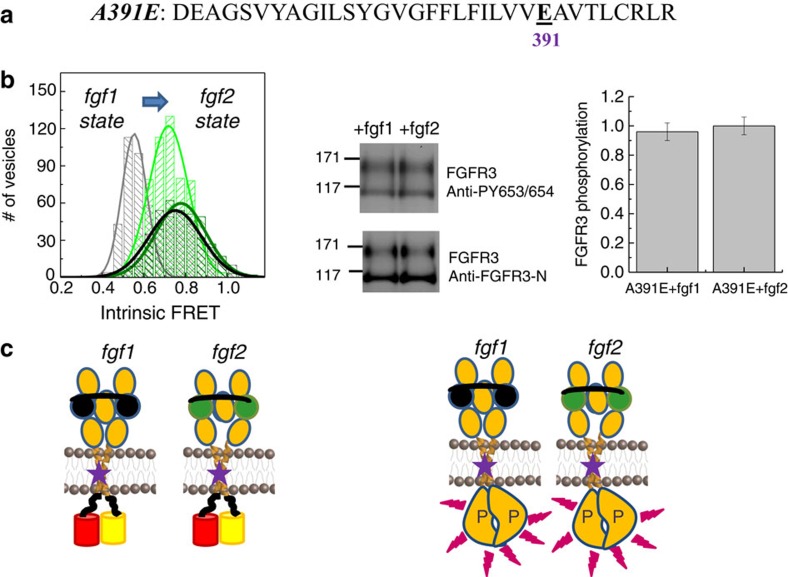
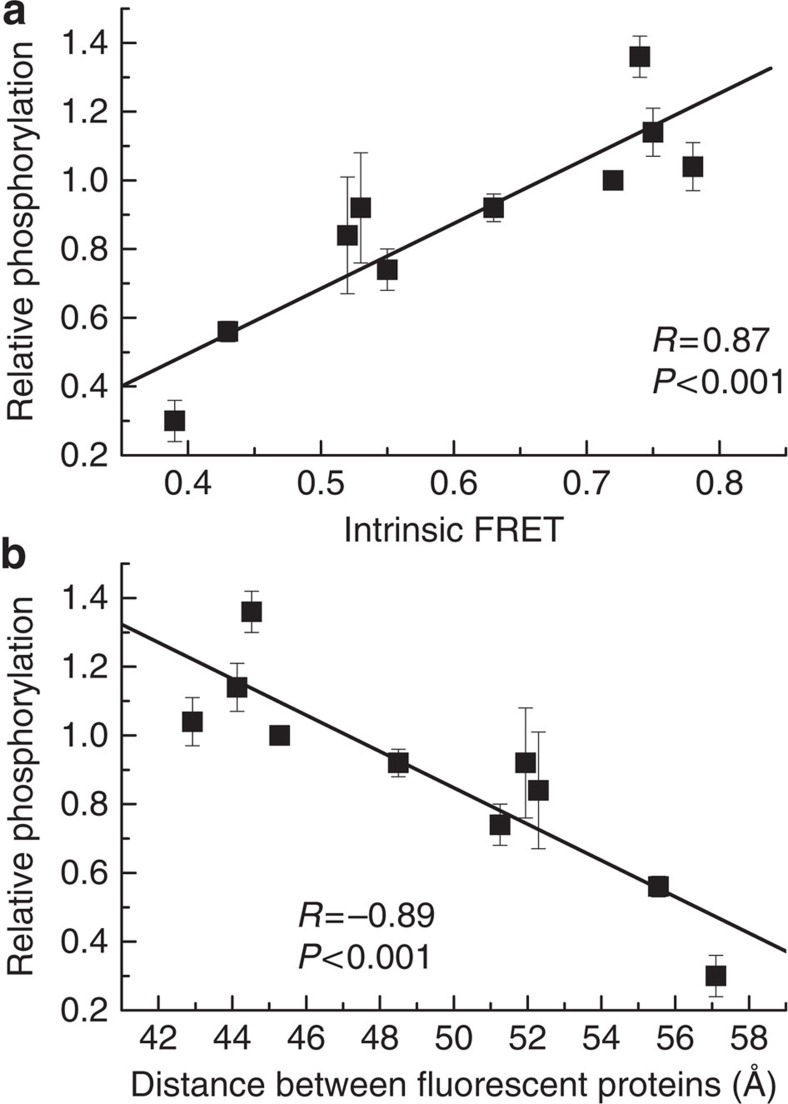
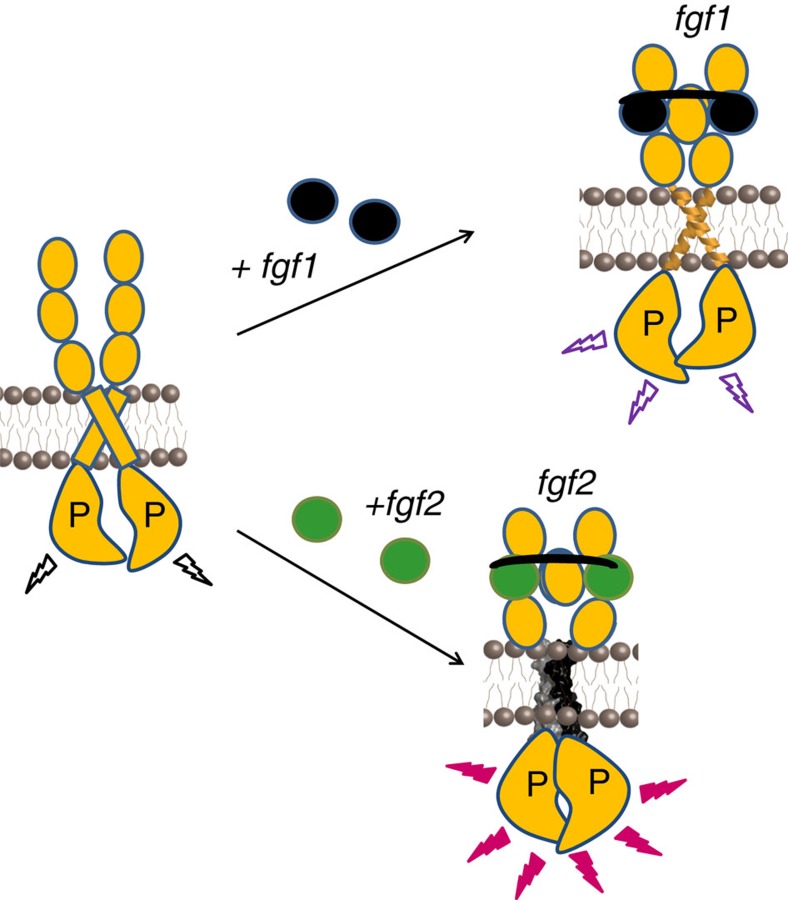
Fibroblast growth factors (fgfs) are widely believed to activate their receptors by mediating receptor dimerization. Here we show, however, that the FGF receptors form dimers in the absence of ligand, and that these unliganded dimers are phosphorylated. We further show that ligand binding triggers structural changes in the FGFR dimers, which increase FGFR phosphorylation. The observed effects due to the ligands fgf1 and fgf2 are very different. The fgf2-bound dimer structure ensures the smallest separation between the transmembrane (TM) domains and the highest possible phosphorylation, a conclusion that is supported by a strong correlation between TM helix separation in the dimer and kinase phosphorylation. The pathogenic A391E mutation in FGFR3 TM domain emulates the action of fgf2, trapping the FGFR3 dimer in its most active state. This study establishes the existence of multiple active ligand-bound states, and uncovers a novel molecular mechanism through which FGFR-linked pathologies can arise.


Figures

Figure 1
Figure 1. FGF receptor dimerization in the absence of ligand.
(a) Measured FRET in plasma membrane-derived vesicles, as a function of receptor concentration, for FGFR1 (black), FGFR2 (olive) and FGFR3 (red). Every data point represents a single vesicle. (b) The donor concentration is plotted as a function of the acceptor concentration, for each vesicle. (c) Dimeric fraction as a function of total receptor concentrations. The experimentally determined dimeric fractions are binned and are shown with the symbols, along with the standard errors. Each bin contains between 5 and 50 experimental points. The solid lines are the dimerization curves, plotted for the optimized dimerization parameters in Table 1.
Figure 2
Figure 2. FGFR domain contributions to unliganded dimerization.
Dimerization curves are shown for the full-length receptors (black), for truncated receptors that lack the IC domain and thus contain only the EC and TM domains (olive), and for the TM domains only (red). (a) FGFR1. (b) FGFR2. (c) FGFR3. Data for EC+TM FGFR3 and TM FGFR3 are from ref. . The measured dimeric fractions are binned and are shown with the symbols, along with the standard errors. Each bin contains between 5 and 50 experimental points. The solid lines are the best fits of a monomer–dimer equilibrium model to the single-vesicle data. These data demonstrate that the TM domains have a strong propensity for dimerization. The EC domains, on the other hand, inhibit dimerization. The contribution of the IC domains is favourable, but it varies from zero to −3 kcal mol−1 for the three receptors.
Figure 3
Figure 3. Conformational changes and activation of the FGF receptors.
(a) Histograms of single-vesicle intrinsic FRET values, measured for the three FGF EC+TM receptor constructs in the presence of saturating fgf1 (black) or fgf2 (olive) concentrations. Intrinsic FRET is a measure of the separation between the fluorescent proteins in the dimer. Two different intrinsic FRET values were measured for fgf1 and fgf2. Therefore, the binding of these two ligands to the extracellular domains leads to different separation of the fluorescent proteins on the cytoplasmic side of the membrane (Table 2). (b) Western blots, reporting on the phosphorylation of the full-length receptors in the presence of saturating concentrations of fgf1 and fgf2 (5 μg ml−1). Expression of the receptors was probed with antibodies to the extracellular domains of the three receptors. Phosphorylation was assayed using antibodies against phosphorylated tyrosines in the activation loop of the three kinases (anti-phospho-Y653/4) or other phosphorylated tyrosine residues. Two bands are observed for all receptors. Only the top bands, corresponding to the fully glycosylated mature receptors that reside primarily in the plasma membrane, were considered in our analysis. There is a difference between the phosphorylation in response to fgf1 and fgf2 for FGFR1 and FGFR3, but not for FGFR2 (see text). (c) Relative FGFR3 phosphorylation in response to fgf1 and fgf2 is quantified and compared using a t-test. Five independent experiments were performed in two cell lines, CHO and HEK 293T. Phosphorylation was calculated by dividing the intensities of the anti-phospho-Y bands to the intensities of the anti-receptor bands, and scaled to the fgf2 case. The difference in FGFR3 phosphorylation in response to fgf1 and fgf2 is highly statistically significant (P<0.01). (d) Graphic representation of the findings that the fgf1- and fgf2-bound states are structurally and functionally distinct. Left: graphic (not to scale) representation of the finding that the average distance between the fluorescent proteins is larger when fgf1 is bound, as compared with the fgf2-bound case. Right: graphic representation of the finding that phosphorylation is higher when fgf2 is bound. The representation of the kinase domains is a cartoon, not based on structural data.
Figure 4
Figure 4. The L377I-G380I-A391I and the A374I-G375I-S378I sets of mutations affect the unliganded dimer state.
(a) Sequence of FGFR3 TM domain, with the mutations that were engineered in this study underlined. The L377I-G380I-A391I set of mutations (left) were engineered to destabilize the interface in the FGFR3 dimer structure, solved for the isolated TM domain in detergent micelles. The A374I-G375I-S378I mutations (right) were engineered to destabilize a putative alternative dimer structure, mediated by GxxxG-like motifs. (b) Intrinsic FRET values measured for the L377I-G380I-A391I (left) and A374I-G375I-S378I (right) mutants in the absence of ligand. Dark grey Gaussians: histograms of single-vesicle intrinsic FRET measured for the constitutively dimeric EC+TM L377I-G380I-A391I (left) and A374I-G375I-S378I (right) mutants in the absence of ligand (Supplementary Figs 8 and 9). Grey bars: intrinsic FRET for the wild-type EC+TM, obtained by fitting the FRET data to a dimerization model (Table 1). The width of the bar represents the standard error from the fit. The intrinsic FRET decreases due to both mutations, suggesting that the fluorescent proteins in the mutant dimers move away from each other due to the mutations. (c) Graphic representation of the effect of the mutations on structure, indicating an increase in separation between the fluorescent proteins. Cartoons are not drawn to scale.
Figure 5
Figure 5. Effect of the L377I-G380I-A391I and A374I-G375I-S378I mutations on the fgf1- and fgf2-bound FGFR3 dimer structures.
Left: results for the L377I-G380I-A391I mutant. Right: results for the A374I-G375I-S378I mutant. (a) Intrinsic FRET values, measured for the truncated EC+TM FGFR3 mutants. The histograms of measured intrinsic FRET values in single vesicles for the wild type are shown in grey for the fgf1 case and in green for the fgf2 case. The histograms for the mutants are shown in black in the presence of fgf1 and in olive in the presence of fgf2. The L377I-G380I-A391I set of mutations (left) decreases the intrinsic FRET in the presence of fgf2, down to fgf1 wild-type levels. The A374I-G375I-S378I set of mutations (right) increases the intrinsic FRET in the presence of fgf1. (b) Graphic representation of the findings that the L377I-G380I-A391I mutations abolish the fgf2-bound state and induce a transition to the fgf1-bound state, while the A374I-G375I-S378I mutations abolish the fgf1 state. Cartoons are not drawn to scale.
Figure 6
Figure 6. Effect of the pathogenic A391E FGFR3 mutation on dimer structures in the fgf1- and fgf2-bound states.
The A391E mutation is the genetic cause for Crouzon syndrome with acanthosis nigricans, a cranial abnormality, and has been linked to bladder cancer. (a) Sequence of the A391E TM domain, with the mutation underlined. (b) Intrinsic FRET values, measured for the A391E EC+TM mutant in the presence of saturating concentrations of fgf1 or fgf2. The histograms for the wild type are shown in grey in the presence of fgf1 and in green in the presence of fgf2. The histograms for the A391E mutant are shown in black in the presence of fgf1 and in olive in the presence of fgf2. The intrinsic FRET values measured for the A391E mutant in the presence of fgf1 shift up, such that they overlap with the fgf2 wild-type values. Thus, the A391E mutation abolished the fgf1-bound state. (b) Western blots showing expression, as assayed by anti-FGFR3 antibodies, and phosphorylation of the tyrosines in the activation loop, as assayed by anti-phospho-Y653/4 antibodies. The phosphorylation of the mature fully glycosylated A391E mutant (top bands) is identical in the fgf1 and fgf2-bound states (P>0.01), and is the same as the phosphorylation of the wild type in the fgf2-bound state. Data are from three independent experiments. Thus, the A391E mutation increases the phosphorylation in the fgf1 state to fgf2-state levels. (c) Graphic representation of the finding that the A391E mutation abolishes the fgf1-bound state and induces a transition to the fgf2 state. Left: graphic representation of the finding that the average distance between the fluorescent proteins is the same in the presence of both fgf1 and fgf2. Distances are not drawn to scale. Right: graphic representation of the finding that phosphorylation is also the same in the presence of fgf1 and fgf2. The representation of the kinase domains is not based on structural data.
Figure 7
Figure 7. Correlation between intrinsic FRET and phosphorylation.
Results are shown for wild-type FGFR3 and the three studied FGFR3 mutants: the L377I-G380I-A391I mutant, the A374I-G375I-S378I mutant, and the A391E mutant, when 100% dimeric (see text). At least three independent experiments were performed for each mutant. The phosphorylation of the wild type in the fgf2-bound state is assigned a value of 1, and all other measured phosphorylation levels are scaled accordingly. (a) There is a strong correlation between the measured intrinsic FRET and phosphorylation (P<0.001). (b) Strong correlation between the distance between fluorescent proteins in the EC+TM FGFR3 constructs and full-length FGFR3 phosphorylation.
Figure 8
Figure 8. The mechanism of FGFR3 activation.
Top: on fgf1 binding to extracellular domains D2 and D3, and the D2–D3 linker, FGFR3 TM domains change their configuration and engage in interactions that involve small residues in the N-terminal portion of the TM domains. FGFR3 dimer phosphorylation increases by a factor of ∼1.5 to ∼3. Bottom: binding of fgf2 to D2, D3, and the linker, on the other hand, triggers a switch towards a closely packed TM dimer structure. Contacts between the TM helices are likely mediated by L377, G380 and/or A391, as in the case of a published NMR structure of the isolated TM domain. FGFR3 dimer phosphorylation increases by a factor of ∼2 to ∼4.

References

    1. Wilkie A. O. M., Morriss-Kay G. M., Jones E. Y. & Heath J. K. Functions of fibroblast growth factors and their receptors. Curr. Biol. 5, 500–507 (1995). - PubMed
    1. Eswarakumar V. P., Lax I. & Schlessinger J. Cellular signaling by fibroblast growth factor receptors. Cytokine Growth Factor Rev. 16, 139–149 (2005). - PubMed
    1. Ornitz D. M. FGFs, heparan sulfate and FGFRs: complex interactions essential for development. BioEssays 22, 108–112 (2000). - PubMed
    1. Ornitz D. M. & Itoh N. Fibroblast growth factors. Genome Biol. 2, (2001). - PMC - PubMed
    1. Deng C., Wynshaw-Boris A., Zhou F., Kuo A. & Leder P. Fibroblast growth factor receptor 3 is a negative regulator of bone growth. Cell 84, 911–921 (1996). - PubMed

Publication types

Substances