. 2016 Jan 4:6:18685.
doi: 10.1038/srep18685.

Telomerase reverse transcriptase acts in a feedback loop with NF-κB pathway to regulate macrophage polarization in alcoholic liver disease

Affiliations

Telomerase reverse transcriptase acts in a feedback loop with NF-κB pathway to regulate macrophage polarization in alcoholic liver disease

Xiao-Qin Wu et al. Sci Rep. .

Abstract

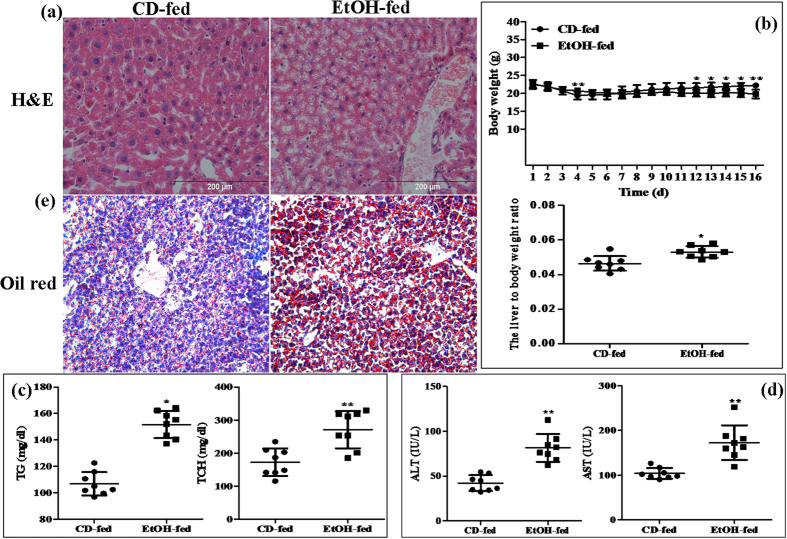
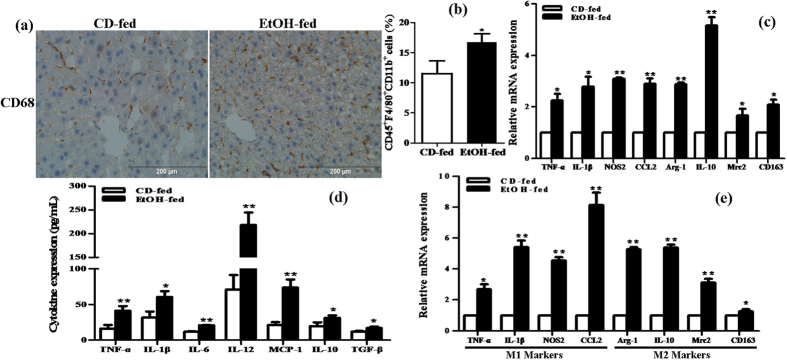
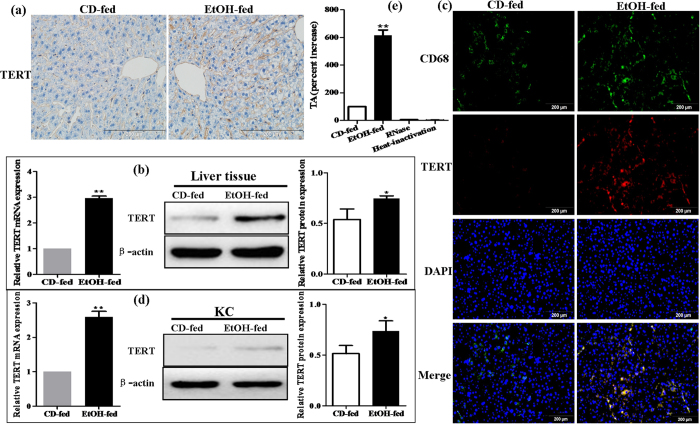
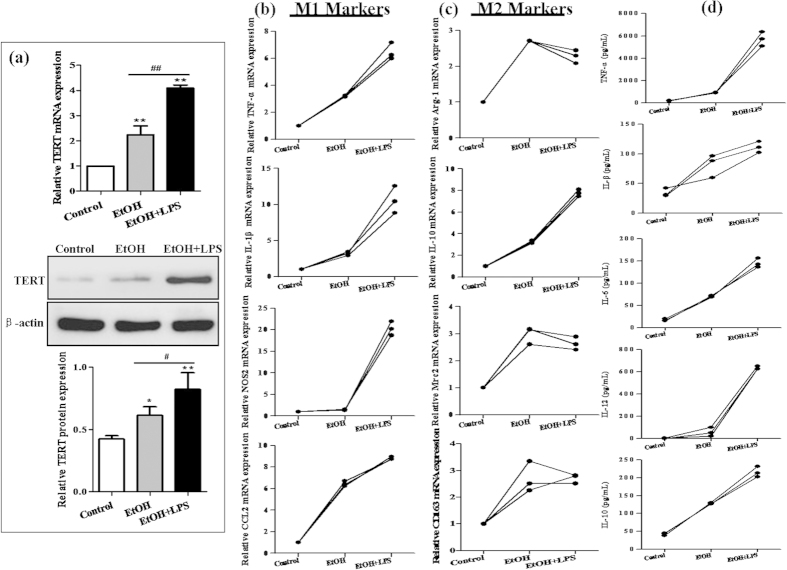
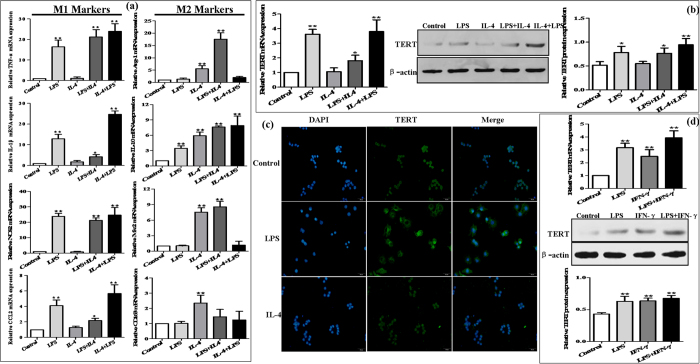
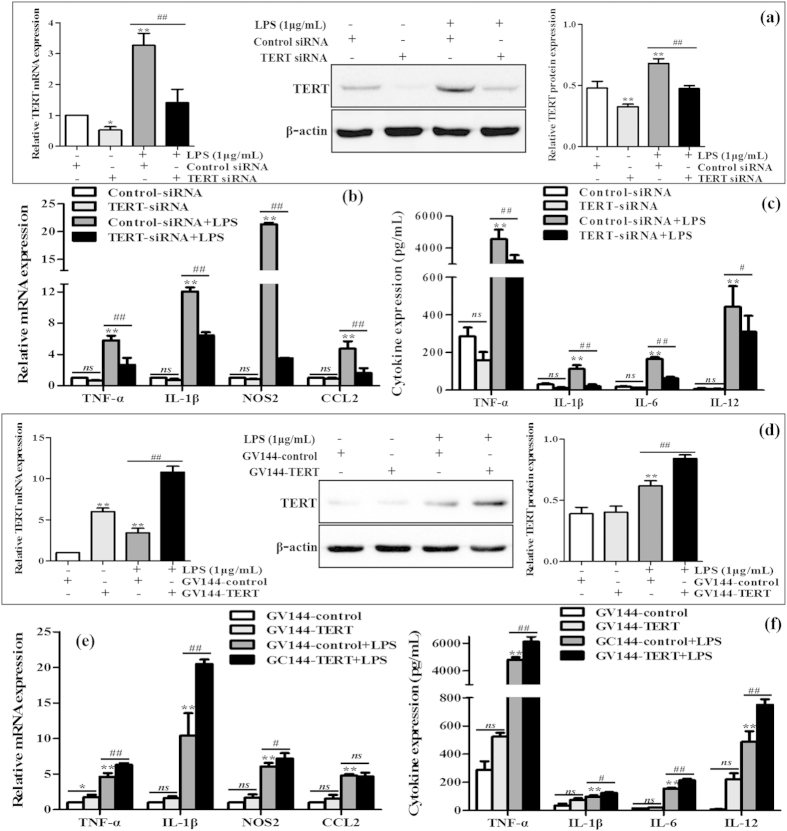
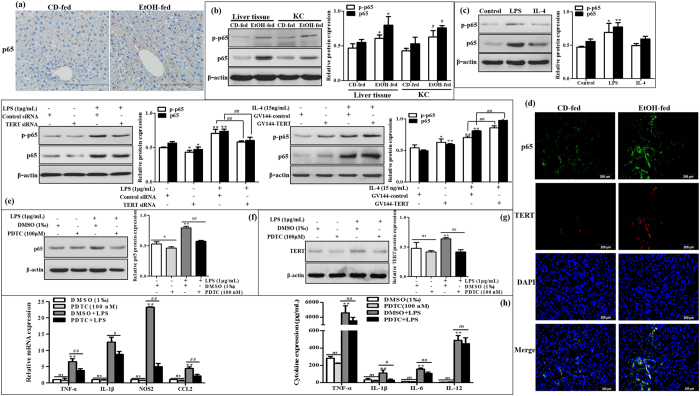
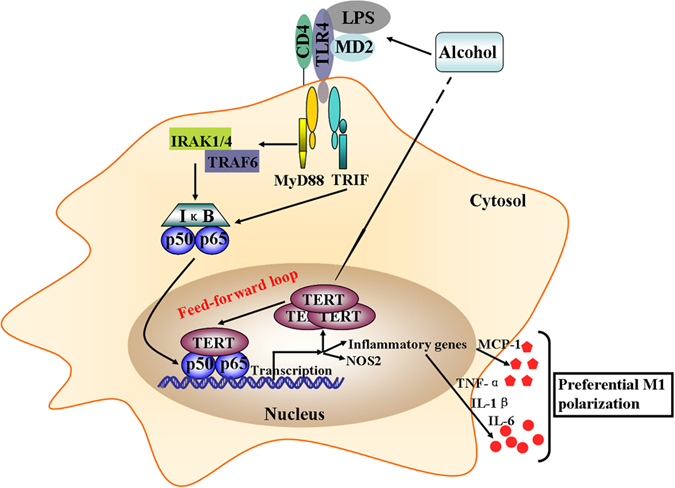
Activation of Kupffer cells (KCs) plays a central role in the pathogenesis of alcoholic liver disease (ALD). C57BL/6 mice fed EtOH-containing diet showed a mixed induction of hepatic classical (M1) and alternative (M2) macrophage markers. Since telomerase activation occurs at critical stages of myeloid and lymphoid cell activation, we herein investigated the role of telomerase reverse transcriptase (TERT), the determining factor of telomerase, in macrophage activation during ALD. In our study, TERT expression and telomerase activity (TA) were remarkably increased in liver tissue of EtOH-fed mice. Moreover, EtOH significantly up-regulated TERT in isolated KCs and RAW 264.7 cells and LPS induced TERT production in vitro. These data indicate that up-regulation of TERT may play a critical role in macrophages during ALD. Furthermore, loss- and gain-of-function studies suggested that TERT switched macrophages towards M1 phenotype by regulating NF-κB signaling, but had limited effect on M2 macrophages polarization in vitro. Additionally, PDTC, a chemical inhibitor of NF-κB, could dramatically down-regulate TERT expression and the hallmarks of M1 macrophages. Therefore, our study unveils the role of TERT in macrophage polarization and the cross-talk between TERT and p65, which may provide a possible explanation for the ethanol-mediated hepatic proinflammatory response and M1 macrophage polarization.


Figures

Figure 1
Figure 1. Pathological characteristics in a mouse model of alcoholic liver disease (ALD).
(a) Representative hematoxylin and eosin (H&E) staining of liver tissues. (b) Body weights and the liver to body weight ratio after ethanol feeding. (c) Hepatic triglyceride (TG) and total cholesterol (TCH) levels. (d) Serum ALT and AST levels. (E) Representative Oil Red O staining of liver tissues. The values represent means ± SD. (n = 8 in CD-fed group, n = 8 in EtOH-fed group) *P < 0.05, **P < 0.01 vs CD-fed group.
Figure 2
Figure 2. Characteristic of the liver immune cell population in the progression of ALD.
(a) The expression of CD68 in liver tissue was analyzed by immunohistochemical (IHC) staining analysis. Representative views from each group were presented (original magnification, ×40). (b) Effect of alcohol on the number of CD45+F4/80+CD11b+ cells in KCs isolated from the liver by using FACS analysis. (c) Effect of alcohol on the mRNA levels of M1 macrophage markers (TNF-α, IL-1β, IL-6 and CCL2) and the M2 macrophage marker including Arg-1, IL-10, Mrc2 and CD163 in liver tissue. (d) Effect of alcohol on the circulation levels of pro-inflammatory cytokines (TNF-α, IL-1β, IL-6, IL-12 and MCP-1) and anti-inflammatory cytokines (IL-10 and TGF-β) in serum. (e) Effect of alcohol on the mRNA levels of M1/M2 macrophage markers in KCs isolated from the liver. The results are shown as relative expression against control expression without treatment. The values represent means ± SD. (n = 4 in CD-fed group, n = 8 in EtOH-fed group) *P < 0.05, **P < 0.01 vs CD-fed group.
Figure 3
Figure 3. Effect of alcohol on TERT expression in liver tissues and KCs during ALD development.
(a) TERT expression in liver tissues was performed by IHC analysis. Representative views from each group were presented (original magnification, ×40). (b) Total TERT mRNA and protein levels in liver tissue were analyzed by real-time PCR and western blot. The results are shown as relative expression against control expression without treatment. (c) Representative colocalization of TERT with macrophage CD68 immunoreactivity in liver tissue by using the double immunofluorescent (IF) analysis. (d) Total TERT mRNA and protein levels in KCs isolated from the liver were analyzed by real-time PCR and western blot. The results are shown as relative expression against control expression without treatment. (e) Quantification of telomerase activity (TA) in CD-fed mice and EtOH-fed mice. RNase treatment or heat inactivation of KCs isolated from the liver of EtOH-fed mice served as negative controls for the TA assay. All quantitative data are presented as mean ± SD percentage increase compared with CD-fed group (n = 4 in CD-fed group, n = 6 in EtOH-fed group) *P < 0.05, **P < 0.01 vs CD-fed group.
Figure 4
Figure 4. Effect of alcohol on TERT expression in vitro.
Acute alcohol treatment of RAW 264.7 cells can be achieved with 25 mM EtOH for 24 h. (a) TERT mRNA and protein expression in EtOH-stimulated RAW 264.7 cells were analyzed by real-time PCR and western blot. The results are shown as relative expression against control expression without treatment. The values represent means ± SD. *P < 0.05, **P < 0.01 vs control. #P<0.05, ##P<0.01 vs EtOH-treated group. (b) Effect of alcohol on M1 macrophage markers (TNF-α, IL-1β, CCL2 and NOS2) in RAW 264.7 cells without or with LPS stimulation. (c) Effect of alcohol on M2 macrophage markers (Arg-1, IL-10, Mrc2 and CD163) in RAW 264.7 cells without or with LPS stimulation. (d) Effect of alcohol on the production of cytokines including TNF-α, IL-1β, IL-6, IL-12 and IL-10 in RAW 264.7 cells without or with LPS stimulation. The results are shown as line chart.
Figure 5
Figure 5. Plastic expression of TERT in murine macrophages.
RAW264.7 cells were treated with LPS (1 μg/mL) for 24 h to polarize M1 macrophage phenotype, while treatment with IL-4 (15 ng/mL) for 24 h induced M2 macrophage phenotype. One population into another was transformed by culturing M1 macrophages with IL-4 and M2 macrophages with LPS, respectively. (a) The mRNA levels of M1 macrophage markers (TNF-α, IL-1β, CCL2 and NOS2) and M2 macrophage markers (Arg-1, IL-10, Mrc2 and CD163) were analyzed by real-time PCR. (b) The plastic expression of TERT in murine macrophage polarization was determined by real-time PCR and western blot. The results are shown as relative expression against control expression without treatment. Data shown are the mean ± SD from 3 independent experiments. *P < 0.05, **P < 0.01 vs control. (c) The expression of TERT in RAW264.7 macrophages polarization was analyzed by immunofluorescence (IF) assay. Representative views from each group were presented (original magnification, ×20). (d) RAW264.7 cells were treated with IFN-γ (10 ng/mL) for 24 h alone or in combination with LPS. The production of TERT was determined by real-time PCR and western blot. The results are shown as relative expression against control expression without treatment. Data shown are the mean ± SD from 3 independent experiments. *P < 0.05, **P < 0.01 vs control.
Figure 6
Figure 6. Effect of TERT silencing on murine M1 macrophage polarization.
TERT siRNA and GV144-TERT were transiently transfected into LPS-treated RAW264.7 cells, respectively. (a) The endogeous TERT levels were detected by real-time PCR and western blot. The results are shown as relative expression against control expression without treatment. (b) The mRNA levels of M1 macrophages biomarkers including TNF-α, IL-1β, NOS2 and CCL2 were detected by real-time PCR. The results are shown as relative expression against control expression without treatment. (c) The secretion of proinflammatory cytokines including TNF-α, IL-1β, IL-6 and IL-12 were determined by ELISA. (d) TERT successful over-expression was verified by real-time PCR and western blot in LPS-stimulated RAW 264.7 cells. The results are shown as relative expression against control expression without treatment. (e) The mRNA levels of M1 macrophages biomarkers were detected by real-time PCR. The results are shown as relative expression against control expression without treatment. (f) The secretion of proinflammatory cytokines were determined by ELISA. Data shown are the mean ± SD from 3 independent experiments. *P < 0.05, **P < 0.01 vs control group. #P < 0.05, ##P < 0.01 vs LPS-treated group.
Figure 7
Figure 7. The interaction of TERT with p65 in murine macrophages.
(a) The expression of p65 in liver tissue was analyzed by IHC staining analysis. Representative views from each group were presented (original magnification, ×40). (b) The protein expression and phosphorylation of p65 at Ser 536 were observed in liver tissue and KCs isolated from the liver by western blot. The results are shown as relative expression against control expression without treatment. The values represent means ± SD. (n = 4 in CD-fed group, n=6 in EtOH-fed group) *P < 0.05, **P < 0.01 vs liver tissues of CD-fed group. #P < 0.05, ##P < 0.01 vs KCs of CD-fed group. (c) p65 protein expression and phosphorylation were analyzed in total cell lysates of M0, M1 and M2 macrophages by western blot. The results are shown as relative expression against control expression without treatment. Data shown are the mean ± SD from 3 independent experiments. *P < 0.05, **P < 0.01 vs control. (d) Representative colocalization of TERT with macrophage p65 immunoreactivity in liver tissue by using the double immunofluorescent (IF) analysis. (e) Effect of TERT on p65 expression and activation in LPS-stimulated RAW 264.7 cells. The expression of p65 and phosphorylated p65 were determined by western blot. (f) Effect of PDTC on p65 expression in LPS-stimulated RAW 264.7 cells. The expression of p65 was determined by western blot. (g) The expression of TERT upon treatment with PDTC was determined by western blot in LPS-stimulated RAW 264.7 cells. (h) Effect of PDTC on the expression of M1 macrophage biomarkers in LPS-stimulated RAW 264.7 cells. The results are shown as relative expression against control expression without treatment. Data shown are the mean ± SD from 3 independent experiments. *P < 0.05, **P < 0.01 vs control. #P < 0.05, ##P < 0.01 vs LPS-treated group.
Figure 8
Figure 8. A schematic model of the molecular mechanisms by which TERT acts in a feedback loop with NF-κB pathway to regulate macrophage polarization in a mouse model of chronic binge alcohol-induced ALD.
On one hand, Up-regulation of TERT upon the EtOH treatment can induce the expression of M1 macrophage markers including TNF-α, IL-1β, IL-6, NOS2, and CCL2 by interacting with p65, which suggests TERT promotes macrophage polarize towards M1 phenotype via NF-κB signaling. On the other hand, as a stimulus of NF-κB signaling, LPS, can bind LPS-binding protein and then deliver the LPS ligand to CD14 receptor. The LPS-CD14 complex interplays with TLR4 in conjunction with the small extracellular protein MD2 to activate intracellular signaling via NF-κB pathway. Upon activation of TLR4, signaling intermediates IRAK1/4 are recruited to the TLR4 complex via interplay with MyD88 leading to IKK kinase activation.TLR4-induced MyD88- independent (TRIF) signalling results in activation of IKKε and NF-κB as well. Afterwards, NF-κB forms p65/p50 heterodimers in macrophages and binds to the promoter region of TERT and various pro-inflammatory genes to result in gene transcription. In short, this crosstalk mechanism may provide a possible explanation for the ethanol-mediated hepatic proinflammatory response and M1 macrophage polarization in vitro.

Similar articles

Cited by

References

    1. Gao B. & Bataller R. Alcoholic liver disease: pathogenesis and new therapeutic targets. Gastroenterology 141, 1572–1585 (2011). - PMC - PubMed
    1. Rehm J. et al. Global burden of disease and injury and economic cost attributable to alcohol use and alcohol-use disorders. Lancet 373, 2223–2233 (2009). - PubMed
    1. Mathurin P. & Bataller R. Trends in the management and burden of alcoholic liver disease. J Hepatol 62, S38–S46 (2015). - PMC - PubMed
    1. Szabo G. Gut-liver axis in alcoholic liver disease. Gastroenterology 148, 30–36 (2015). - PMC - PubMed
    1. Louvet A. & Mathurin P. Alcoholic liver disease: mechanisms of injury and targeted treatment. Nat Rev Gastroenterol Hepatol 12, 231–242 (2015). - PubMed

Publication types

LinkOut - more resources