MYB96 shapes the circadian gating of ABA signaling in Arabidopsis
- PMID: 26725725
- PMCID: PMC4698719
- DOI: 10.1038/srep17754
MYB96 shapes the circadian gating of ABA signaling in Arabidopsis
Abstract
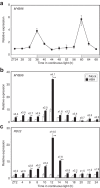
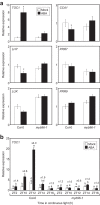
Circadian clocks regulate the rhythms of biological activities with a period of approximately 24-hours and synchronize plant metabolism and physiology with the environmental cycles. The clock also gates responses to environmental stresses to maximize fitness advantages. Here we report that the MYB96 transcription factor is connected with the clock oscillator to shape the circadian gating of abscisic acid (ABA) responses. MYB96 directly binds to the TIMING OF CAB EXPRESSION 1 (TOC1) promoter to positively regulate its expression. The use of myb96 mutant plants shows that this regulation is essential for the gated induction of TOC1 by ABA. In turn, MYB96 induction by ABA is also altered in toc1-3 mutant plants. The increased tolerance to drought of MYB96 over-expressing plants is decreased in the toc1-3 mutant background, suggesting that MYB96 and TOC1 intersect the circadian clock and ABA signaling. The MYB96-TOC1 function might be also regulated by the clock component CIRCADIAN CLOCK-ASSOCIATED 1 (CCA1), which binds to the MYB96 promoter and alters its circadian expression. Thus, a complex circuitry of CCA1-MYB96-TOC1 regulatory interactions provides the mechanistic basis underlying the connection between circadian and stress signaling to optimize plant fitness to ambient stresses.
Figures


Similar articles
-
Unlocking allelic variation in circadian clock genes to develop environmentally robust and productive crops.Planta. 2024 Feb 22;259(4):72. doi: 10.1007/s00425-023-04324-8. Planta. 2024. PMID: 38386103 Free PMC article. Review.
-
Modelling the widespread effects of TOC1 signalling on the plant circadian clock and its outputs.BMC Syst Biol. 2013 Mar 19;7:23. doi: 10.1186/1752-0509-7-23. BMC Syst Biol. 2013. PMID: 23506153 Free PMC article.
-
TOC1 functions as a molecular switch connecting the circadian clock with plant responses to drought.EMBO J. 2009 Dec 2;28(23):3745-57. doi: 10.1038/emboj.2009.297. Epub 2009 Oct 8. EMBO J. 2009. PMID: 19816401 Free PMC article.
-
Appropriate induction of TOC1 ensures optimal MYB44 expression in ABA signaling and stress response in Arabidopsis.Plant Cell Environ. 2024 Aug;47(8):3046-3062. doi: 10.1111/pce.14922. Epub 2024 Apr 23. Plant Cell Environ. 2024. PMID: 38654596
-
Circadian clock-dependent gating in ABA signalling networks.Protoplasma. 2012 Jul;249(3):445-57. doi: 10.1007/s00709-011-0304-3. Epub 2011 Jul 20. Protoplasma. 2012. PMID: 21773710 Review.
Cited by
-
ZEITLUPE Promotes ABA-Induced Stomatal Closure in Arabidopsis and Populus.Front Plant Sci. 2022 Mar 2;13:829121. doi: 10.3389/fpls.2022.829121. eCollection 2022. Front Plant Sci. 2022. PMID: 35310670 Free PMC article.
-
Isolation, cloning and expression of CCA1 gene in transgenic progeny plants of Japonica rice exhibiting altered morphological traits.PLoS One. 2019 Aug 5;14(8):e0220140. doi: 10.1371/journal.pone.0220140. eCollection 2019. PLoS One. 2019. PMID: 31381594 Free PMC article.
-
Environmental F actors coordinate circadian clock function and rhythm to regulate plant development.Plant Signal Behav. 2023 Dec 31;18(1):2231202. doi: 10.1080/15592324.2023.2231202. Plant Signal Behav. 2023. PMID: 37481743 Free PMC article. Review.
-
Unlocking allelic variation in circadian clock genes to develop environmentally robust and productive crops.Planta. 2024 Feb 22;259(4):72. doi: 10.1007/s00425-023-04324-8. Planta. 2024. PMID: 38386103 Free PMC article. Review.
-
Dynamic physiological and transcriptome changes reveal a potential relationship between the circadian clock and salt stress response in Ulmus pumila.Mol Genet Genomics. 2022 Mar;297(2):303-317. doi: 10.1007/s00438-021-01838-2. Epub 2022 Jan 28. Mol Genet Genomics. 2022. PMID: 35089426
References
-
- Schaffer R. et al. The late elongated hypocotyl mutation of Arabidopsis disrupts circadian rhythms and the photoperiodic control of flowering. Cell 93, 1219–1229 (1998). - PubMed
-
- Wang Z. Y. & Tobin E. M. Constitutive expression of the CIRCADIAN CLOCK ASSOCIATED 1 (CCA1) gene disrupts circadian rhythms and suppresses its own expression. Cell 93, 1207–1217 (1998). - PubMed
-
- Strayer C. et al. Cloning of the Arabidopsis clock gene TOC1, an autoregulatory response regulator homolog. Science 289, 768–771 (2000). - PubMed
-
- Huang W. et al. Mapping the core of the Arabidopsis circadian clock defines the network structure of the oscillator. Science 336, 75–79 (2012). - PubMed
Publication types
MeSH terms
Substances
LinkOut - more resources
Full Text Sources
Other Literature Sources
Molecular Biology Databases
Research Materials

