

Investigation of miscellaneous hERG inhibition in large diverse compound collection using automated patch-clamp assay
- PMID: 26725739
- PMCID: PMC4722980
- DOI: 10.1038/aps.2015.143
Investigation of miscellaneous hERG inhibition in large diverse compound collection using automated patch-clamp assay
Abstract
Aim: hERG potassium channels display miscellaneous interactions with diverse chemical scaffolds. In this study we assessed the hERG inhibition in a large compound library of diverse chemical entities and provided data for better understanding of the mechanisms underlying promiscuity of hERG inhibition.
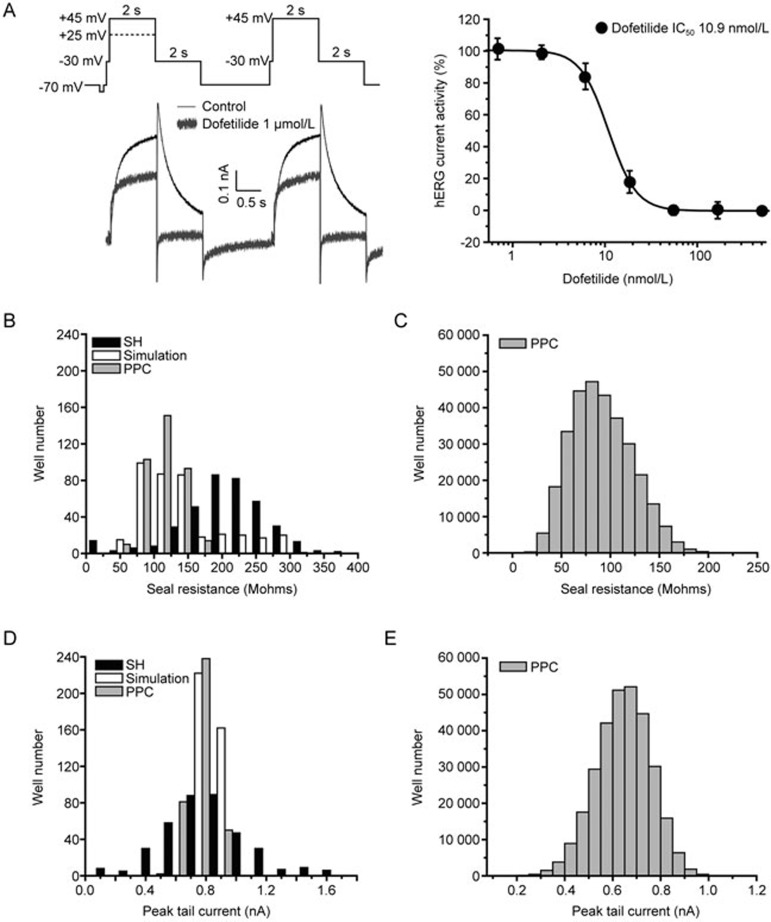
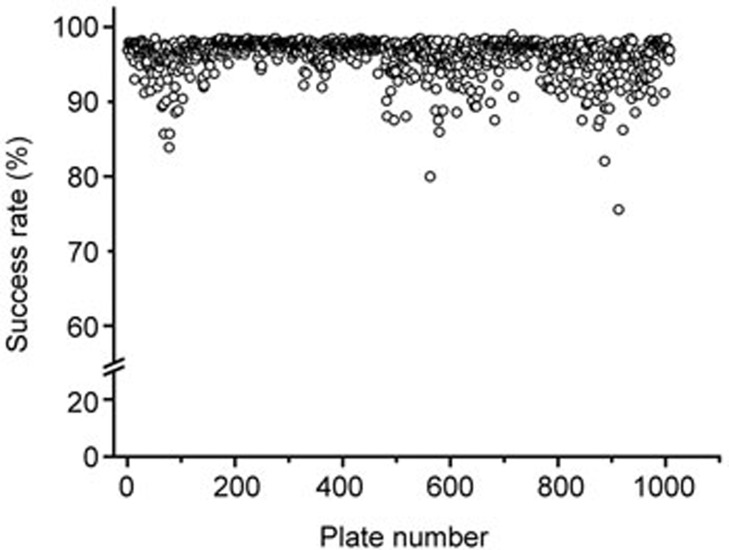
Methods: Approximately 300 000 compounds contained in Molecular Library Small Molecular Repository (MLSMR) library were tested. Compound profiling was conducted on hERG-CHO cells using the automated patch-clamp platform-IonWorks Quattro(™).
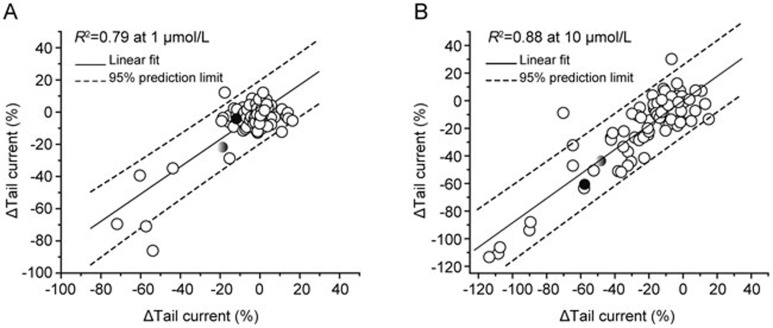
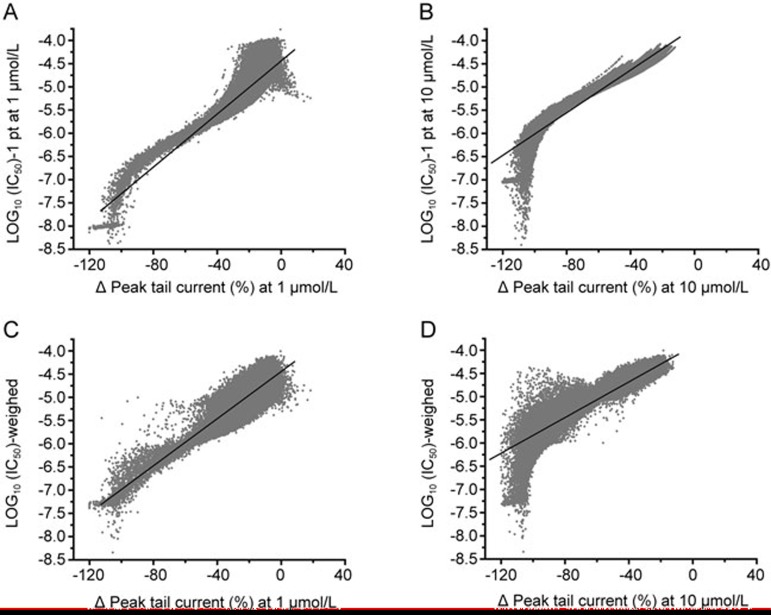
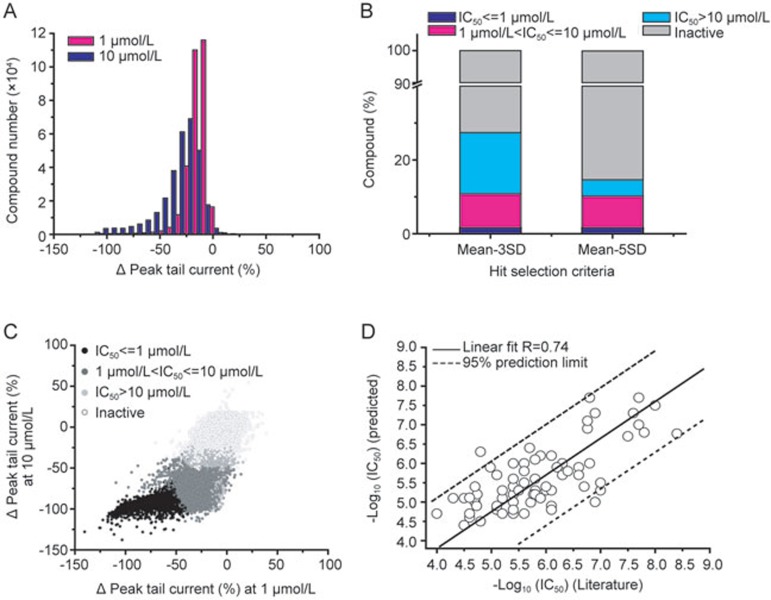
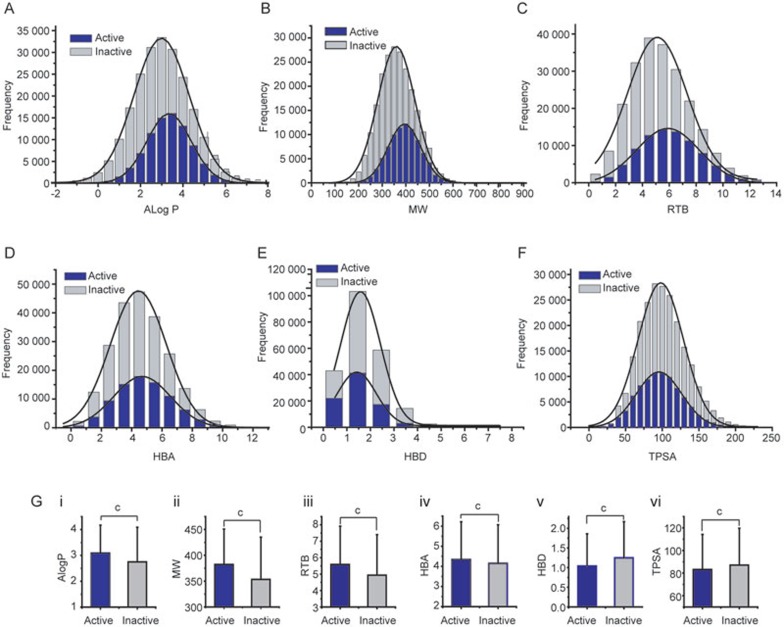
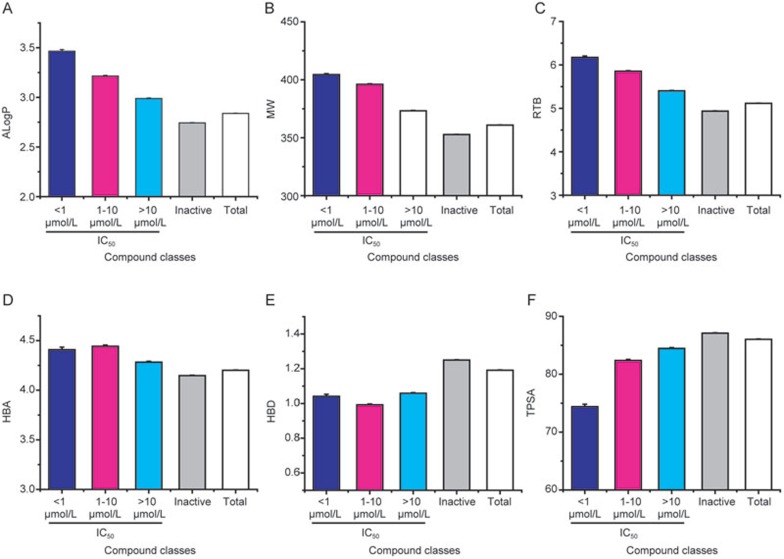
Results: The compound library was tested at 1 and 10 μmol/L. IC50 values were predicted using a modified 4-parameter logistic model. Inhibitor hits were binned into three groups based on their potency: high (IC50<1 μmol/L), intermediate (1 μmol/L< IC50<10 μmol/L), and low (IC50>10 μmol/L) with hit rates of 1.64%, 9.17% and 16.63%, respectively. Six physiochemical properties of each compound were acquired and calculated using ACD software to evaluate the correlation between hERG inhibition and the properties: hERG inhibition was positively correlative to the physiochemical properties ALogP, molecular weight and RTB, and negatively correlative to TPSA.
Conclusion: Based on a large diverse compound collection, this study provides experimental evidence to understand the promiscuity of hERG inhibition. This study further demonstrates that hERG liability compounds tend to be more hydrophobic, high-molecular, flexible and polarizable.
Figures
Similar articles
-
Development of a high-throughput electrophysiological assay for the human ether-à-go-go related potassium channel hERG.J Pharmacol Toxicol Methods. 2013 Jan-Feb;67(1):33-44. doi: 10.1016/j.vascn.2012.10.002. Epub 2012 Oct 26. J Pharmacol Toxicol Methods. 2013. PMID: 23103595
-
Optimisation and validation of a medium-throughput electrophysiology-based hERG assay using IonWorks HT.J Pharmacol Toxicol Methods. 2006 Sep-Oct;54(2):189-99. doi: 10.1016/j.vascn.2006.02.003. Epub 2006 Mar 6. J Pharmacol Toxicol Methods. 2006. PMID: 16563806
-
Comparison of human Ether-à-go-go related gene screening assays based on IonWorks Quattro and thallium flux.Assay Drug Dev Technol. 2010 Dec;8(6):755-65. doi: 10.1089/adt.2010.0267. Epub 2010 Jul 26. Assay Drug Dev Technol. 2010. PMID: 20658944
-
Electrophysiological analysis of mammalian cells expressing hERG using automated 384-well-patch-clamp.BMC Pharmacol Toxicol. 2015 Dec 16;16:39. doi: 10.1186/s40360-015-0042-9. BMC Pharmacol Toxicol. 2015. PMID: 26671227 Free PMC article.
-
Characterization of a hERG screen using the IonWorks HT: comparison to a hERG rubidium efflux screen.Assay Drug Dev Technol. 2005 Feb;3(1):47-57. doi: 10.1089/adt.2005.3.47. Assay Drug Dev Technol. 2005. PMID: 15798395
Cited by
-
The Effect of a Synthetic Estrogen, Ethinylestradiol, on the hERG Block by E-4031.Biomolecules. 2021 Sep 20;11(9):1385. doi: 10.3390/biom11091385. Biomolecules. 2021. PMID: 34572598 Free PMC article.
-
A structure-based computational workflow to predict liability and binding modes of small molecules to hERG.Sci Rep. 2020 Oct 1;10(1):16262. doi: 10.1038/s41598-020-72889-5. Sci Rep. 2020. PMID: 33004839 Free PMC article.
-
Preclinical Characterization and Development on NAQ as a Mu Opioid Receptor Partial Agonist for Opioid Use Disorder Treatment.ACS Pharmacol Transl Sci. 2022 Nov 2;5(11):1197-1209. doi: 10.1021/acsptsci.2c00178. eCollection 2022 Nov 11. ACS Pharmacol Transl Sci. 2022. PMID: 36407950 Free PMC article.
-
A Pooled Analysis of Three Randomized Phase I/IIa Clinical Trials Confirms Absence of a Clinically Relevant Effect on the QTc Interval by Umibecestat.Clin Transl Sci. 2020 Nov;13(6):1316-1326. doi: 10.1111/cts.12832. Epub 2020 Jul 23. Clin Transl Sci. 2020. PMID: 32583957 Free PMC article.
-
New Insights into Ion Channels: Predicting hERG-Drug Interactions.Int J Mol Sci. 2022 Sep 14;23(18):10732. doi: 10.3390/ijms231810732. Int J Mol Sci. 2022. PMID: 36142644 Free PMC article.
References
-
- 1Fermini B, Fossa AA. The impact of drug-induced QT interval prolongation on drug discovery and development. Nat Rev Drug Discov 2003; 2: 439–47. - PubMed
-
- 2Sanguinetti MC, Jiang C, Curran ME, Keating MT. A mechanistic link between an inherited and an acquired cardiac arrhythmia: hERG encodes the IKr potassium channel. Cell 1995; 81: 299–307. - PubMed
-
- 5ICH S7B. Guideline on safety pharmacology studies for assessing the potential for delayed ventricular repolarization (QT interval prolongation) by human pharmaceuticals 2005. - PubMed
Publication types
MeSH terms
Substances
Grants and funding
LinkOut - more resources
Full Text Sources
Other Literature Sources
