. 2016 Mar;24(3):548-55.
doi: 10.1038/mt.2015.236. Epub 2016 Jan 4.

Protein Delivery of an Artificial Transcription Factor Restores Widespread Ube3a Expression in an Angelman Syndrome Mouse Brain

Affiliations

Protein Delivery of an Artificial Transcription Factor Restores Widespread Ube3a Expression in an Angelman Syndrome Mouse Brain

Barbara J Bailus et al. Mol Ther. 2016 Mar.

Abstract

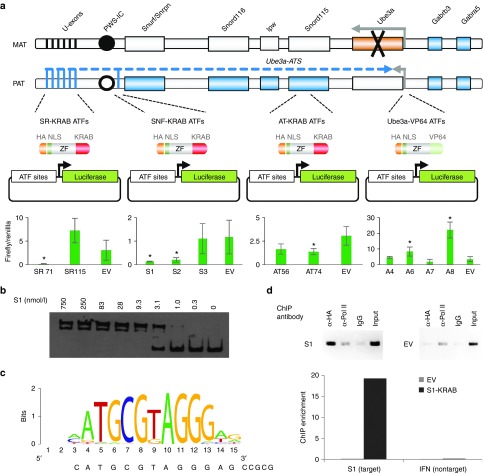
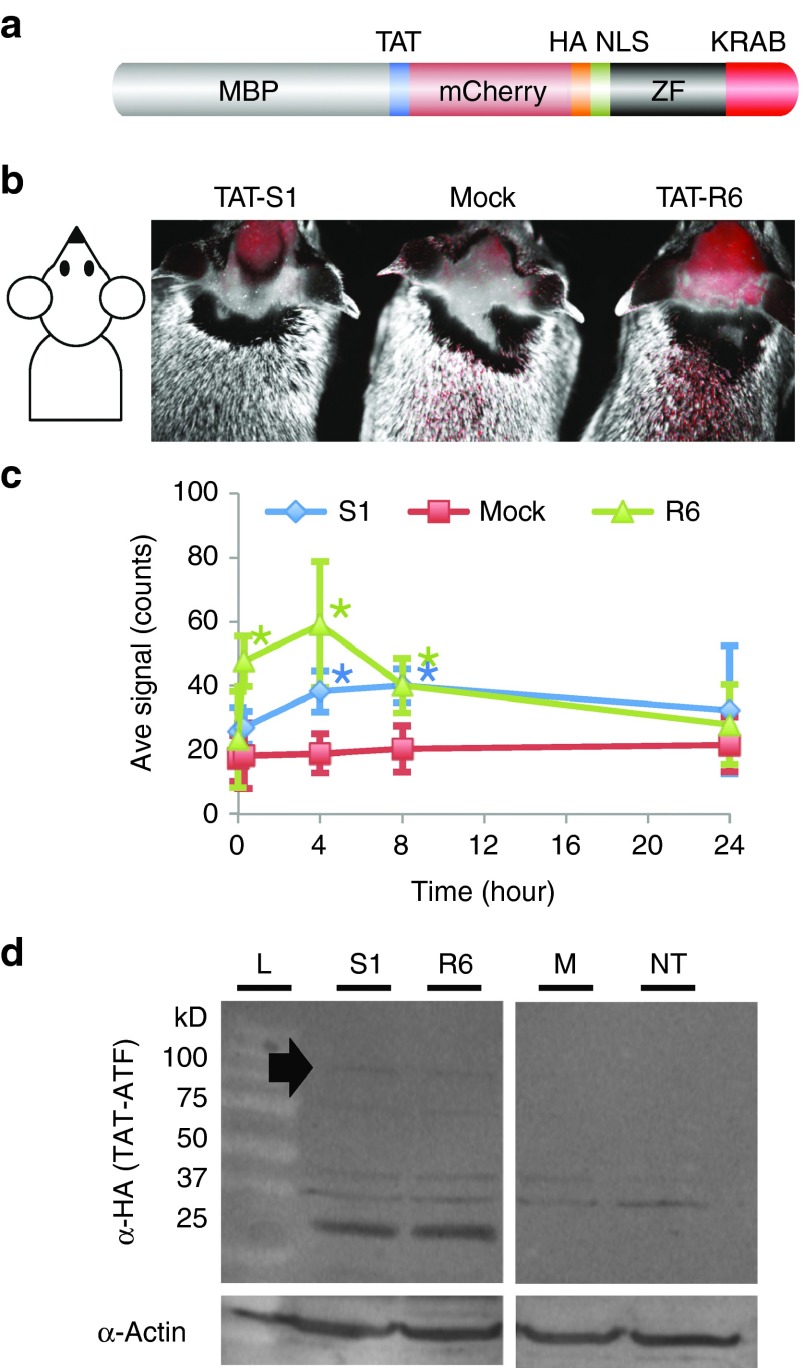
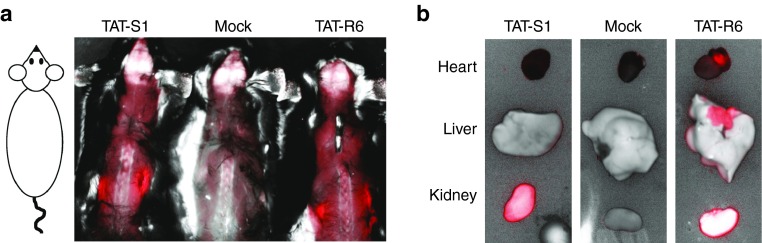
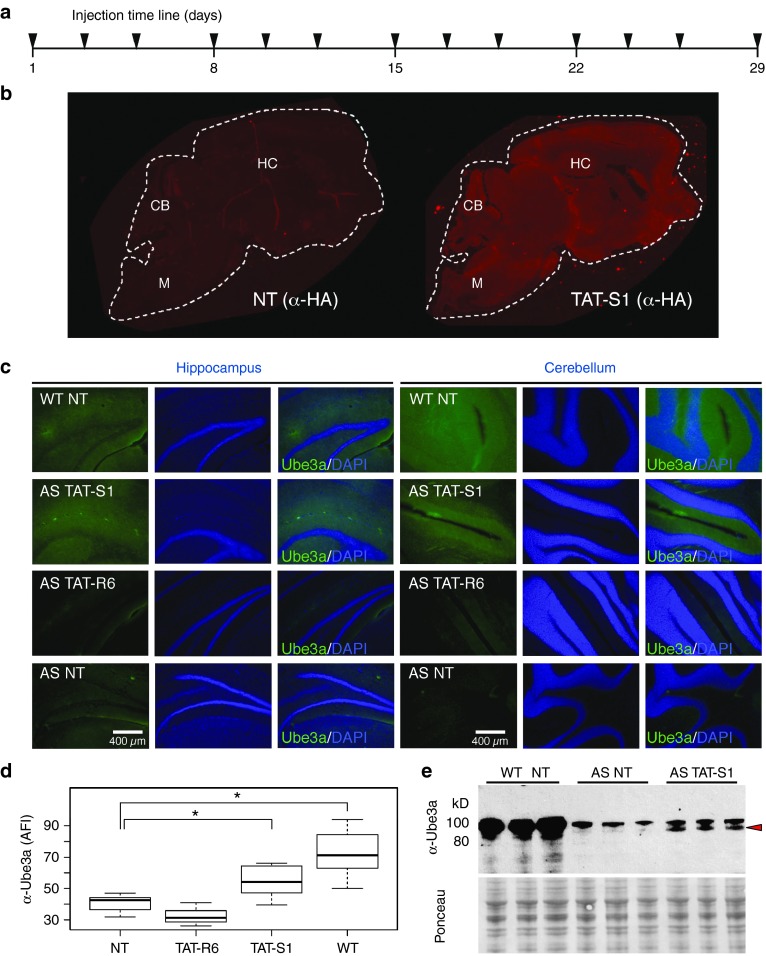
Angelman syndrome (AS) is a neurological genetic disorder caused by loss of expression of the maternal copy of UBE3A in the brain. Due to brain-specific genetic imprinting at this locus, the paternal UBE3A is silenced by a long antisense transcript. Inhibition of the antisense transcript could lead to unsilencing of paternal UBE3A, thus providing a therapeutic approach for AS. However, widespread delivery of gene regulators to the brain remains challenging. Here, we report an engineered zinc finger-based artificial transcription factor (ATF) that, when injected i.p. or s.c., crossed the blood-brain barrier and increased Ube3a expression in the brain of an adult mouse model of AS. The factor displayed widespread distribution throughout the brain. Immunohistochemistry of both the hippocampus and cerebellum revealed an increase in Ube3a upon treatment. An ATF containing an alternative DNA-binding domain did not activate Ube3a. We believe this to be the first report of an injectable engineered zinc finger protein that can cause widespread activation of an endogenous gene in the brain. These observations have important implications for the study and treatment of AS and other neurological disorders.


Figures

Figure 1
Figure 1
ATF targeting strategy and binding results. (a) Top: ATFs are shown in relationship to the genomic region on the mouse chromosome 7. Imprinting in this region results in genes with paternal-only, maternal-only, or silenced expression (active genes, filled; silenced genes, open). Genes outside this region are biallelically expressed. In the Angelman syndrome mouse model used in these studies, a targeted insertion with a stop codon replaces exon five (coding exon 2) of the maternal Ube3a (black X). U-exons, upstream exons of the Ube3a-ATS; PWS-IC, Prader–Willi syndrome imprinting control region either methylated (filled circle) or unmethylated (open circle). Bottom: Luciferase assays of 11 ATFs in HEK293T cells. Bars indicate the firefly luciferase signal, normalized to renilla luciferase control. Error bars indicate SD. *P < 0.01; two-tailed heteroscedastic t-test, representing three biological replicates. (b) Representative electromobility shift assay of S1 ZF array binding its target. (c) In vitro binding motif of the TAT-S1 ATF determined by Bind-n-Seq analysis. The sequence of the S1 target site is below. The motif represents a 56-fold enrichment over random background, P < 0.001, one-tailed Fisher's Exact Test. (d) ChIP–PCR data for the HA-tagged ATF S1 or EV at the S1 chromosomal target site in mouse Neuro2A cells. IgG serves as a negative control. The graph shows ChIP-enrichment relative to 0.1% chromatin input. ATF, artificial transcription factor; ChIP, chromatin immunoprecipitation; EV, empty vector; IFN, interferon; ZF, zinc finger.
Figure 2
Figure 2
Distribution of TAT-S1 and TAT-R6 in adult mouse brain. (a) Structure of TAT-S1 and TAT-R6 ATF proteins. (b) mCherry fluorescence/ambient light merged image of live Ube3a-deficient mice 4 hours postinjection with TAT-S1, ATF injection buffer (Mock), or the negative control TAT-R6 (0.16–0.20 g/kg, i.p.). Fur was shaved to improve the fluorescent signal. (c) Kinetics of fluorescence in the C57BL/6 brains for TAT-S1 (green triangles), Mock (red squares), and TAT-R6 (blue diamonds). *P < 0.005 compared to Mock at that timepoint, two-tailed homoscedastic t-test, n = 5. (d) Western blot detecting the HA tag in brain nuclear lysate 4 hours postinjection. Filled arrow, 100-kD full-length protein band. Potential lower molecular weight breakdown products containing the HA tag are also visible. ATF, artificial transcription factor; M, mock injection; MBP, maltose-binding protein; NT, no treatment; S1, TAT-S1; R6, TAT-R6; ZF, zinc finger.
Figure 3
Figure 3
Artificial transcription factor distribution in other organs. (a) mCherry fluorescence/ambient light merged image of mice harvested 4 hours postinjection with TAT-S1, injection buffer (Mock), or TAT-R6 (0.16–0.20 g/kg, i.p.). The skin on the back was removed to improve the fluorescent signal. Intense signal can be seen in the kidneys. (b) Internal organs harvested after 4 hours. Note that the bright white kidney in the TAT-R6-injected sample indicates fluorescence in excess of the maximum setting.
Figure 4
Figure 4
Reactivation of Ube3a in a mouse model of AS by TAT-S1 but not TAT-R6. (a) Artificial transcription factors were injected (160–200 mg/kg, s.c.) three times per week for 4 weeks, with the final inject 4 hours before harvest. (b) TAT-S1 distribution in a whole brain sagittal section (HA, 5 µm) from wild-type mice receiving NT or TAT-S1. White dashed line indicates outline of brain section. Images were not altered. (c) Imaging of Ube3a protein expression (green) or DAPI (blue) in brain slices of the hippocampus and cerebellum (Ube3a (Sigma E8655), 50 µm). Sections from NT wild-type and AS mice are shown as controls. A 10% linear brightness reduction was applied equally to the green channel of all images to reduce autofluorescence and clarify features. (d) Quantification of Ube3a from unaltered images of the same regions in different mice. One-way analysis of variance found significant difference between groups (F(3,18) = 15.5, P < 0.0001), n = 3–4 mice. *P < 0.01, post hoc Tukey–Kramer honest significant difference. (e) Western blot of Ube3a from brain cytosolic lysates of three different mice that received the indicated treatment (α-Ube3a, Sigma E8655). Red arrow indicates isoform that is specific to both the WT and TAT-S1-treated mice, but absent in the AS NT controls. Ponceau S staining of the membrane is shown as a loading control. AFI, average fluorescence intensity; AS, Angelman syndrome; CB, cerebellum; DAPI, 4′,6-diamidino-2-phenylindole; HC, hippocampus; M, medulla; NT, no treatment; WT, wild type.

References

    1. Lalande, M and Calciano, MA (2007). Molecular epigenetics of Angelman syndrome. Cell Mol Life Sci 64: 947–960. - PMC - PubMed
    1. Angelman, H (1965). ‘Puppet' children. A report on three cases. Dev Med Child Neurol 7: 681–688. - PubMed
    1. Kishino, T, Lalande, M and Wagstaff, J (1997). UBE3A/E6-AP mutations cause Angelman syndrome. Nat Genet 15: 70–73. - PubMed
    1. Chamberlain, SJ, Chen, PF, Ng, KY, Bourgois-Rocha, F, Lemtiri-Chlieh, F, Levine, ES et al. (2010). Induced pluripotent stem cell models of the genomic imprinting disorders Angelman and Prader-Willi syndromes. Proc Natl Acad Sci USA 107: 17668–17673. - PMC - PubMed
    1. Albrecht, U, Sutcliffe, JS, Cattanach, BM, Beechey, CV, Armstrong, D, Eichele, G et al. (1997). Imprinted expression of the murine Angelman syndrome gene, Ube3a, in hippocampal and Purkinje neurons. Nat Genet 17: 75–78. - PubMed

Publication types