. 2016 Jan;40(1):122-33.
doi: 10.1111/acer.12936.

The Impact of Prenatal Ethanol Exposure on Neuroanatomical and Behavioral Development in Mice

Affiliations

The Impact of Prenatal Ethanol Exposure on Neuroanatomical and Behavioral Development in Mice

Charles W Abbott et al. Alcohol Clin Exp Res. 2016 Jan.

Abstract

Background: In utero alcohol, or ethanol (EtOH), exposure produces developmental abnormalities in the brain of the fetus, which can result in lifelong behavioral abnormalities. Fetal alcohol spectrum disorders (FASD) is a term used to describe a range of adverse developmental conditions caused by EtOH exposure during gestation. Children diagnosed with FASD potentially exhibit a host of phenotypes including growth retardation, facial dysmorphology, central nervous system anomalies, abnormal behavior, and cognitive deficits. Previous research suggests that abnormal gene expression and circuitry in the neocortex may underlie reported disabilities of learning, memory, and behavior resulting from early exposure to alcohol (J Neurosci, 33, 2013, 18893).

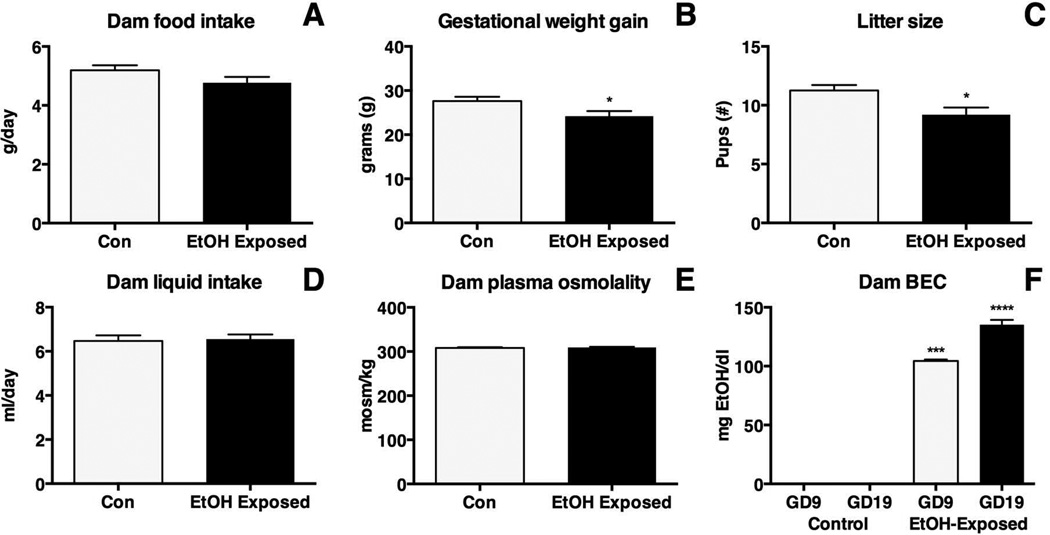
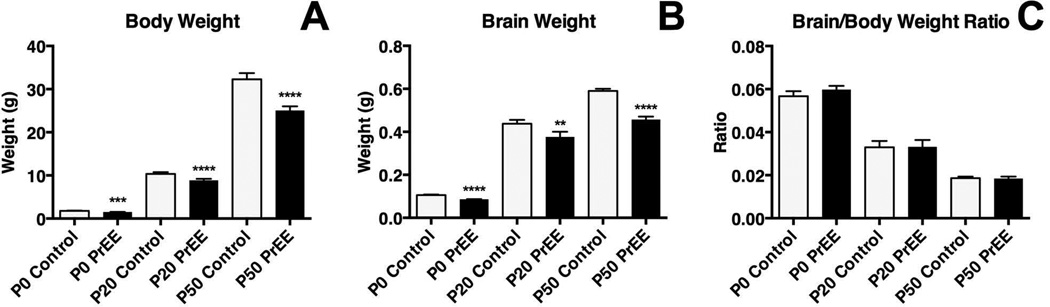
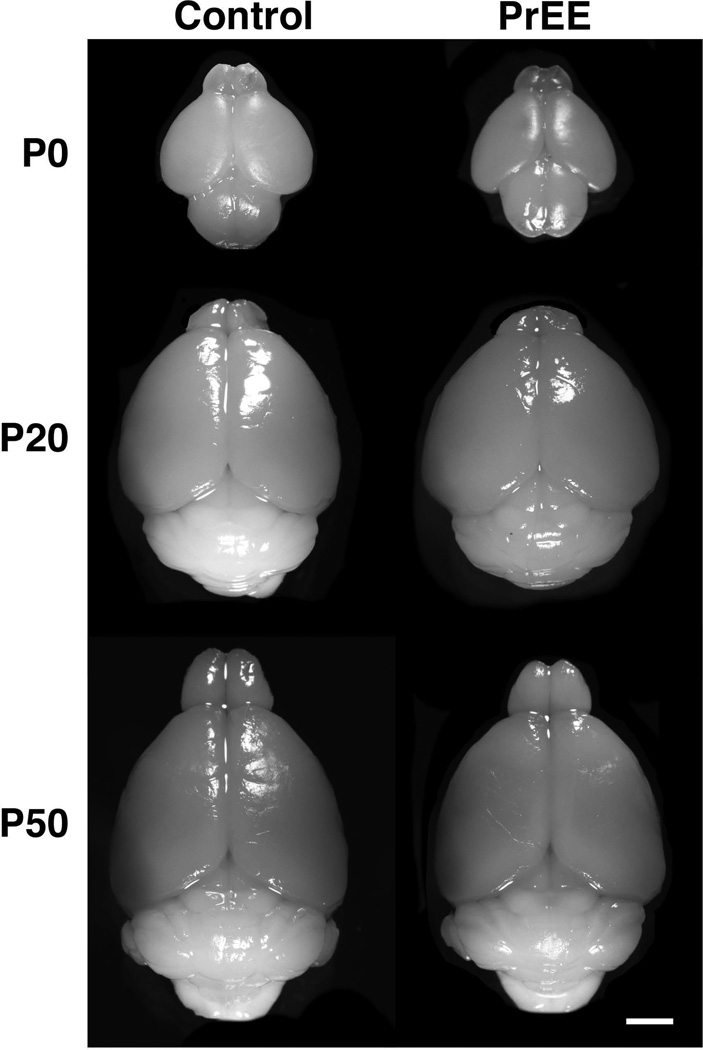
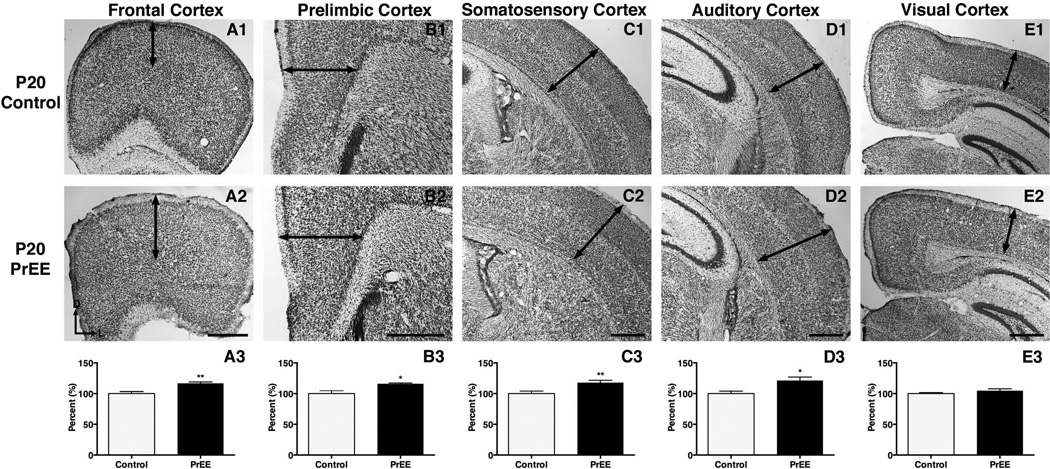
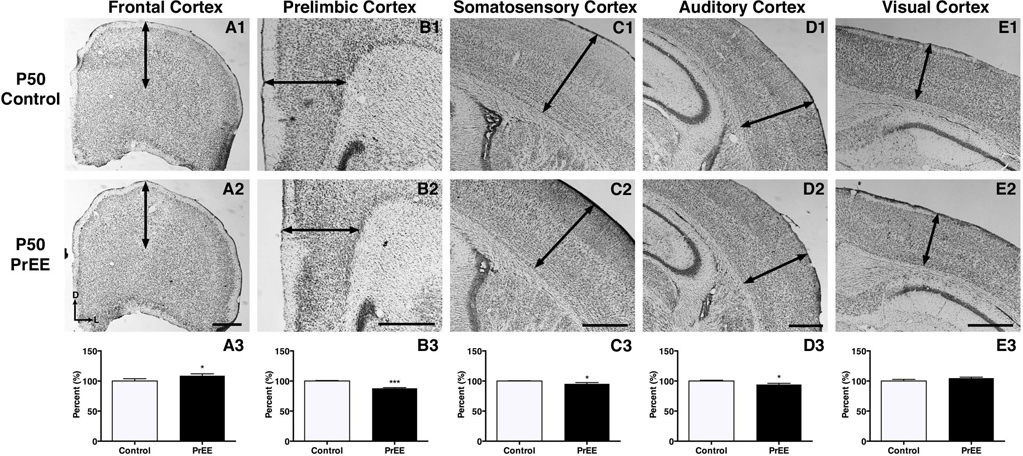
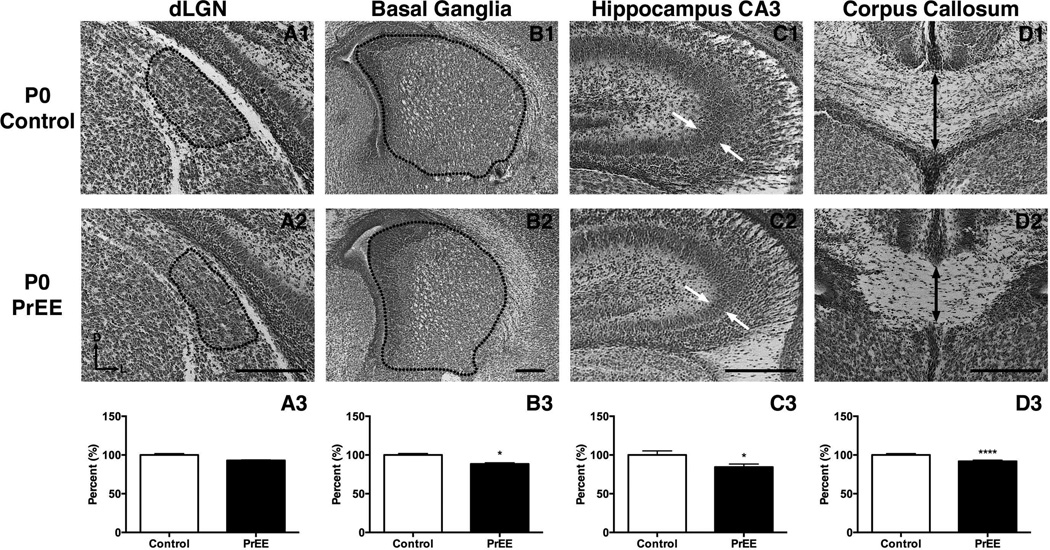
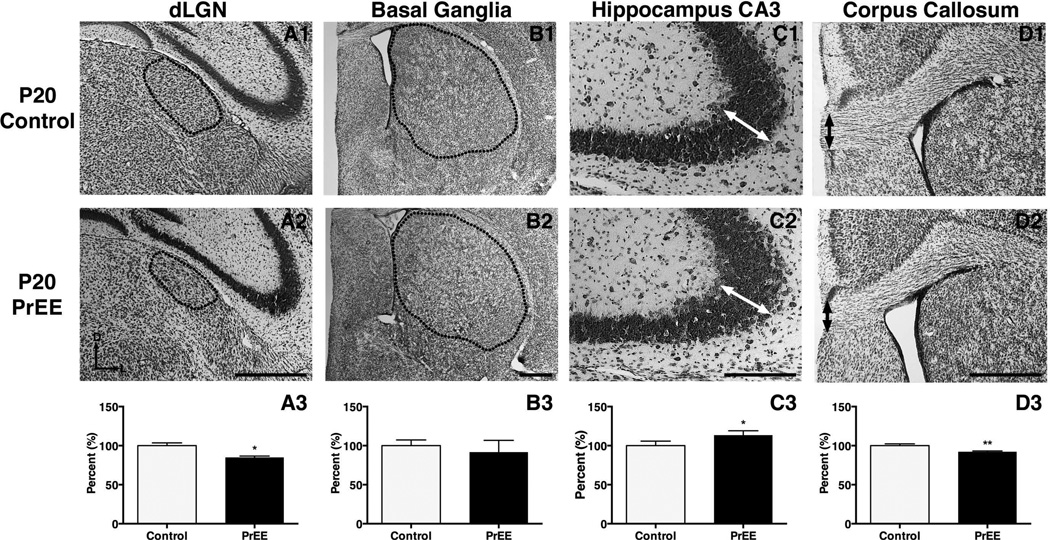
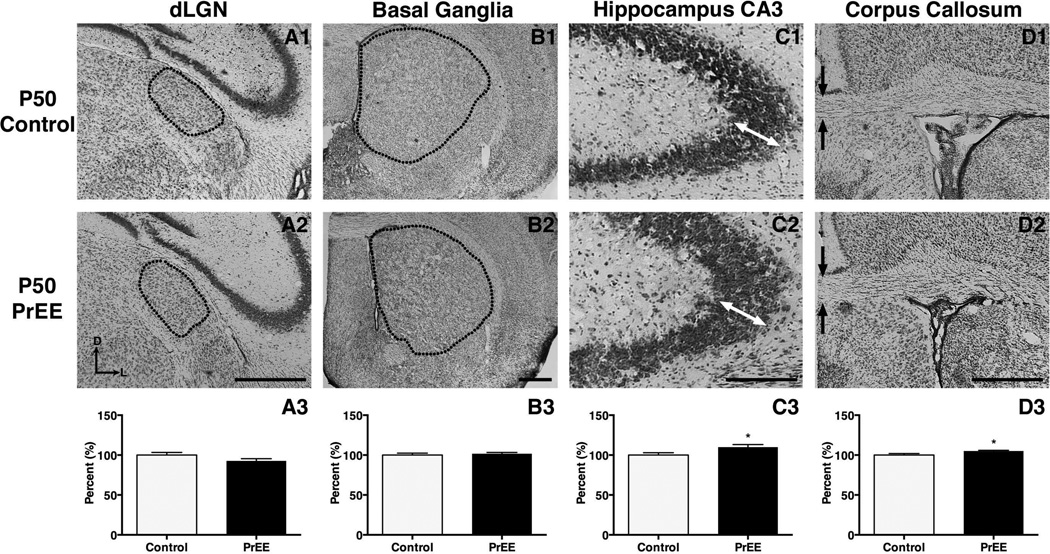
Methods: Here, we utilize a mouse model of FASD to examine effects of prenatal EtOH exposure (PrEE), on brain anatomy in newborn (postnatal day [P]0), weanling (P20), and early adult (P50) mice. We correlate abnormal cortical and subcortical anatomy with atypical behavior in adult P50 PrEE mice. In this model, experimental dams self-administered a 25% EtOH solution throughout gestation (gestational days 0 to 19, day of birth), generating the exposure to the offspring.

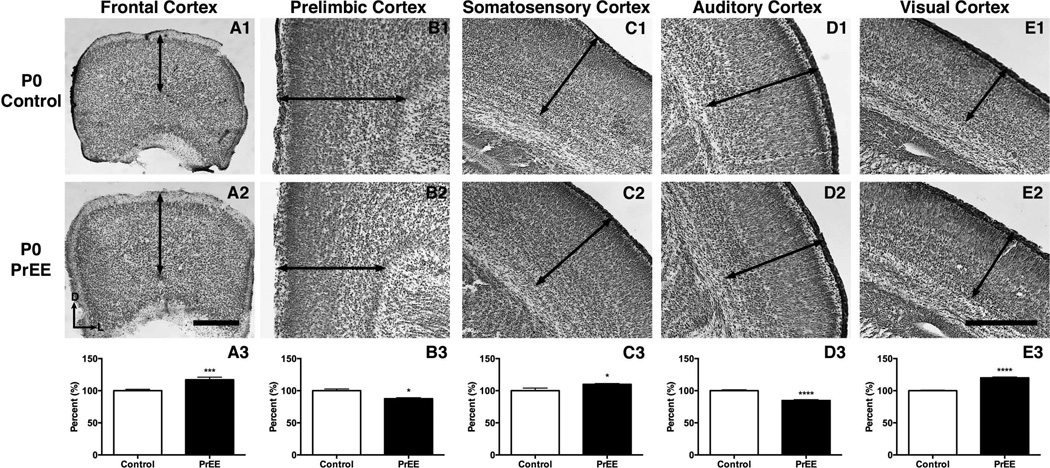
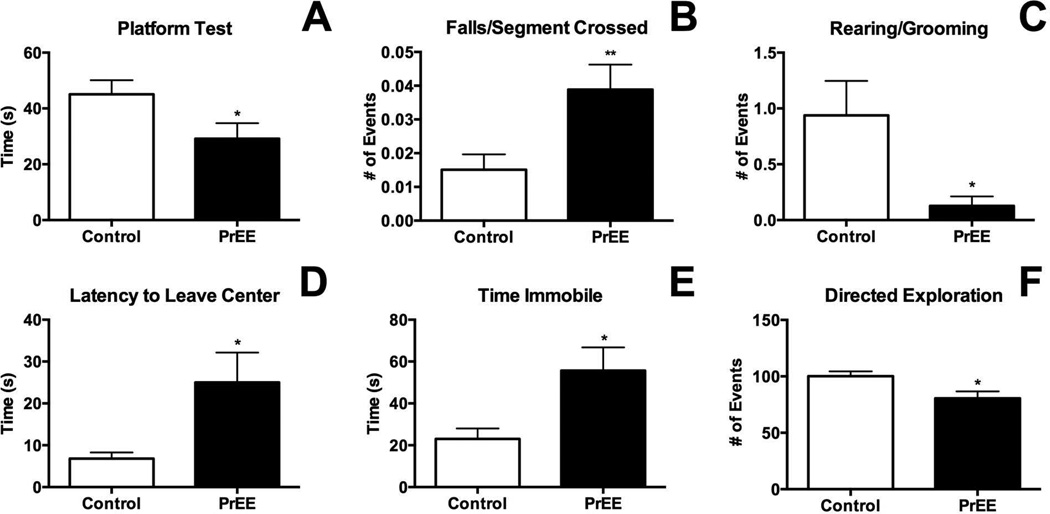
Results: Results from these experiments reveal long-term alterations to cortical anatomy, including atypical developmental cortical thinning, and abnormal subcortical development as a result of in utero EtOH exposure. Furthermore, offspring exposed to EtOH during the prenatal period performed poorly on behavioral tasks measuring sensorimotor integration and anxiety.

Conclusions: Insight from this study will help provide new information on developmental trajectories of PrEE and the biological etiologies of abnormal behavior in people diagnosed with FASD.

Keywords: Anatomy; Brain Development; Fetal Alcohol Spectrum Disorders; Neocortex; Prenatal Alcohol Exposure.


Figures

Figure 1
Figure 1. Measurements in ethanol (EtOH)-exposed and control dams
A, No significant differences were detected in average dam food intake. (EtOH-exposed, N=24; control, N=26). B, EtOH-exposed dams (N=12) gained significantly less weight during gestation when compared with controls (N=14; * p< 0.05). C, Gestational exposure to EtOH resulted in significantly reduced litter size in experimental cases (N=11) when compared with controls (N=10; * p<0.05). D, No significant difference was detected in average dam liquid intake (EtOH-exposed, N=24; control, N=26). E, No significant difference was detected in average dam plasma osmolality (EtOH-exposed, N=15; control, N=15). F, EtOH-exposed dams (GD9 N=11, GD19 N=12) had elevated BEC levels compared to untreated controls (GD9 N=5, GD19 N=7; * **p<0.001, * ***p<0.0001).
Figure 2
Figure 2. Body and brain weight measures
A, Average body weight was significantly reduced in PrEE animals at all timepoints (P0, Control: n=20, PrEE: n=20, p<0.001; P20, Control: n=17, PrEE: n=17 p<0.0001; P50, Control: n=17, PrEE: n=17, p<0.0001). B, A significant reduction in average brain weight was observed in PrEE mice at all timepoints (P0, Control: n=20, PrEE: n=20, p<0.0001; P20, Control: n=17, PrEE: n=17, p<0.01; P50, Control: n=17, PrEE: n = 17, p<0.0001). C, Brain/body weight ratios were not significantly altered between treatments at any age.
Figure 3
Figure 3. Brain size at P0, P20 and P50
Dorsal images of control and PrEE mice brains. PrEE brains are reduced in size when compared to age-matched controls. Scale bar = 2 mm.
Figure 4
Figure 4. Cortical thickness measures in P0 PrEE and control mice
Coronal sections in control (top row) and PrEE mice (middle row). Arrows indicate area of measure. A significant reduction was detected in prelimbic (B3; p<0.05) and auditory cortices (D3; p<0.0001). PrEE mice exhibited significantly thicker dorsal frontal (A3; p<0.001), somatosensory (C3; p<0.05) and visual cortices (E; p<0.0001). Data is expressed as mean percent of control ± S.E.M. Dorsal (D) up, lateral (L) to the right. Scale bars = 500 µM. Control: n=15, PrEE: n=15.
Figure 5
Figure 5. Cortical thickness measures in P20 PrEE and control mice
Coronal sections of representative control (top row) and PrEE (middle row) tissue. Arrows indicate area of measure. PrEE mice exhibited significantly thicker frontal (A3; p<0.01), prelimbic (B3; p<0.05), somatosensory (C3; p<0.01) and auditory cortices (D3; p<0.05). No significant variation was detected in visual cortex of PrEE animals (E3; P = 0.19). Data is expressed as mean percent of control ± S.E.M. Dorsal (D) up, lateral (L) to the right. Scale bar = 500 µM. Control: n=12, PrEE: n=12.
Figure 6
Figure 6. Cortical thickness measures in P50 PrEE and control mice
Coronal view of representative sections in P50 control (top row) and PrEE mice (middle row). Arrows indicate area of measure. Significant thinning of PrEE cortical tissue was found in prelimbic (B3; p<0.001), somatosensory (C3; P<0.05) and auditory cortices (D3; p<0.05). Significant variation was found in frontal (A3; p<0.05), but not visual cortices (E3; p = 0.13) of PrEE animals. Data is expressed as mean percent of baseline corrected control ± S.E.M. Dorsal (D) up, lateral (L) to the right. Scale bar = 500 µM. Control: n=12, PrEE: n=12
Figure 7
Figure 7. Anatomical volume and thickness measures in P0 PrEE and control mice
Representative coronal sections in control (top row) and PrEE mice (middle row). Outlines and arrows indicate area of measure. No significant difference was detected in dLGN (A3; p = 0.65). Significant reductions were detected across all other regions investigated:, basal ganglia (B3; p<0.05), CA3 pyramidal layer thickness (C3; p<0.05) and corpus callosum (D3; p<0.0001). Data is expressed as mean percent of baseline corrected control ± S.E.M. Dorsal (D) up, lateral (L) to the right. Scale bars = 500 µM. Control: n=8, PrEE: n=8
Figure 8
Figure 8. Anatomical volume and thickness measures in P20 PrEE and control mice
Representative coronal sections in control (top row) and PrEE mice (middle row). Outlines and arrows indicate area of measure. Significant reductions were detected in dLGN (A3; p<0.05) and corpus callosum (D3; p<0.01). CA3 pyramidal layer thickness was significantly increased in PrEE animals (C3; p<0.05). PrEE basal ganglia (B3; p = 0.11) did not differ significantly from that of controls. Data is expressed as mean percent of baseline corrected control ± S.E.M. Dorsal (D) up, lateral (L) to the right. Scale bar = 500 µM. Control: n=8, PrEE: n=8.
Figure 9
Figure 9. Anatomical volume and thickness measures in P50 PrEE and control mice
Representative coronal sections in P50 control (top row) and PrEE mice (middle row). Outlines and arrows indicate area of measure. No significant variance was detected in dLGN (A3; p = 0.09) or basal ganglia (B3; p = 0.54). Pyramidal layer thickness increased within CA3 of PrEE animals (C3; p<0.05). A significant increase of callosal thickness was detected at the midline of PrEE corpus callosum (D3; p<0.05). Data is expressed as mean percent control ± S.E.M. Dorsal (D) up, lateral (L) to the right. Scale bar = 500 µM. Control: n=8, PrEE: n=8.
Figure 10
Figure 10. Behavioral measures in young adult mice
In the platform test (A) PrEE mice exhibited a significant reduction in balance compared to control (p<0.05). In the Suok test PrEE animals fell significantly more for each segment crossed, a measure of sensorimotor integration (B; p<0.01). Anxiety-like behaviors including rearing/cephalo-caudal grooming (C), latency to leave central zone (D), time spent immobile (E) and directed exploration all indicated increased anxiety in PrEE mice (p<0.05). Control: n=16, PrEE: n=17.

Comment in

References

    1. Archibald SL, Fennema-Notestine C, Gamst A, Riley EP, Mattson SN, Jernigan TL. Brain dysmorphology in individuals with severe prenatal alcohol exposure. Dev Med Child Neurol. 2001;43:148–154. - PubMed
    1. Bauer-Moffett C, Altman J. The effect of ethanol chronically administered to preweanling rats on cerebellar development: A morphological study. Brain Res. 1977;119(2):249–268. - PubMed
    1. Bookstein FL, Connor PD, Huggins JE, Barr HM, Pimentel KD, Streissguth AP. Many infants prenatally exposed to high levels of alcohol show one particular anomaly of the corpus callosum. Alcohol Clin Exp Res. 2007;31:868–879. - PubMed
    1. Bookstein FL, Sampson PD, Connor PD, Streissguth AP. Midline corpus callosum is a neuroanatomical focus of fetal alcohol damage. Anat Rec Part B New Anat. 2002;269:162–174. - PubMed
    1. Cao W, Li W, Han H, O’Leary-Moore SK, Sulik KK, Allan Johnson G, Liu C. Prenatal alcohol exposure reduces magnetic susceptibility contrast and anisotropy in the white matter of mouse brains. Neuroimage. 2014;102:748–755. - PMC - PubMed

MeSH terms