. 2016 Feb;19(2):335-46.
doi: 10.1038/nn.4216. Epub 2016 Jan 4.

Adult mouse cortical cell taxonomy revealed by single cell transcriptomics

Affiliations

Adult mouse cortical cell taxonomy revealed by single cell transcriptomics

Bosiljka Tasic et al. Nat Neurosci. 2016 Feb.

Abstract

Nervous systems are composed of various cell types, but the extent of cell type diversity is poorly understood. We constructed a cellular taxonomy of one cortical region, primary visual cortex, in adult mice on the basis of single-cell RNA sequencing. We identified 49 transcriptomic cell types, including 23 GABAergic, 19 glutamatergic and 7 non-neuronal types. We also analyzed cell type-specific mRNA processing and characterized genetic access to these transcriptomic types by many transgenic Cre lines. Finally, we found that some of our transcriptomic cell types displayed specific and differential electrophysiological and axon projection properties, thereby confirming that the single-cell transcriptomic signatures can be associated with specific cellular properties.


Figures
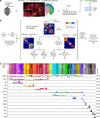
Figure 1
Figure 1. Workflow overview
(a) Experimental workflow starts with the isolation, sectioning and micro-dissection of the primary visual cortex from a transgenic mouse. The tissue samples are converted into a single-cell suspension, single cells are isolated by FACS, poly(A)-RNA from each cell is reverse transcribed (RT), cDNA is amplified and fragmented, and sequenced on a next-generation sequencing (NGS) platform. (b) Analysis workflow starts with the definition of high variance genes and iterative clustering based on two different methods, PCA (shown here) and WGCNA, and cluster membership validation using a random forest classifier. Cells that are classified consistently into one cluster are called ‘core’ cells (N = 1424), while cells that are mapped to more than one cluster are labeled ‘intermediate cells’ (N = 255). After the termination criteria are met, clusters from the two methods are intersected, and iteratively validated until all core clusters contain at least 4 cells. (Supplementary Fig. 3, Methods). (c) The final 49 clusters were assigned an identity based on cell location (Fig. 2) and marker genes (Fig. 3). Each type is represented by a color bar with the name and number of core cells representing that type. The violin plots represent distribution of mRNA expression on a linear scale, adjusted for each gene (max. RPKM on the right), for major known marker genes: Snap25 (pan-neuronal); Gad1 (pan-GABAergic); Vip, Sst and Pvalb (GABAergic); Slc17a7 (pan-glutamatergic); Rorb (mostly L4 and L5a); Foxp2 (L6); Aqp4 (astrocytes); Pdgfra (oligodendrocyte precursor cells, OPCs); Mog (oligodendrocytes); Itgam (microglia); Flt1 (endothelial cells) and Bgn (smooth muscle cells, SMC).
Figure 2
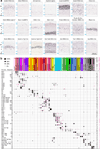
Figure 2. Cell types: Genetic access and laminar distribution
(a) Characterization of Cre lines by RNA ISH detection of tdT mRNA from the Ai14 transgene. Representative images of VISp were obtained from the Allen Connectivity Atlas, Transgenic Characterization. Sections are coronal except when indicated by asterisks (sagittal); images are representative of at least two brain-wide experiments, except for Scnn1a-Tg3-Cre, which is represented by one experiment (average of ~2.9 experiments per Cre line). Transgenic characterization data for Pvalb-2A-FlpO;Gad2-IRES-Cre;Ai65 and Nkx2.1-CreERT2;Ai14 (corresponding to our induction criteria, Methods) are not available. Scale bar in the last panel applies to all. (b) Cre line specificity characterized by transcriptomic cell types (N = 1424 core cells, 255 intermediate cells). The size of each black disk represents the proportion of cells classified as core in each transcriptomic type isolated from a particular Cre line and microdissection combination (rows). Pink disks correspond to the proportion of cells that were classified as intermediate. “Upper” dissection corresponds to layers 1–4, and “lower” to layers 5–6 of VISp. The number of cells from each Cre line and microdissection combination for core cells (black) and intermediate cells (pink) is indicated on the right; the number of core cells for each core type is indicated on top. Note that the relative proportions of cell types obtained in these experiments are not representative of the ones in the intact brain because of the targeted sampling approach using Cre lines and possible cell type-specific differences in survival during the isolation procedure. Cell numbers and percentages represented in (b) are available in Supplementary Table 4.
Figure 3
Figure 3. Cortical cell types and corresponding marker genes
(a–c) Gene expression (rows) in individual cells (columns) arranged according to the cell type (top bar) and grouped according to major classes: GABAergic neurons (a), glutamatergic neurons (b), and non-neuronal cells (c). The scale is linear and adjusted to the maximum for each gene within each panel (max. RPKM on the right). Only core cells are represented (N = 1424); for numbers of core cells per type see Fig. 2b, top. Tacr1 encodes neurokinin-1 receptor or substance P receptor; 96*Rik is 9630013A20Rik. Unique marker genes are in red.
Figure 4
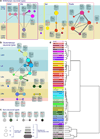
Figure 4. Cell types summary and relationships
(a–c) Constellation diagrams showing core and intermediate cells for all cell types. Core cells (N = 1424 total, 664 GABAergic, 609 glutamatergic, 151 non-neuronal) are represented by colored discs with area corresponding to the number of core cells for each cluster. Linked tags include cell type names based on marker genes/layers; unique markers are in pink. Intermediate cells (N = 255 total, 97 GABAergic, 155 glutamatergic, 3 non-neuronal) are represented by lines connecting discs; line thickness corresponds to the number of such cells. (a) GABAergic neuron types are grouped according to major classes and arranged by their preferential location (enrichment) in upper vs. lower cortical layers. Up/down arrows within discs represent statistically significant enrichment determined by layer-enriching dissections (Supplementary Table 5). Locations for other clusters are estimates that combine marker gene expression or Cre line expression based on ISH. The position at the border of upper and lower layers represents lack of evidence for location preference. (b) Glutamatergic types are arranged according to cortical layer. (c) Non-neuronal types share few intermediate cells among one another. 96*Rik, 9630013A20Rik. (d) Dendrogram depicting relatedness of the mean gene expression pattern for all cell types based on core cells (N = 1424) and genes (N = 13,878) with standard deviation for expression > 1 across all types. The distance metric is Pearson’s correlation coefficient over the genes in the log10(RPKM+1) space. The tree was generated by standard hierarchical clustering with average linkage.
Figure 5
Figure 5. Cell-type specific mRNA processing
(a) Heat map showing the number of differentially processed exons (N = 567 out of 256,430 examined) for each pairwise comparison of transcriptomic cell types (Methods). (b–e) Confirmation of differential exon processing for four gene examples from (a) using MISO (Methods). Schematic of each gene (top) and corresponding quantitation (bottom).The MISO score (Ψ), or “percent spliced-in”, represents the relative exon usage of transcript variant b vs. a, for each gene in each cell type. The significance in pairwise comparisons for all cell types for each alternatively processed exon was measured by the Bayes factor (Bf); Bf > 100 is considered significant. Bf for each alternatively processed mRNA is presented as the heat map to the right; yellow represents strongest statistical significance of Bf = 1012. (b) In agreement with a population-level transcriptome profiling study, pyruvate kinase (Pkm) mRNAs display differential exon usage among neurons and non-neuronal cells. (c) Syntaxin binding protein 1 (Stxbp1) mRNAs show differential processing among broad neuronal types, but also specific Vip types. (d,e) mRNAs for AMPA receptor genes, Gria1 and Gria2, both display mutually exclusively spliced “flip” and “flop” exons. The two Gria genes show similar alternative exon usage within same cell types, suggesting a shared mechanism for alternative splicing. For simplicity, all genes are shown in the same orientation.
Figure 6
Figure 6. Transcriptomic signatures and axonal projections
(a) Schematic of experimental approach shows that canine adenovirus expressing Cre recombinase (CAVCre) was injected into two different VISp projection areas in Ai14 mice: ipsilateral visual thalamus (LGd/LP) or contralateral visual cortex (VISp). TdT+ single cells were isolated from VISp by microdissection and FACS. Examples of fresh brain slices from injected animals are presented below. Inj, injection site; IT, injection tract; D, microdissected tissue used for preparation of single cell suspension and FACS. Single cell transcriptomes were obtained and use to classify the corresponding cells by the random forest approach (Methods) to our previously determined transcriptomic cell types. (b) Heatmap panels show gene expression in individual projection-labeled cells classified into one of 9 (out of 49) previously determined transcriptomic types. Median gene expression in each type is shown to the left of each heatmap panel. Black dots indicate cells that are classified as intermediate, but are primarily associated with the indicated cell types. The asterisk indicates an unexpected L2/3-Ptgs2 cell, which may have been labeled through the virus injection tract (IT). Note that these projection-labeled cells were not used in the original classification scheme to identify transcriptomic cell types. The number of cells obtained for each type is labeled on top. Total cells: n = 43 for two thalamus injection experiments; n = 5 for one contralateral VISp injection experiment.
Figure 7
Figure 7. Ndnf interneurons: genetic access and physiological properties
(a) Violin plot for Ndnf mRNA expression in cell types containing one or more cells with Ndnf RPKM ≥ 1. (b) Characterization of the Ndnf-IRES2-dgCre;Ai14 transgenic mouse by RNA ISH detection of tdT mRNA in VISp. Inset focuses on upper layers. The image is from a representative section from one brain-wide experiment. (c) Same as (b), but showing tdT protein fluorescence. (d) The endothelial cells can be avoided if pan-neuronal Cre reporter (Snap25-LSL-2A-GFP) is used instead of Ai14 (Methods). Insets: putative neurogliaform cells. The images in (c) and (d) are each representative of two independent experiments. (e) Intrinsic properties of tdT+ neurons in L1 of VISp in Ndnf-IRES2-dgCre;Ai14. Sub- (red) and supra- (black) threshold responses to a 3-s square-pulse current injection of representative LS neuron (left) and NLS neuron (right). Top left inset: magnified view of the subthreshold depolarizing ramp. Bottom left: With larger current injection, the same LS neuron spikes earlier. Top right inset: magnified view of subthreshold initial response sag. The same neuron (bottom right) displays additional late spiking in response to a larger current pulse. (f) Resting membrane potential, input resistance, sag and ramp slope for cells in (e) represented as averages ± SEM. LS neurons display significantly less sag (p = 4.31×10⁻⁴, Mann-Whitney test with 16 degrees of freedom), and significantly steeper depolarizing ramp than NLS neurons (p = 6.52×10⁻³, Mann-Whitney test with 16 degrees of freedom). (g) Recording of electrically coupled tdT+ cells. Hyperpolarizing current injection (top) into either tdT+ cell was transmitted to the other cell (bottom). 77% of cells were electrically coupled at an average intersomatic distance of 110 ± 11 µm and mean junctional conductance of 181 ± 41 pS, n = 14. Errors represent SEM. (h) Recording of a synaptically connected pair of tdT+ cells. Action potential (middle, truncated) induced by a brief (3 ms) current injection (top) caused IPSPs in both neurons that were blocked by SR 95531 (5 µM). IPSP mean 10–90% rise time = 7.4 ± 0.5 ms; IPSP mean tau decay = 35.3 ± 7.6 ms, n = 12. Errors represent SEM. (i) 3-D reconstructions of two biocytin-filled tdT+ neurons (LS on the left, and NLS on the right) with cell bodies at the border between L1 and L2/3. Axons are red, dendrites and soma are blue. Scale bar, 50 µm. Insets: magnified views of bouton-like structures from original images. Morphological reconstruction of additional cells would be needed to assess if the ones presented here on the left and right are generally representative of the LS or NLS spiking cells, respectively.

Comment in

References

    1. Lein ES, et al. Genome-wide atlas of gene expression in the adult mouse brain. Nature. 2007;445:168–176. - PubMed
    1. Hawrylycz MJ, et al. An anatomically comprehensive atlas of the adult human brain transcriptome. Nature. 2012;489:391–399. - PMC - PubMed
    1. Harris KD, Shepherd GM. The neocortical circuit: themes and variations. Nature neuroscience. 2015;18:170–181. - PMC - PubMed
    1. DeFelipe J, et al. New insights into the classification and nomenclature of cortical GABAergic interneurons. Nature reviews. Neuroscience. 2013;14:202–216. - PMC - PubMed
    1. Sugino K, et al. Molecular taxonomy of major neuronal classes in the adult mouse forebrain. Nature neuroscience. 2006;9:99–107. - PubMed

Additional references

    1. Raymond CS, Soriano P. High-efficiency FLP and PhiC31 site-specific recombination in mammalian cells. PloS one. 2007;2:e162. - PMC - PubMed
    1. Rossi J, et al. Melanocortin-4 receptors expressed by cholinergic neurons regulate energy balance and glucose homeostasis. Cell metabolism. 2011;13:195–204. - PMC - PubMed
    1. Gerfen CR, Paletzki R, Heintz N. GENSAT BAC cre-recombinase driver lines to study the functional organization of cerebral cortical and basal ganglia circuits. Neuron. 2013;80:1368–1383. - PMC - PubMed
    1. Franco SJ, et al. Fate-restricted neural progenitors in the mammalian cerebral cortex. Science. 2012;337:746–749. - PMC - PubMed
    1. Dhillon H, et al. Leptin directly activates SF1 neurons in the VMH, and this action by leptin is required for normal body-weight homeostasis. Neuron. 2006;49:191–203. - PubMed

Publication types