. 2016 Feb;48(2):195-200.
doi: 10.1038/ng.3479. Epub 2016 Jan 4.

Quantifying influenza virus diversity and transmission in humans

Affiliations

Quantifying influenza virus diversity and transmission in humans

Leo L M Poon et al. Nat Genet. 2016 Feb.

Abstract

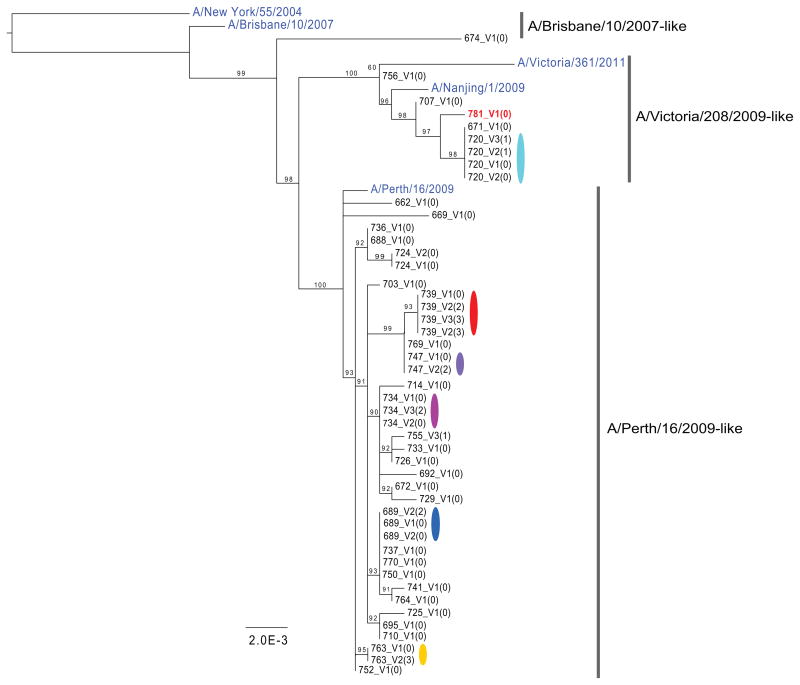
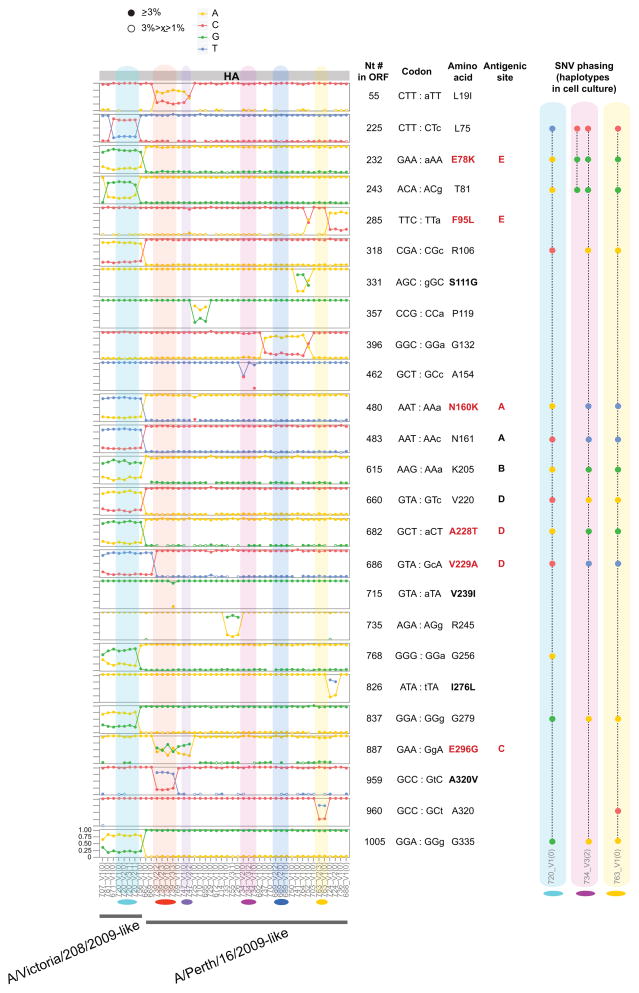
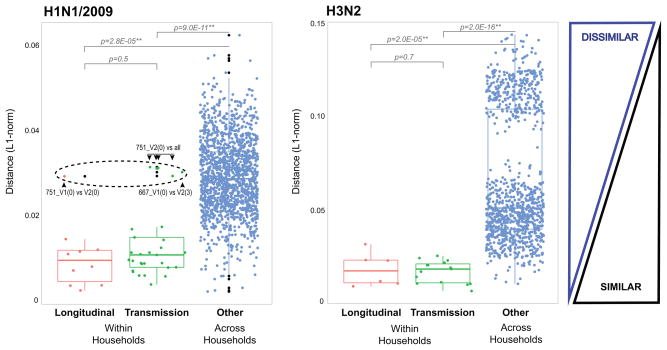
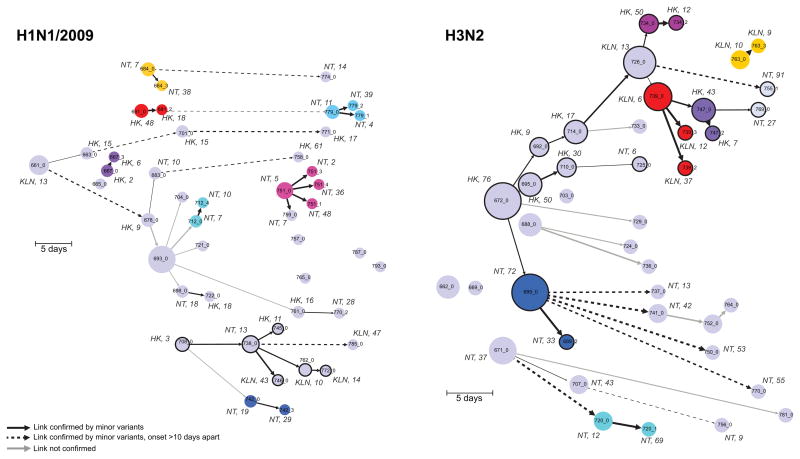
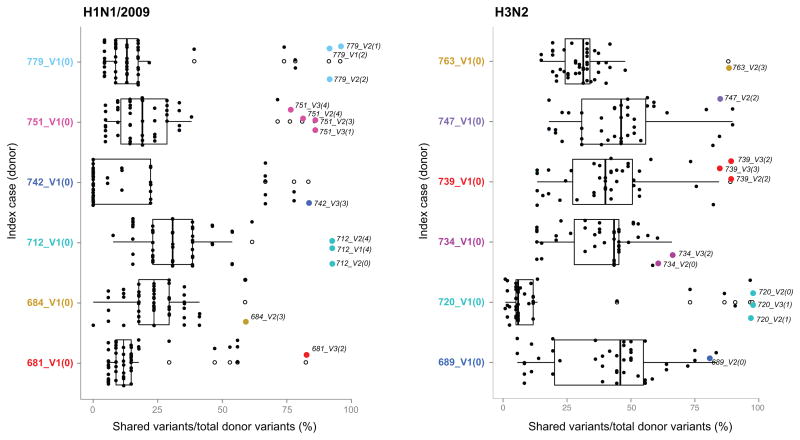
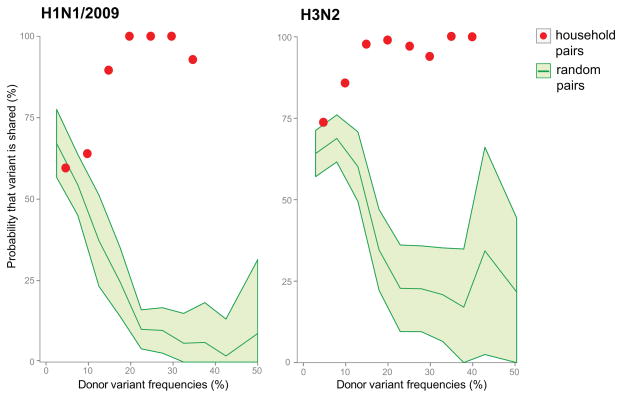
Influenza A virus is characterized by high genetic diversity. However, most of what is known about influenza evolution has come from consensus sequences sampled at the epidemiological scale that only represent the dominant virus lineage within each infected host. Less is known about the extent of within-host virus diversity and what proportion of this diversity is transmitted between individuals. To characterize virus variants that achieve sustainable transmission in new hosts, we examined within-host virus genetic diversity in household donor-recipient pairs from the first wave of the 2009 H1N1 pandemic when seasonal H3N2 was co-circulating. Although the same variants were found in multiple members of the community, the relative frequencies of variants fluctuated, with patterns of genetic variation more similar within than between households. We estimated the effective population size of influenza A virus across donor-recipient pairs to be approximately 100-200 contributing members, which enabled the transmission of multiple lineages, including antigenic variants.


Conflict of interest statement

Competing financial interests:

Authors have no competing financial interests.

Figures

Figure 1
Figure 1. Maximum likelihood phylogenies of concatenated coding regions for H3N2
M1/M2 and NS1/NS2 genes were represented as one segment for each covering the sequence between the first ATG to the last stop codon. Bootstrap support values are shown as percentages on nodes. Values below 50% were treated as equivocal and not shown. Public sequences downloaded from GenBank for use as out groups, or included within the diversity of the samples, are colored in blue. One patient, 781_V1(0), was infected with H1N1/2009 clade 7 after having been diagnosed with H3N2 strain A/Victoria/208/2009-like. Only the HA and NA from the H1N1/2009 could be unambiguously assembled from this individual (accession CY115455 and CY115458), while a whole genome was assembled for the H3N2.
Figure 2
Figure 2. Comparison of HA minor variant frequencies across households
Only polymorphic sites located in the HA1 domain are represented. Amino acid positions were numbered according to the first methionine (start codon) of the protein (and not according to the HA1 numbering schema). Site information for all segments is available in Supplementary Fig. 3. The x axis lists samples by position on the phylogenetic trees in Fig. 1; households with more than one member are colored. The y axis displays nucleotide frequencies with graph lines corresponding to 0, 25%, 75% and 100% frequency. ORF= open reading frame; Antigenic site= previously identified as corresponding to antigenic sites. Text in red highlights non-synonymous mutations located in antigenic sites. Closed circles represent minor variants found at a frequency 3% and higher, while open circles correspond to frequencies equal or higher than 1%, but below 3%. Boxes show how minor variant nucleotides are phased on the same molecules, representing haplotypes. These were determined from single molecule sequencing of cell culture viruses for 3 household pairs: 720_V1(0)/720_V2(1) (Supplementary Table 6), 734_V1(0)/734_V3(2) (Supplementary Table 7), 763_V1(0)/763_V2(3) (Supplementary Table 8).
Figure 3
Figure 3. Box-plots of L1-norm pairwise genetic distance within and across households
We used the L1-norm values obtained from the variant nucleotide analysis across all genes to compare overall genetic distance of longitudinal pairs and transmission pairs to every other possible sample pair combination. Each dot on the figure represents the genetic distance between a unique pair. The longitudinal pairs are represented by 16 individuals in 12 households who have been sampled at two different time points, 2–3 days apart. The transmission pairs are from 13 households where at least 2 members have been sampled; there is a total of 22 predicted donor and recipient pairs within households, and 22 more when including more than one time point per individual. The boxplots show the median of the distances; the bottom and top of each box represent the first and third quartiles. The lengths of the whiskers extend to 1.5 times the interquartile range. Outliers are marked by black dots. The dashed black circle in the H1N1/2009 plot marks the outliers. One of the H1N1/2009 pairs—household 751, index case (0), visit 1 and visit 2: 751_V1(0) and 751_V2(0)—had a pairwise genetic distance that was above the expected threshold (H1N1/2009, Longitudinal). When each of these was then used in within household pairwise comparisons (H1N1/2009, Transmission), the visit 2 sample appeared clearly as an outlier. The pairwise genetic distance between the index case in household 667 (667_V1(0)) and its other household member (667_V2(3)) also appeared as an outlier pair.
Figure 4
Figure 4. Reconstruction of potential transmission pathways of H1N1/2009 and H3N2 outbreaks
Transmission networks are inferred from the consensus whole genome sequences and date of onset. Each sample is a node on the graph and the directed edges indicate putative ancestries and transmissions. Time is represented on the x axis and shows the number of days since the first date of onset. A unique color is assigned to households with more than one member sampled. The size of the node is determined by the number of out degrees. A dashed line indicates a putative transmission link greater than 10 days. The weight of an edge is inversely proportional to the number of nucleotide differences between two samples (i.e. the thicker the edge, the smaller the number of differences). Nucleotide differences were separated into quartiles. H1N1/2009: 0–2 nt; 3–6 nt; 7–15 nt; 16–28 nt. H3N2: 0–5 nt; 6–9 nt; 10–19 nt; 20–45 nt. The links were confirmed by the genetic distances (L1-norm) and normalized for the edge weights. Circles with thick black edges are nodes within a chain of transmission with more than 2 individuals. Locality and age of the patient is indicated for a number of the nodes. HK: Hong Kong; NT: New Territories; KLN: Kowloon.
Figure 5
Figure 5. Box-plots comparing shared variant frequencies within and across households
We compared shared variant frequencies between samples from index cases and their household members (colored dots) or with any other sample (black dots). White boxes indicate interquartile ranges and white dots indicate outliers. Household members tend to share most of the variants found in the index case. Each H1N1/2009 household index case is compared to 54 other samples; each H3N2 household index case is compared to 46 other samples.
Figure 6
Figure 6. Probability of variant transmission as a function of relative frequency of the minor variants
Variants that were only detected in the donor and those that were shared between donor and recipient samples were used in determining the probability of transmission. “Household pairs” (red dots) are comparisons between members of the same household. Each point is the proportion of shared variants over the total number of variants found in a window size of 10%. “Random pairs” (green shaded area) are 30 random donor/recipient pairs resampled 100 times to get a standard deviation estimate.

Comment in

References

    1. Bush RM, Fitch WM, Bender CA, Cox NJ. Positive selection on the H3 hemagglutinin gene of human influenza virus A. Mol Biol Evol. 1999;16:1457–65. - PubMed
    1. Drake JW. Rates of spontaneous mutation among RNA viruses. Proc Natl Acad Sci U S A. 1993;90:4171–5. - PMC - PubMed
    1. Drake JW, Holland JJ. Mutation rates among RNA viruses. Proc Natl Acad Sci U S A. 1999;96:13910–3. - PMC - PubMed
    1. Viboud C, Nelson MI, Tan Y, Holmes EC. Contrasting the epidemiological and evolutionary dynamics of influenza spatial transmission. Philos Trans R Soc Lond B Biol Sci. 2013;368:20120199. - PMC - PubMed
    1. Fordyce SL, et al. Genetic diversity among pandemic 2009 influenza viruses isolated from a transmission chain. Virol J. 2013;10:116. - PMC - PubMed

Publication types