

Pulse Oximeter Plethysmograph Estimate of Pulsus Paradoxus as a Measure of Acute Asthma Exacerbation Severity and Response to Treatment
- PMID: 26727986
- PMCID: PMC6631367
- DOI: 10.1111/acem.12886
Pulse Oximeter Plethysmograph Estimate of Pulsus Paradoxus as a Measure of Acute Asthma Exacerbation Severity and Response to Treatment
Abstract
Objectives: Pulsus paradoxus is one of the few objective bedside measures of acute asthma exacerbation severity but is difficult to measure in tachypneic and tachycardic patients and in noisy clinical environments. Our primary objective was to examine whether pulse oximeter plethysmograph estimate of pulsus paradoxus (PEP) is associated with physiologic and symptom measures of acute exacerbation severity (airway resistance by impulse oscillometry [%IOS] and the Acute Asthma Intensity Research Score [AAIRS]). Secondary objectives were to validate the previous association of PEP with percent predicted forced expiratory volume in 1 second (%FEV1 ) and to examine associations of change of PEP with change of these outcomes after 2 hours of treatment.
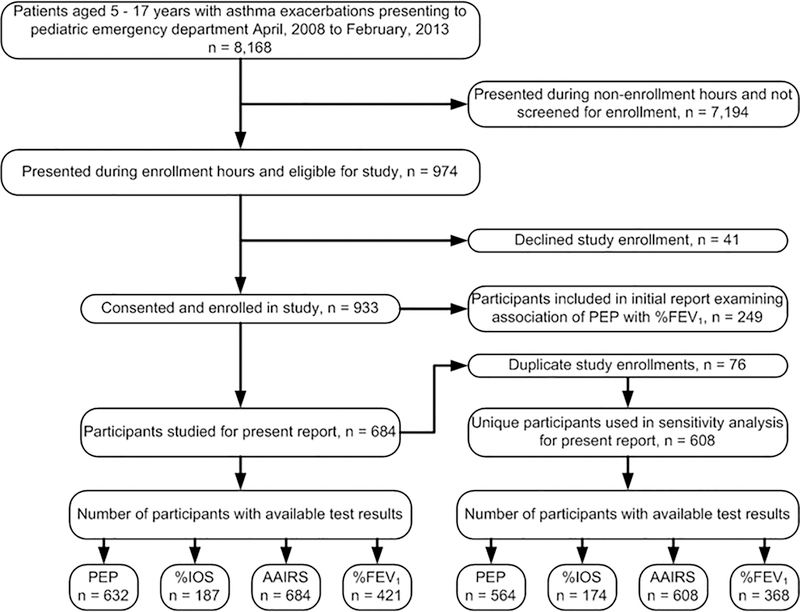
Methods: This was a secondary analysis of data from a prospective observational study of patients aged 5-17 years with acute asthma exacerbations. The predictor variable, PEP, was measured using a dedicated pulse oximeter and waveform analysis program. Outcome measures included the AAIRS, %IOS, and %FEV1 at baseline and after 2 hours of treatment. We examined associations of PEP with %IOS and the AAIRS at baseline using multiple linear regression models adjusted for age, sex, and race. As secondary analyses we similarly examined the association of PEP with %FEV1 at baseline and change of PEP with change of %IOS, the AAIRS, and %FEV1 after 2 hours of treatment using multiple linear regression models adjusted for the baseline value of the outcome measure and the AAIRS.
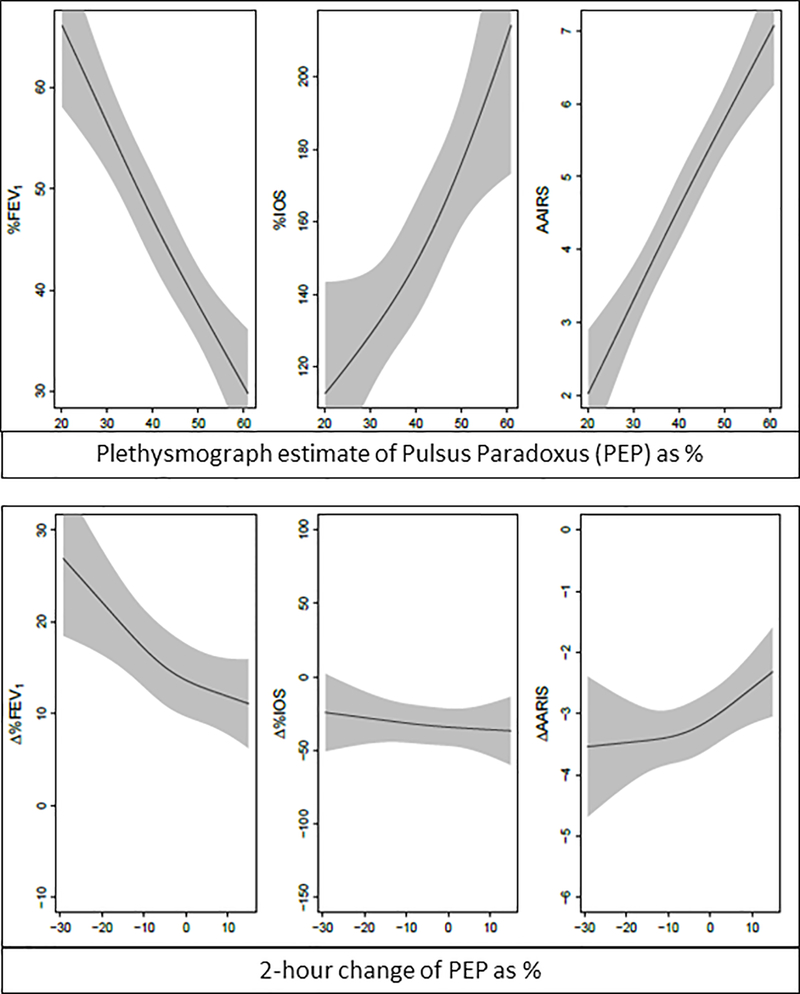
Results: Among 684 participants (61% males; 61% African American) there were associations of baseline PEP with %IOS, the AAIRS, and %FEV1 (p < 0.001). Change of PEP after 2 hours of treatment was associated with change of %FEV1 (p < 0.001) and change of the AAIRS (p = 0.01) but not with change of %IOS (p = 0.60).
Conclusions: PEP demonstrates criterion validity in predicting baseline %IOS, the AAIRS, and %FEV1 , and responsiveness to change of the AAIRS and %FEV1 . Data contained in the oximeter plethysmograph waveform might be utilized as a continuous, objective measure of acute asthma exacerbation severity and real-time response to treatment.
© 2016 by the Society for Academic Emergency Medicine.
Conflict of interest statement
Potential conflict of interest
Dr. Arnold holds a patent (US 6,869,402 B2) related to the method of estimating pulsus paradoxus described in this study; he and Vanderbilt University have potential to benefit financially from this intellectual property. Ms. Wang has no conflicts of interest to disclose. Dr. Hartert has no conflicts of interest to disclose.
Figures
Similar articles
-
Noninvasive assessment of asthma severity using pulse oximeter plethysmograph estimate of pulsus paradoxus physiology.BMC Pulm Med. 2010 Mar 29;10:17. doi: 10.1186/1471-2466-10-17. BMC Pulm Med. 2010. PMID: 20350320 Free PMC article.
-
Noninvasive bedside assessment of acute asthma severity using single-breath counting.Pediatr Emerg Care. 2014 Jan;30(1):8-10. doi: 10.1097/PEC.0000000000000060. Pediatr Emerg Care. 2014. PMID: 24365723
-
Small airway dysfunction as predictor and marker for clinical response to biological therapy in severe eosinophilic asthma: a longitudinal observational study.Respir Res. 2020 Oct 21;21(1):278. doi: 10.1186/s12931-020-01543-5. Respir Res. 2020. PMID: 33087134 Free PMC article.
-
The case for impulse oscillometry in the management of asthma in children and adults.Ann Allergy Asthma Immunol. 2017 Jun;118(6):664-671. doi: 10.1016/j.anai.2017.04.009. Ann Allergy Asthma Immunol. 2017. PMID: 28583260 Free PMC article. Review.
-
Physiologic measures: pulmonary function tests. Asthma outcome.Am J Respir Crit Care Med. 1994 Feb;149(2 Pt 2):S9-18; discussion S19-20. doi: 10.1164/ajrccm/149.2_Pt_2.S9. Am J Respir Crit Care Med. 1994. PMID: 8298772 Review.
References
-
- Mannino DM, Homa DM, Akinbami LJ, Moorman JE, Gwynn C, Redd SC. Surveillance for asthma--United States, 1980–1999. MMWR Surveill Summ 2002;51:1–13. - PubMed
-
- Newacheck PW, Halfon N. Prevalence, impact, and trends in childhood disability due to asthma. Archives of pediatrics & adolescent medicine 2000;154:287–93. - PubMed
-
- Akinbami LJ, Moorman JE, Liu X. Asthma prevalence, health care use, and mortality: United States, 2005–2009. National health statistics reports 2011:1–14. - PubMed
-
- Bloom B, Cohen RA, Freeman G. Summary health statistics for U.S. children: National Health Interview Survey, 2010. Vital and health statistics Series 10, Data from the National Health Survey 2011:1–80. - PubMed
-
- Spiteri MA, Cook DG, Clarke SW. Reliability of eliciting physical signs in examination of the chest. Lancet 1988;1:873–5. - PubMed
Publication types
MeSH terms
Grants and funding
LinkOut - more resources
Full Text Sources
Other Literature Sources
Medical
Research Materials
Miscellaneous
