

Data visualisation in surveillance for injury prevention and control: conceptual bases and case studies
- PMID: 26728006
- PMCID: PMC4833094
- DOI: 10.1136/injuryprev-2015-041812
Data visualisation in surveillance for injury prevention and control: conceptual bases and case studies
Abstract
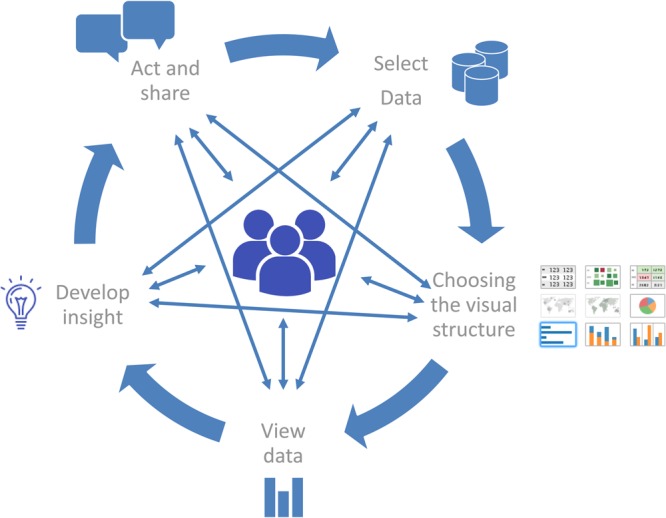
Background: The complexity of current injury-related health issues demands the usage of diverse and massive data sets for comprehensive analyses, and application of novel methods to communicate data effectively to the public health community, decision-makers and the public. Recent advances in information visualisation, availability of new visual analytic methods and tools, and progress on information technology provide an opportunity for shaping the next generation of injury surveillance.
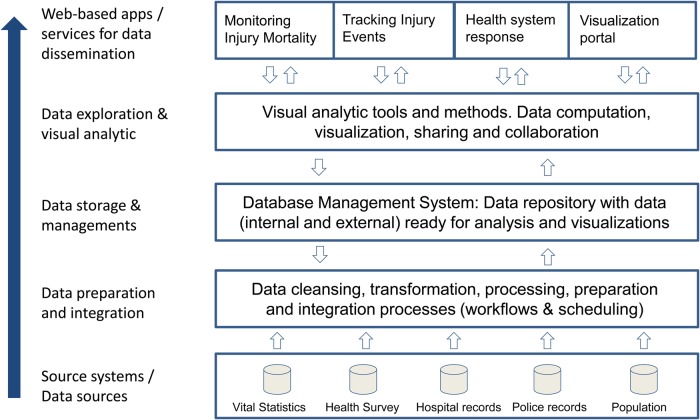
Objective: To introduce data visualisation conceptual bases, and propose a visual analytic and visualisation platform in public health surveillance for injury prevention and control.
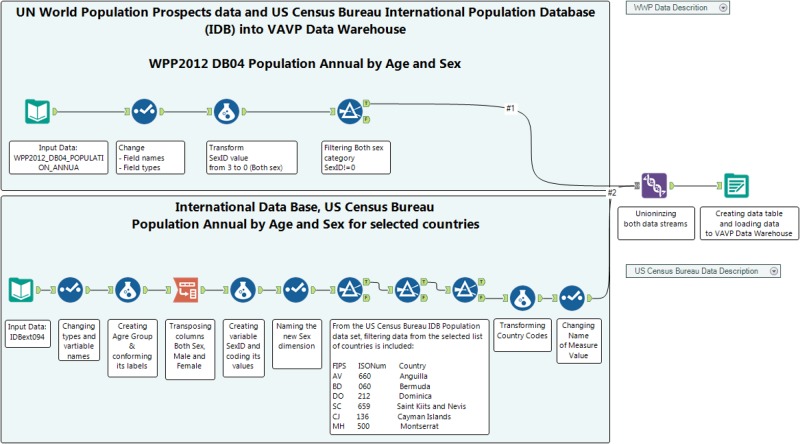
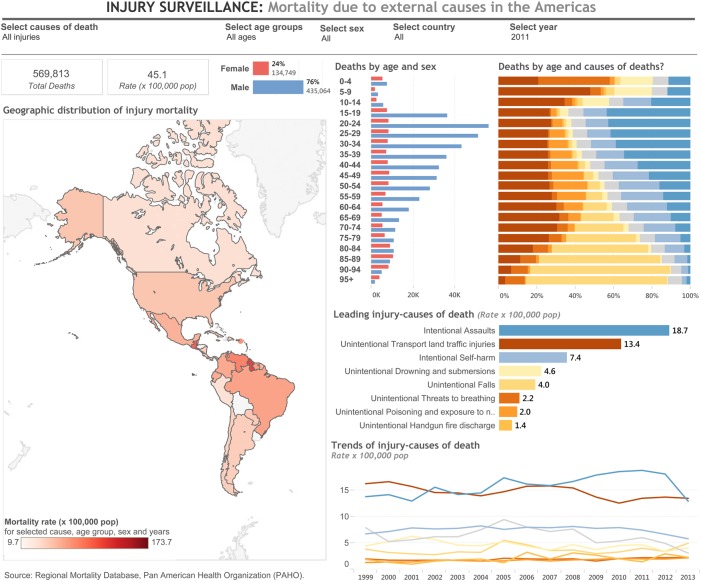
Methods: The paper introduces data visualisation conceptual bases, describes a visual analytic and visualisation platform, and presents two real-world case studies illustrating their application in public health surveillance for injury prevention and control.
Results: Application of visual analytic and visualisation platform is presented as solution for improved access to heterogeneous data sources, enhance data exploration and analysis, communicate data effectively, and support decision-making.
Conclusions: Applications of data visualisation concepts and visual analytic platform could play a key role to shape the next generation of injury surveillance. Visual analytic and visualisation platform could improve data use, the analytic capacity, and ability to effectively communicate findings and key messages. The public health surveillance community is encouraged to identify opportunities to develop and expand its use in injury prevention and control.
Published by the BMJ Publishing Group Limited. For permission to use (where not already granted under a licence) please go to http://www.bmj.com/company/products-services/rights-and-licensing/
Figures
References
-
- WHO. Injury Surveillance Guidelines. 2001. http://www.who.int/violence_injury_prevention/publications/surveillance/... (accessed 8 Jul 2015).
-
- Centers for Disease Control and Prevention. CDC's vision for public health surveillance in the 21st century. Introduction. MMWR Surveill Summ 2012;61(Suppl):1–35. http://stacks.cdc.gov/view/cdc/11940 (accessed 8 Jul 2015). - PubMed
-
- Few S. Data visualization for human perception. In: Soegaard M, Dam RF, eds. The encyclopedia of human-computer interaction. 2nd edn. Aarhus, Denmark: The Interaction Design Foundation, 2014. https://www.interaction-design.org/encyclopedia/data_visualization_for_h... (accessed 8 Jul 2015).
-
- Kzyswinski M, Cairo A. Points of view: storytelling. Nat Methods 2013;10:687 http://www.nature.com/nmeth/journal/v10/n8/full/nmeth.2571.html (accessed 8 Jul 2015). 10.1038/nmeth.2571 - DOI - PubMed
MeSH terms
Grants and funding
LinkOut - more resources
Full Text Sources
Other Literature Sources
Medical