. 2016 Jan 5:6:18109.
doi: 10.1038/srep18109.

How type 1 fimbriae help Escherichia coli to evade extracellular antibiotics

Affiliations

How type 1 fimbriae help Escherichia coli to evade extracellular antibiotics

Ima Avalos Vizcarra et al. Sci Rep. .

Abstract

To survive antibiotics, bacteria use two different strategies: counteracting antibiotic effects by expression of resistance genes or evading their effects e.g. by persisting inside host cells. Since bacterial adhesins provide access to the shielded, intracellular niche and the adhesin type 1 fimbriae increases bacterial survival chances inside macrophages, we asked if fimbriae also influenced survival by antibiotic evasion. Combined gentamicin survival assays, flow cytometry, single cell microscopy and kinetic modeling of dose response curves showed that type 1 fimbriae increased the adhesion and internalization by macrophages. This was caused by strongly decreased off-rates and affected the number of intracellular bacteria but not the macrophage viability and morphology. Fimbriae thus promote antibiotic evasion which is particularly relevant in the context of chronic infections.


Figures

Figure 1
Figure 1. E.coli overexpressing type 1 fimbriae yielded more intracellular survivors in macrophages.
(a) Timeline of the gentamicin assay for the measurement of intracellular survivors. Gentamicin was applied as a 15 minute pulse of 100 μg/ml to kill extracellular bacteria and was then reduced to 10 μg/ml for long term co-cultivation. (b) Fimbriae expression affected the number of viable bacteria extracted from macrophages. A composite image of 3 randomly chosen agar plates is shown from macrophage lysates after incubation with fim↑, wt fim and ∆fim, respectively, using the protocol as sketched in (a). (c) Total colony forming units recovered from gentamicin protection assays 0.5 hours post infection showed increased survivor numbers of fim↑ compared to wt fim and ∆fim bacteria, using the protocol as sketched in (a). RAW macrophages were seeded to 105 cells/cm2 and incubated with the three different E.coli strains, respectively, at a bacteria-to-macrophage ratio of 10:1. Box plot whiskers indicate the S.D. The variance of population means was analyzed using a one way ANOVA. Upper-case letters mark significant differences based on post hoc Tukey and Bonferroni tests. Pairs of samples that have no letter in common have significantly different means at p < 0.01; i.e., samples with the label A are significantly different from samples with the label B. (d) Fold changes of colony forming units, normalized to 0.5 hours post infection, respectively, indicated higher survival chances of fim↑ bacteria compared to wt fim and ∆fim. Error bars are S.D. The variance of population means was analyzed in the same way as in (c). (e) Staining for lysosomal acidification did not yield significant differences in the LysoID Red fluorescence between fim↑ and ∆fim (p = 1). Scale bar is 5 μm. fim↑, fimbriae overexpression strain; wt, fimbriae wild type strain; ∆fim, fimbriae knockout strain; 3-MA, 3-methyladenine; h, hours
Figure 2
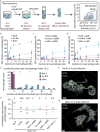
Figure 2. Fimbriae overexpression yielded higher adhesion efficiency, bacterial burden and intracellular survival of E.coli in macrophages.
(a) Timeline of the flow cytometric determination of the bacterial adhesion efficiency to macrophages. (b) Expression of type 1 fimbriae changed the adhesion efficiency of E.coli to macrophages. Macrophages were incubated with E.coli fim↑, wt fim and ∆fim, respectively, at bacteria-to-macrophage ratios from 0.5 to 32. Error bars are S.D. from n = 8 independent experiments. (c) Higher adhesion efficiency depended on functional type 1 fimbriae, as the mannose analogue αMM decreased adhesion of fim↑ but not ∆fim. (d) Treatment of macrophages with LatB yielded less GFP-positive macrophages. (e) The bacterial burden on macrophages was higher for fim↑ compared to ∆fim. Images of 25 randomly chosen macrophages were analyzed for total counts of adherent bacteria. (f) Macrophages 0.5 hours post infection with fim↑ and (g) ∆fim at a ratio of 10:1 bacteria per macrophage, respectively. GFP-expressing bacteria are colored in green, actin-binding phalloidin is colored in grey. One adherent ∆fim bacterium is indicated by the yellow arrow. Scale bar is 5 μm. (h) αMM decreased survivors of fim↑ inside macrophages. Variance of population means was analyzed using a one way ANOVA. Upper-case letters mark significant differences based on a post hoc Tukey and Bonferroni test. Pairs of samples that have no letter in common have significantly different means at p < 0.05; i.e., samples with the label A are significantly different from samples with the label B/C, but not from samples with the label A/B. cfu, colony forming units; fim↑, fimbriae overexpression strain; wt, fimbriae wild type strain; ∆fim, fimbriae knockout strain; GFP, green fluorescent protein; αMM, alpha-methyl mannosepyrannoside; LatB, LatrunculinB; h, hours.
Figure 3
Figure 3. A quantitative model adapting Michaelis Menten kinetics to bacteria-macrophage interactions allowed to estimate infection doses and rate constants.
(a) Formalized adhesion sequence between macrophages and bacteria according to Michaelis Menten kinetics. (b) Experimentally derived data (error bars are S.D.) and Michaelis Menten fit (given as solid line) are shown for fim↑. (c) Experimentally derived data and Michaelis Menten fit (given as solid line) are shown for ∆fim. Inset graph shows the full range to enable a comparison with the graph in b. (d) Michaelis Menten model predictions of the Mmax parameter showed the maximal relative number of macrophages that can bind to E.coli fim↑, wt, and ∆fim. (e) Fitting to the Michaelis Menten model yielded the inverse of the adhesion constant (1/Ks), and thus the kinetic rate constants for the adhesion of E.coli fim↑, wt, and ∆fim strains to macrophages. Error bars are S.D.; kon, reversible adhesion on-rate; koff, reversible adhesion off-rate, k, irreversible adhesion rate; 1/Ks, inverse Michaelis Menten constant; Mmax, maximum fraction of bacteria-bound macrophages; fim↑, fimbriae overexpression strain; wt, fimbriae wild type strain; ∆fim, fimbriae knockout strain; GFP, green fluorescent protein; αMM, alpha-methyl mannosepyrannoside; LatB, Latrunculin B.
Figure 4
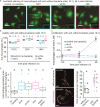
Figure 4. Substantial changes in the macrophage morphology occur upon exposure to E.coli and this response is neither affected by bacterial fimbriae expression nor the bacterial burden.
(a) Macrophages adhering to fibronectin coated glass surfaces, 24 hours post incubation without bacteria, with E.coli fim↑, fim wt and ∆fim at a bacterial burden of 10:1, respectively. Scale bar is 20 μm. (b) Viability of macrophages was independent of fimbriae expression and was assessed by membrane permeability assays using calcein (live cells) and propidium iodide (dead cells). (c) Macrophage proliferation was irreversibly inhibited post infection. (d) Cell surface areas were assessed by thresholding fluorescent micrographs of macrophages stained with the calcium-chelating live dye calcein 24 hours post infection. Cells in the control were not exposed to E.coli; supernatant refers to bacteria-conditioned media. Error bars are S.D. from n = 3 independent wells with 105 cells/well respectively in (b–c); Variance of population means was analyzed using a one way ANOVA. Upper-case letters mark significant differences based on a post hoc Tukey test. Pairs of samples that have no letter in common have significantly different means at p < 0.01; i.e., samples with the label A are significantly different from samples with the label B. (e) Macrophage surface interaction was assessed by immunostaining vinculin and counting of focal adhesion complexes at the cell periphery, and showed increased numbers of focal adhesion complexes post infection. Two randomly chosen images from vinculin immunostainings are shown on the left. Scale bar is 10 μm. The box plot shows focal adhesions per cell which were identified manually by their elongated spike shape from binarized images and counting, n = 9. Data points belonging to the pictures on the left have no fill. Variance of population means was analyzed using a one way ANOVA and post-hoc Tukey and Bonferroni test. Groups for statistical significance are given by upper case letters; different letters indicate that population means are significantly different at p < 0.001. fim↑, fimbriae overexpression strain; wt, fimbriae wild type strain; ∆fim, fimbriae knockout strain; h, hours.

Similar articles

Cited by

References

    1. Garcia-del Portillo F. & Finlay B. B. The varied lifestyles of intracellular pathogens within eukaryotic vacuolar compartments. Trends in microbiology 3, 373–380 (1995). - PubMed
    1. Glasser A. L. et al. Adherent invasive Escherichia coli strains from patients with Crohn’s disease survive and replicate within macrophages without inducing host cell death. Infection and Immunity 69, 5529–5537, 10.1128/iai.69.9.5529-5537.2001 (2001). - DOI - PMC - PubMed
    1. Anderson G. G. et al. Intracellular Bacterial Biofilm-Like Pods in Urinary Tract Infections. Science 301, 105–107, 10.1126/science.1084550 (2003). - DOI - PubMed
    1. Clay H., Volkman H. E. & Ramakrishnan L. Tumor Necrosis Factor Signaling Mediates Resistance to Mycobacteria by Inhibiting Bacterial Growth and Macrophage Death. Immunity 29, 283–294 (2008). - PMC - PubMed
    1. Kline K. A., Falker S., Dahlberg S., Normark S. & Henriques-Normark B. Bacterial adhesins in host-microbe interactions. Cell host & microbe 5, 580–592, 10.1016/j.chom.2009.05.011 (2009). - DOI - PubMed

Publication types

MeSH terms

Substances