. 2016 Jan 5:7:10238.
doi: 10.1038/ncomms10238.

Global proteogenomic analysis of human MHC class I-associated peptides derived from non-canonical reading frames

Affiliations

Global proteogenomic analysis of human MHC class I-associated peptides derived from non-canonical reading frames

Céline M Laumont et al. Nat Commun. .

Abstract

In view of recent reports documenting pervasive translation outside of canonical protein-coding sequences, we wished to determine the proportion of major histocompatibility complex (MHC) class I-associated peptides (MAPs) derived from non-canonical reading frames. Here we perform proteogenomic analyses of MAPs eluted from human B cells using high-throughput mass spectrometry to probe the six-frame translation of the B-cell transcriptome. We report that ∼ 10% of MAPs originate from allegedly noncoding genomic sequences or exonic out-of-frame translation. The biogenesis and properties of these 'cryptic MAPs' differ from those of conventional MAPs. Cryptic MAPs come from very short proteins with atypical C termini, and are coded by transcripts bearing long 3'UTRs enriched in destabilizing elements. Relative to conventional MAPs, cryptic MAPs display different MHC class I-binding preferences and harbour more genomic polymorphisms, some of which are immunogenic. Cryptic MAPs increase the complexity of the MAP repertoire and enhance the scope of CD8 T-cell immunosurveillance.


Figures

Figure 1
Figure 1. Proteogenomic workflow used for high-throughput identification of cryptic MAPs.
(a) General overview of the proteogenomic workflow used to identify conventional (Conv.) and cryptic (Crypt.) MAPs. Peptides were eluted from the cell surface of subject 1's B-LCL and were sequenced with liquid chromatography-MS/MS (LC-MS/MS). To determine the amino-acid (aa) sequence of those peptides, we built two databases (DBs), both derived from the analysis of RNA-seq data obtained from subject 1's B-LCL: the control DB and the all-frames DB (see Methods and Supplementary Fig. 1). (b) Peptides solely identified by the all-frames DB were considered as Crypt. MAP candidates and further filtered to remove ambiguous and false-positive identifications. See also Supplementary Figs 2 and 3.
Figure 2
Figure 2. Detection of Crypt. and Conv. MAPs is HLA-dependent.
(a) Relationship between MAP detection and HLA genotype. We sequenced MAPs on B-LCLs from three subjects who shared four, two or no HLA alleles with subject 1. We then determined the number of Conv. (left) and Crypt. (right) MAPs found in subject 1 that were shared by subjects 2–4. Each bar represents one HLA allotype. A detailed schematic of the analysis can be found in Supplementary Fig. 4. MAP detection in subjects 2–4 correlated with presence of the HLA allotype presenting the MAPs in subject 1: P<2.2 × 10⁻¹⁶ for Conv. and Crypt. MAPs (two-sided Fisher's exact test). (b) Schematic detailing of the numbers of Conv. and Crypt. MAPs identified in subject 1 for the considered HLA alleles. (c) Most MAPs detected in subject 4 are promiscuous binders. Overall, 168 Conv. and 9 Crypt. MAPs detected in subject 1 were also detected in subject 4, even though the two subjects did not share any HLA alleles. Using NetMHCcons, we computed the predicted binding affinity (IC50) of those MAPs for the four HLA-A and -B allotypes of subject 4, and we kept the lowest of the four IC50 values (corresponding to the highest MHC-binding affinity). The bar chart depicts the percentage of Conv. and Crypt. MAPs having an IC50≤ or >5,000 nM. Peptides with an IC50≤5,000 nM for the HLA-A/B allotypes of subject 4 were assumed to be promiscuous binders, that is, to bind subject 4 allotypes in addition to subject 1 allotypes.
Figure 3
Figure 3. Crypt. MAPs derive from both coding and noncoding transcripts.
(a) Some Crypt. MAPs derive from novel antisense transcripts. Bar plot showing the percentages of Crypt. MAPs derived from sense and antisense transcriptions. (b,c) For Crypt. MAPs derived from sense transcription, we determined the percentage of each gene biotype in MAP source genes (b) and the proportion of Crypt. MAPs generated by six types of genomic regions (c). The ‘exon' class refers to out-of-frame Crypt. MAPs, while the ‘junction' category corresponds to peptides encoded by intron–exon or UTR–exon junction. LincRNA, long intergenic noncoding RNAs.
Figure 4
Figure 4. Crypt. MAPs preferentially derive from unstable mRNAs.
(a) Venn diagram showing minimal overlap between the gene source of Conv. and Crypt. MAPs. (b) Crypt. MAPs preferentially derive from the 5′ end of their source transcript. The length of each source transcript was normalized to 1, and the start of each MAP was then positioned on a 0–1 scale (x axis), where 0 represents the 5′ end of the source transcript. Crypt. MAPs deriving from intergenic and intronic regions were excluded from this analysis. See also Supplementary Fig. 5a. (c) Log10 expression values, in FPKM, of all genes expressed in B-LCL versus the subset of the gene source of Conv. and Crypt. MAPs. (d) Crypt. source transcripts preferentially bear upstream ORFs (uORFs). For each MAP source transcript, we predicted the 5′UTR and 5′UTR–exon ORF initiating at an AUG embedded in an optimal or strong Kozak context. The bar graph shows the proportion of source transcripts bearing at least one uORF and generating a Conv. MAP, a Crypt. MAP or both. See also Supplementary Fig. 5b. (e) Crypt. source transcripts display long 3′UTRs. Using pyGeno, we retrieved the 3′UTR of MAP source transcripts (when available) and computed their length in nucleotide (nt). The boxplot displays the resulting 3′UTR length distribution for Crypt. and Conv. MAP source transcripts excluding the upper outliers that represented 6 and 107 values out of 97 and 1,770 transcripts, respectively. (f) 3′UTRs of Crypt. but not Conv. MAP source transcripts are enriched in destabilizing elements. We looked for destabilizing and stabilizing elements identified in ref. in the 3′UTR of Crypt. and Conv. MAP source transcripts. For each source transcript, we computed the number of destabilizing and stabilizing elements contained in its sequence. The resulting distributions are plotted for Crypt. and Conv. MAP source transcripts as the log2 number of destabilizing (top panel) or stabilizing elements (bottom panel) per transcript. See also Supplementary Fig. 5c. Statistical significance was assessed with a two-sided (b,c,e) or one-sided (f) Wilcoxon rank sum test, or a two-sided Fisher's exact test (d). On box plots, boxes represent second and third quartiles, whiskers ±1.5 the interquartile range, and dots the outliers.
Figure 5
Figure 5. Features of ORFs coding Crypt. MAPs.
(a) Most Crypt. PCRs are in-frame with an upstream start codon. To predict the probable start codon of each Crypt. PCR, we sequentially applied the following rules: (i) presence of an upstream AUG within an optimal (GCC[R]CCstartG[V]), strong ([R]NNstartG[V]) or weak (anything else) Kozak context, (ii) presence of an upstream near-cognate start codon within an optimal or strong Kozak context, (iii) any other codon downstream of the first upstream stop codon. Bars represent the percentage of Crypt. PCRs displaying an upstream in-frame AUG, near-cognate start codon or any other codon as a probable initiation codon. (b) Bar plot showing near-cognate start codon usage at putative translational start sites of 12 Crypt. source proteins. (c) Length distribution of Conv. and predicted Crypt. proteins. Median, minimum (Min) and maximum (Max) observed lengths are indicated on the graph for both types of proteins. Conv. proteins having a length >3,000 amino acids are not displayed on the graph. (d) Crypt. and Conv. MAPs do not have the same amino-acid composition at their C termini. Amino acids (aa) were classified in four categories: Hydrophobic/Large (HL), Hydrophobic/Small-Medium (HS), Polar/Large (PL) and Polar/Small-Medium (PS). For the MAP C terminus (positions P4 to P1) and its C-terminal flanking region (positions P1′ to P4′), we compared the usage of those four aa categories at each position between Crypt. and Conv. MAPs. The graph displays the log2(odds ratio) and significant differences are marked with an asterisk (*P<0.05; two-sided Fisher's exact test).
Figure 6
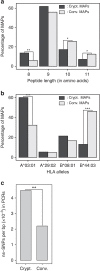
Figure 6. Crypt. and Conv. MAPs display different features.
(ac) Bar plots showing that Crypt. and Conv. MAPs from subject 1 have different (a) length distribution, (b) allotype distribution and that (c) their PCRs exhibit different ns-SNP frequencies (from dbSNP138). In all cases, statistical significance was assessed using a two-sided Fisher's exact test: *P≤0.05, **P≤0.006, ***P≤1.10−11 in the bar plots.
Figure 7
Figure 7. Immunogenicity of Crypt. MAPs.
(a,b) Only polymorphic Crypt. MAPs are immunogenic. IFN-γ Elispot counts showing the number of spot-forming cells (SFCs) per million CD8 T cells for two non-polymorphic (a) and two polymorphic (b) Crypt. MAPs. Final counts were obtained following the subtraction of background spots (peptide-coated APCs alone) from the spots obtained when CD8 T cells were exposed to peptide-coated or uncoated APCs. The experiment was performed in biological triplicates (each with three technical replicates), error bars represent s.d. and statistical significance was assessed using a two-tailed Student's t-test (NS: not significant, P>0.05). Features of the four tested Crypt. MAPs are detailed in Tables 1 and 2.

References

    1. Djebali S. et al. Landscape of transcription in human cells. Nature 489, 101–108 (2012). - PMC - PubMed
    1. Kim M. S. et al. A draft map of the human proteome. Nature 509, 575–581 (2014). - PMC - PubMed
    1. Weekes M. P. et al. Quantitative temporal viromics: an approach to investigate host-pathogen interaction. Cell 157, 1460–1472 (2014). - PMC - PubMed
    1. Alfaro J. A., Sinha A., Kislinger T. & Boutros P. C. Onco-proteogenomics: cancer proteomics joins forces with genomics. Nat. Methods 11, 1107–1113 (2014). - PubMed
    1. Nesvizhskii A. I. Proteogenomics: concepts, applications and computational strategies. Nat. Methods 11, 1114–1125 (2014). - PMC - PubMed

Publication types