. 2016 Jan 5:13:1.
doi: 10.1186/s12974-015-0467-5.

Non-alcoholic fatty liver disease induces signs of Alzheimer's disease (AD) in wild-type mice and accelerates pathological signs of AD in an AD model

Affiliations

Non-alcoholic fatty liver disease induces signs of Alzheimer's disease (AD) in wild-type mice and accelerates pathological signs of AD in an AD model

Do-Geun Kim et al. J Neuroinflammation. .

Abstract

Background: Non-alcoholic fatty liver disease (NAFLD) is a chronic liver disease afflicting about one third of the world's population and 30 % of the US population. It is induced by consumption of high-lipid diets and is characterized by liver inflammation and subsequent liver pathology. Obesity and consumption of a high-fat diet are known to increase the risk of Alzheimer's disease (AD). Here, we investigated NAFLD-induced liver inflammation in the pathogenesis of AD.

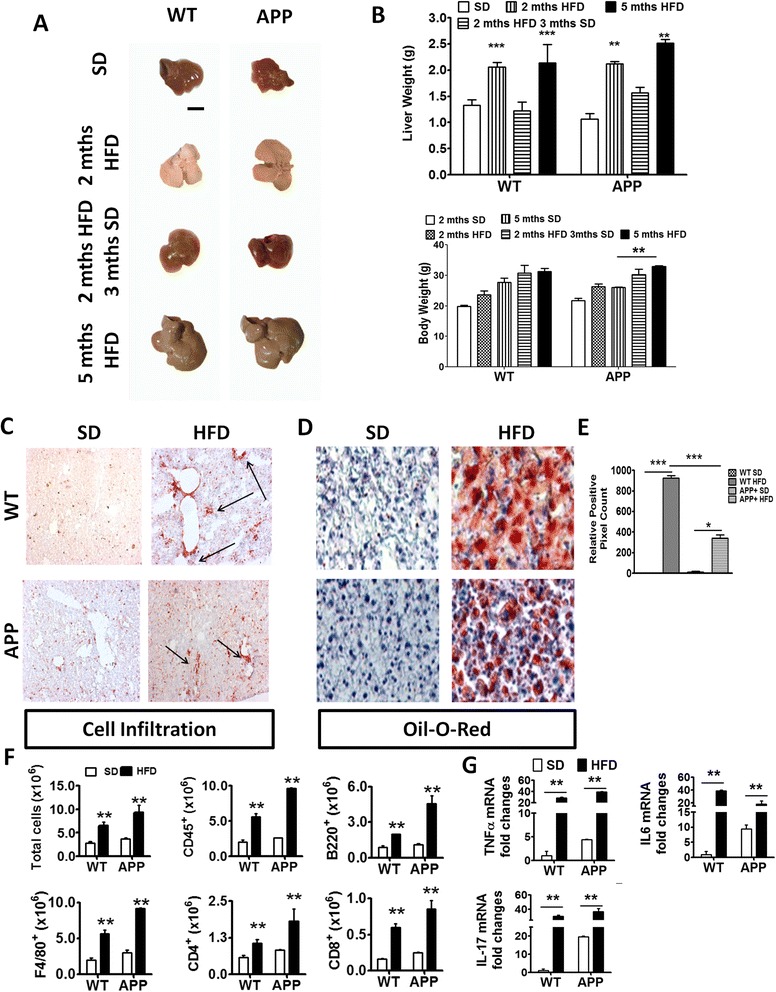
Methods: WT and APP-Tg mice were fed with a standard diet (SD) or a high-fat diet (HFD) for 2, 5 months, or 1 year to induce NAFLD. Another set of APP-Tg mice were removed from HFD after 2 months and put back on SD for 3 months.

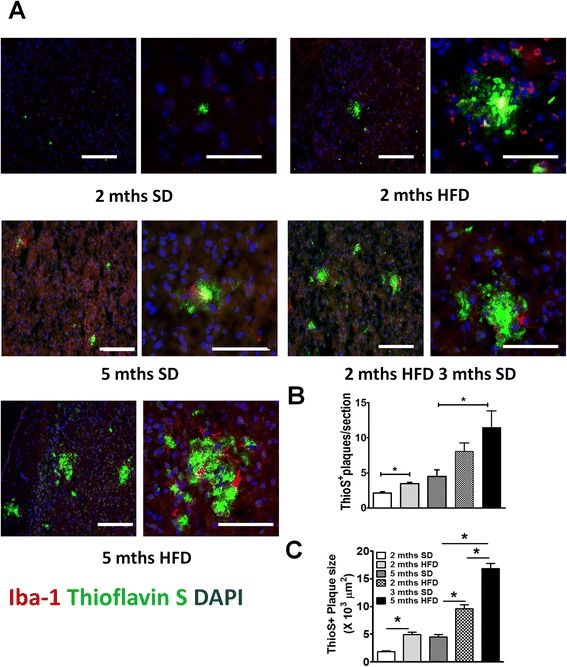
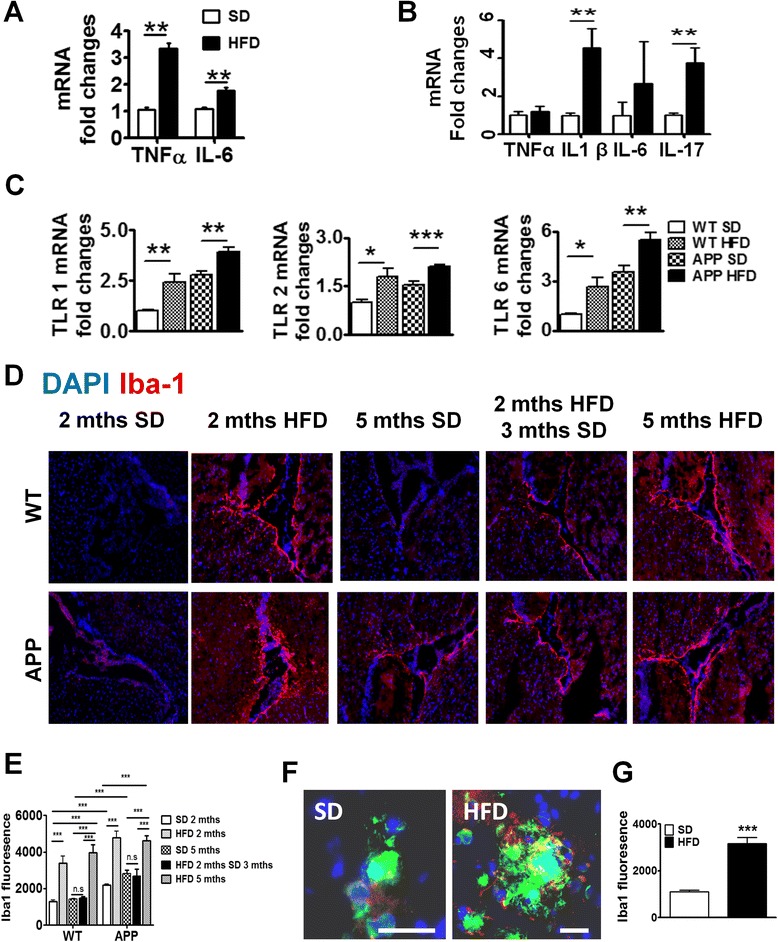
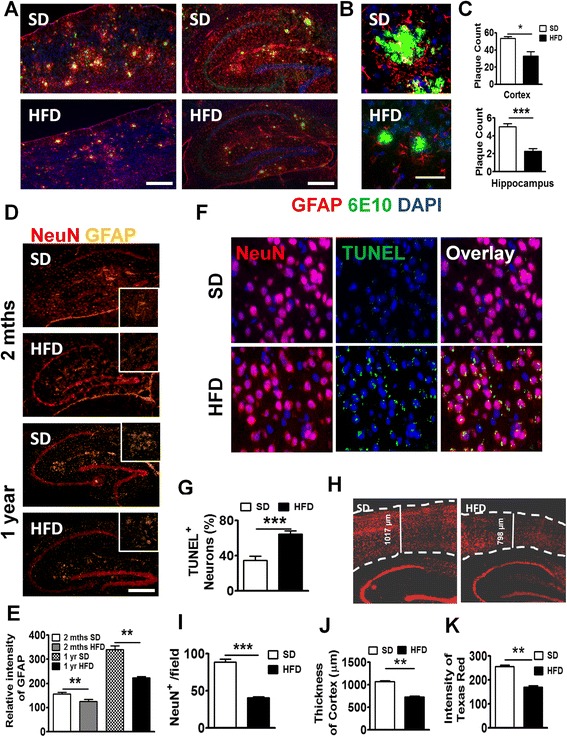
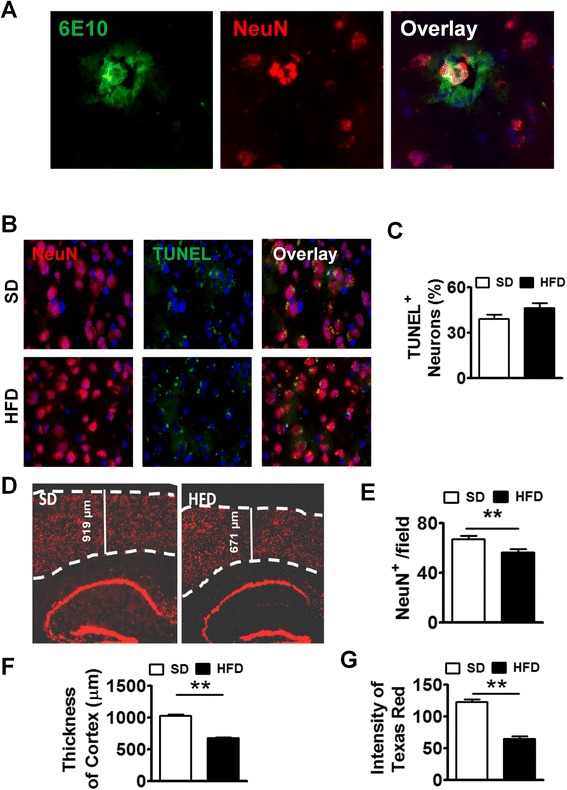
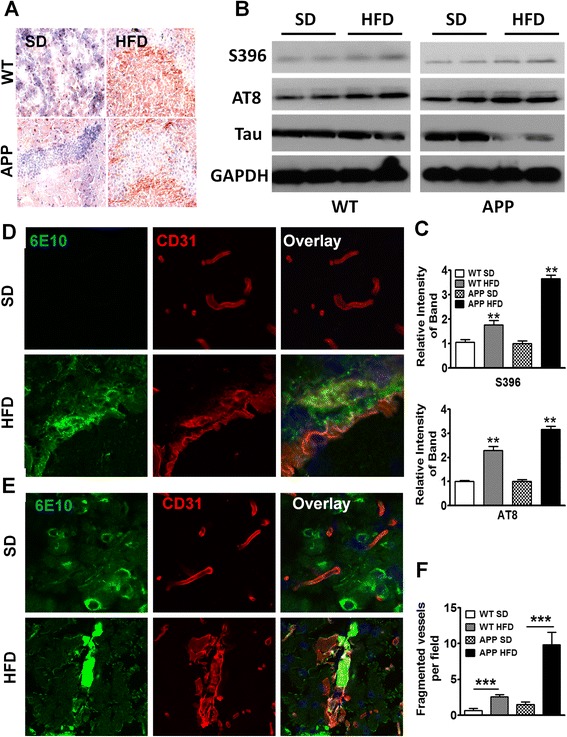
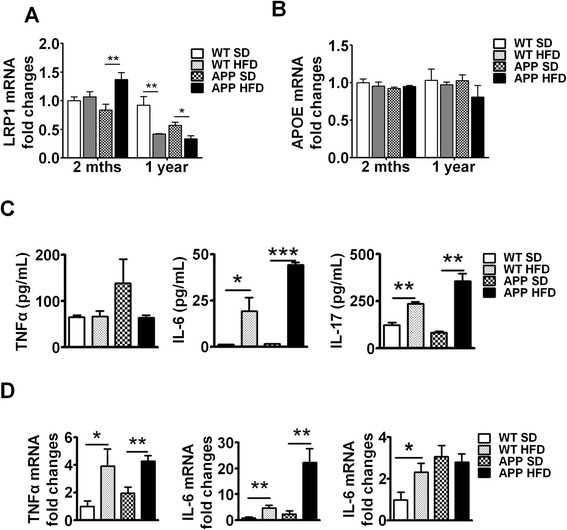
Results: During acute phase NAFLD, WT and APP-Tg mice developed significant liver inflammation and pathology that coincided with increased numbers of activated microglial cells in the brain, increased inflammatory cytokine profile, and increased expression of toll-like receptors. Chronic NAFLD induced advanced pathological signs of AD in both WT and APP-Tg mice, and also induced neuronal apoptosis. We observed decreased brain expression of low-density lipoprotein receptor-related protein-1 (LRP-1) which is involved in β-amyloid clearance, in both WT and APP-Tg mice after ongoing administration of the HFD. LRP-1 expression correlated with advanced signs of AD over the course of chronic NAFLD. Removal of mice from HFD during acute NAFLD reversed liver pathology, decreased signs of activated microglial cells and neuro-inflammation, and decreased β-amyloid plaque load.

Conclusions: Our findings indicate that chronic inflammation induced outside the brain is sufficient to induce neurodegeneration in the absence of genetic predisposition.


Figures

Fig. 1
Fig. 1
HFD accelerated β amyloid plaque burden in APP-Tg mice. a Representative images of Thioflavin S (green) and Iba-1 (red) stained cortical brain sections from age-matched APP-Tg mice. Nucleus was counter-stained with DAPI (blue). Mice were fed with SD (left top panel) or HFD (right top panel) for 2 months. A different set of mice was fed SD for five months (left middle panel) or HFD for 2 months followed by SD for 3 months (right middle panel). A different set of mice was kept on HFD for 5 months (left bottom panel). Images on the right side are close ups of the plaque clusters seen on the images on the left. Scale bar = 100 μm. b, c Quantification of Thioflavin S positive plaque number (b) and size (c) in cortical sections of multiple fields (ten fields/mouse) from five mice/group in one representative experiment out of four independent experiments. * indicates p < 0.05 (One-way ANOVA with Bonferroni post-test)
Fig. 2
Fig. 2
HFD induced acute liver pathology and inflammation in WT and APP-Tg and mice. a Representative images of livers from WT or APP-Tg mice fed with HFD or SD, with corresponding liver and body weights of their respective age-matched SD-fed controls. Scale bar indicates 5 mm (b). ** and *** indicate p < 0.01 and p < 0.001, respectively (two-way ANOVA with Bonferroni post-test). c Representative CD45+ staining of liver sections from WT or APP-Tg mice fed with SD or HFD for 2 months. d Representative oil O-red staining on frozen tissue sections of livers from WT or APP-Tg mice fed with SD or HFD for 2 months. e Relative positive pixel count of oil O-red staining quantified using Zen software (Carl Zeiss). * and *** indicate p < 0.05 and p < 0.001, respectively (two-way ANOVA with Bonferroni post-test). f Quantitative analysis of total leukocyte numbers (CD45+) isolated from the livers of 2-month SD or HFD-fed WT and APP-Tg mice by flow cytometry. ** indicates p < 0.01 (two-way ANOVA with Bonferroni post-test, n = 3/group). g TNF-α, IL-6, and IL-17 mRNA expression in livers of WT and APP-Tg mice fed with SD or HFD for 2 months. ** indicates p < 0.01 (two-way ANOVA with Bonferroni post-test, n = 3/group, representative experiment of four independent experiments)
Fig. 3
Fig. 3
Brains of HFD-fed mice have increased inflammation and microglial activation. mRNA expression of pro-inflammatory cytokine in brains of APP-Tg (a) and WT mice (b). ** indicates p < 0.01 (two-tailed student t test, n = 2 performed in triplicates representative of four independent experiments). c Brain mRNA expression of TLR1, TLR2, and TLR6 of WT or APP-Tg mice after being on SD or HFD for 2 months. *, **, *** indicate p < 0.05, p < 0.01, and p < 0.001 (two-tailed student t test, n = 2 performed in triplicates representative of four independent experiments). d Representative images of Iba-1 (red) near the choroid plexus from WT mice and APP-Tg mice fed with SD or HFD for 2 or 5 months, or initially with HFD for 2 months and then put back on SD for 3 months. Nucleus was counter-stained with DAPI (blue). e Intensity of Iba-1 expression from d measured from different fields (n = 20, three mice/group) using Zen Software (Carl Zeiss). ** and *** indicate where p < 0.01 and p < 0.001, respectively. (two-way ANOVA with Bonferroni post-test) f Representative image of relative localization of Iba-1 (red) with β- amyloid plaque (green) from cortices of brains of mice fed with SD or HFD for 2 months. Nucleus was counter-stained with DAPI (blue). Scale bar = 50 μm. g Intensity of Iba-1 signal from (f) was measured from different plaques using Zen Software (Carl Zeiss) (n = 20, five mice/group). *** indicates p < 0.001 (two-tailed student’s t test)
Fig. 4
Fig. 4
Long-term HFD decreased NeuN+ cells, Aβ plaques, and astrocytes in APP-Tg mice. a Representative images of cortex (left panel) or hippocampus (right panel) from APP-Tg mice fed with SD or HFD for 1 year, stained with anti-6E10 anti-β-amyloid antibody (green), anti-GFAP (red), and DAPI (blue). Scale bar = 200 μm. b Representative zoomed-in images of reactive astrocyte (red) around plaque (green) from the cortex of SD or HFD-fed APP-Tg mice. Scale bar = 50 μm. c Number of plaques from different regions of cortex (n = 10) or hippocampus (n = 10). * indicates p < 0.05 (two-tailed student’s t test, n = 2 mice/group, representative of two independent experiments). d Representative with SD or HFD for 2 months (top panel) or 1 year (bottom panel) stained with anti-NeuN (red), and anti-GFAP antibody (gold). Zoomed-in image was inserted as inlet. e Relative intensity of GFAP signal from d (n = 10). ** indicates p < 0.01 (two-tailed student’s t test, twice mice/group, representative of two independent experiments). Representative images (f) and quantitative analysis (g) of images from brain cortex of APP-Tg mice fed with SD or HFD stained with NeuN (red), or TUNEL (green). TUNEL/NeuN double positive cells were counted from ten different fields and quantified as a percentage of total cell count. *** indicates p < 0.001 (two-tailed student’s t test, two mice/group). h Representative image of brain sections from SD or HFD-fed APP-Tg mice stained with anti-NeuN antibody (red). Dotted lines indicate the outline of NeuN-positive signal in cerebral cortex. i Quantitative analysis of h *** indicates p < 0.001 (two-tailed student’s t test, two mice/group). j Cortical thickness of brains from SD or HFD-fed mice measured from ten different fields. ** indicates p < 0.001 (two-tailed student’s t test, two mice/group). k Quantitative analysis of h, showing intensity of NeuN-positive signal measured from ten different fields of dentate gyrus from mice fed SD or HFD. ** indicates p < 0.001 (two-tailed student’s t test, two mice/group)
Fig. 5
Fig. 5
Long-term HFD induced Aβ plaque formation in brains of WT mice. a Representative images of brain sections from HFD-fed WT mice stained with anti-NeuN (red) and anti-6E10 (green). b Representative images of brain sections (cortex) from SD or HFD-fed WT mice double-stained with anti-NeuN (red) and TUNEL (green). c TUNEL/NeuN double positive cells were counted from ten different fields and quantified as a percentage of total cell count. d Representative image of brain sections from SD or HFD-fed WT mice stained with anti-NeuN antibody (dotted lines indicate the outline of NeuN-positive signal in the cerebral cortex. e Quantitative analysis of d, showing numbers of NeuN+ cells from ten fields of the brain. ** indicates p < 0.01 (two-tailed student’s t test, two mice/group). f Comparison of cortical thickness of brains from SD or HFD-fed mice. Thickness of cortex was measured from ten different fields. ** indicates p < 0.01 (two-tailed student’s t test, two mice/group). g Quantitative analysis of d, capturing the intensity of NeuN-positive signal measured from ten different fields of the dentate gyrus from brains of mice fed with SD or HFD. ** indicates p < 0.01 (two-tailed student’s t test, two mice/group). These are representative findings from two independent experiments
Fig. 6
Fig. 6
Long-term HFD induced advanced signs of AD in WT and APP-Tg mice. a Representative images of hippocampus from WT and APP-Tg mice fed with SD or HFD for 1 year, stained with anti-phosphorylated-Tau (S396) antibody. b, c Western blot analysis of brain homogenate of WT or APP-Tg mice fed with SD or HFD for 1 year (b). Phosphorylated-Tau was detected with S396 or AT8 antibody and total Tau protein was detected with anti-Tau antibody. GAPDH was used as loading control. Intensity of phospho-Tau was normalized by that of Tau protein which was further normalized by intensity of GAPDH and depicted in graph (c). ** indicates p < 0.01. (two-tailed student’s t test, n = 2). d Representative brain sections from WT mice fed SD or HFD and stained with anti-CD31 (red) and anti-β- amyloid antibody, 6E10 (green) to assess the degree of cerebral amyloid angiopathy (CAA) and vasculopathy. The top three panels depict SD controls, the bottom three panels show HFD-induced CAA. e Representative brain images from APP-Tg mice double-stained with antibodies to β-amyloid (6E10) and CD31 (vasculature) for SD (top three panels) or HFD (bottom three panels) to evaluate CAA. f Quantification of fragmented vessels taken over multiple microscopic fields throughout the brains of WT and APP-Tg mice fed with SD or HFD. *** indicates p < 0.001 (Two-tailed student’s t test, ten fields/mouse, n = 2 mice/group)
Fig. 7
Fig. 7
Long-term HFD decreased LRP1 and maintained chronic inflammation in brains of WT and APP-Tg mice mRNA expression of LRP1 (a) or ApoE (b) was analyzed in the brains of mice fed SD or HFD for 2 months or 1 year by quantitative real-time PCR. * and ** indicate p < 0.05 and p < 0.01, respectively (two-tailed student’s t test, n = 2 mice/group performed in triplicates, representative of two independent experiments). c Splenocytes from mice fed SD or HFD for 1 year were stimulated with PMA-ionomycin for 3 days, supernatants were collected and pro-inflammatory cytokines (TNF-α, IL-6, IL-17) were quantified by ELISA. *, **, and *** indicate p < 0.05, p < 0.01, and p < 0.001, respectively (two-tailed student’s t test, n = 2 mice/group performed in triplicates, representative of two independent experiments). d mRNA expression level of pro-inflammatory cytokines (TNF-α, IL-6, IL17) was analyzed in brain samples from mice fed HFD or SD for 1 year by quantitative real-time PCR * and ** indicate p < 0.05 and p < 0.01, respectively (two-tailed student’s t test, n = 2 mice/group performed in triplicates, representative of two independent experiments)

Similar articles

Cited by

References

    1. Serrano-Pozo A, Frosch MP, Masliah E, Hyman BT. Neuropathological alterations in Alzheimer disease. Cold Spring Harb Perspect Med. 2011;1:a006189. doi: 10.1101/cshperspect.a006189. - DOI - PMC - PubMed
    1. Thies W, Bleiler L. 2013 Alzheimer's disease facts and figures. Alzheimers Dement. 2013;9:208–45. doi: 10.1016/j.jalz.2013.02.003. - DOI - PubMed
    1. Lok K, Zhao H, Shen H, Wang Z, Gao X, Zhao W, et al. Characterization of the APP/PS1 mouse model of Alzheimer's disease in senescence accelerated background. Neurosci Lett. 2013;557, Part B:84–9. doi: 10.1016/j.neulet.2013.10.051. - DOI - PubMed
    1. Lalonde R, Fukuchi K, Strazielle C. APP transgenic mice for modelling behavioral and psychological symptoms of dementia (BPSD) Neurosci Biobehav Rev. 2012;36:1357–75. doi: 10.1016/j.neubiorev.2012.02.011. - DOI - PMC - PubMed
    1. Saura CA, Servian-Morilla E, Scholl FG. Presenilin/gamma-secretase regulates neurexin processing at synapses. PLoS One. 2011;6:e19430. doi: 10.1371/journal.pone.0019430. - DOI - PMC - PubMed

Publication types

MeSH terms