. 2016 Jan 5:17:10.
doi: 10.1186/s12863-015-0321-x.

High-fat-diet induced development of increased fasting glucose levels and impaired response to intraperitoneal glucose challenge in the collaborative cross mouse genetic reference population

Affiliations

High-fat-diet induced development of increased fasting glucose levels and impaired response to intraperitoneal glucose challenge in the collaborative cross mouse genetic reference population

Hanifa J Abu-Toamih Atamni et al. BMC Genet. .

Abstract

Background: The prevalence of Type 2 Diabetes (T2D) mellitus in the past decades, has reached epidemic proportions. Several lines of evidence support the role of genetic variation in the pathogenesis of T2D and insulin resistance. Elucidating these factors could contribute to developing new medical treatments and tools to identify those most at risk. The aim of this study was to characterize the phenotypic response of the Collaborative Cross (CC) mouse genetic resource population to high-fat diet (HFD) induced T2D-like disease to evaluate its suitability for this purpose.

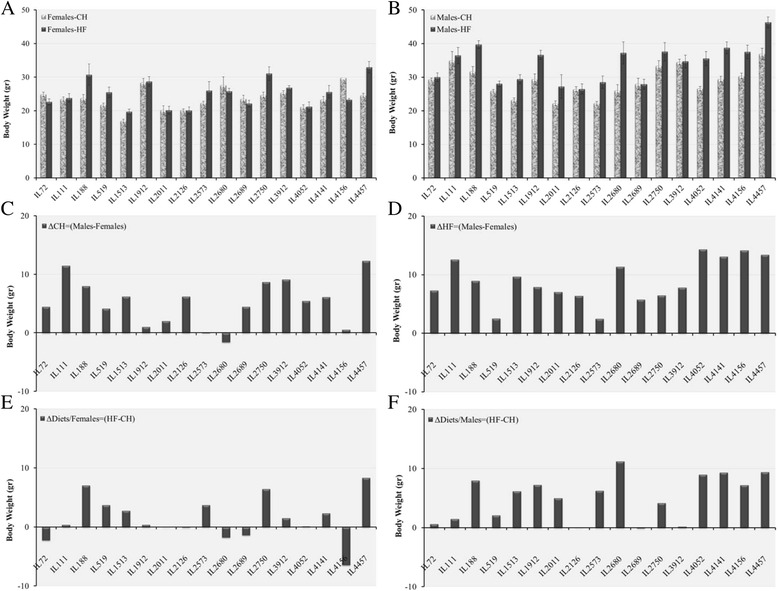
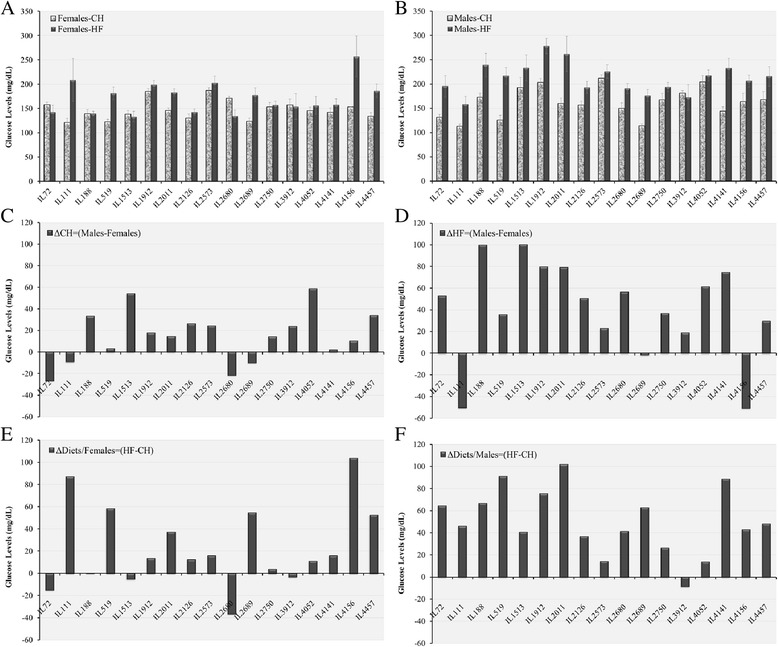
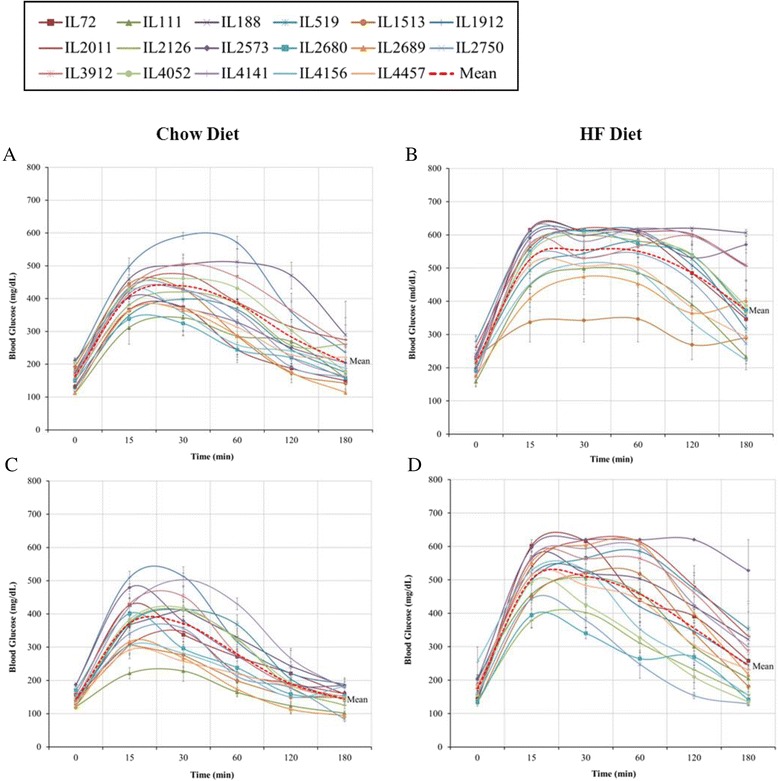
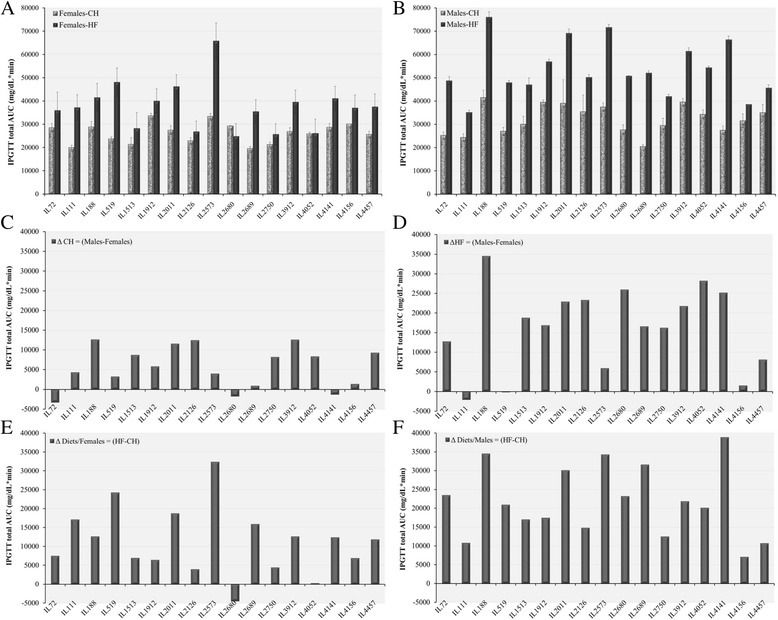
Results: We studied 683 mice of 21 different lines of the CC population. Of these, 265 mice (149 males and 116 females) were challenged by HFD (42% fat); and 384 mice (239 males and 145 females) of 17 of the 21 lines were reared as control group on standard Chow diet (18% fat). Briefly, 8 week old mice were maintained on HFD until 20 weeks of age, and subsequently assessed by intraperitoneal glucose tolerance test (IPGTT). Biweekly body weight (BW), body length (BL), waist circumstance (WC), and body mass index (BMI) were measured. On statistical analysis, trait measurements taken at 20 weeks of age showed significant sex by diet interaction across the different lines and traits. Consequently, males and females were analyzed, separately. Differences among lines were analyzed by ANOVA and shown to be significant (P <0.05), for BW, WC, BMI, fasting blood glucose, and IPGTT-AUC. We use these data to infer broad sense heritability adjusted for number of mice tested in each line; coefficient of genetic variation; genetic correlations between the same trait in the two sexes, and phenotypic correlations between different traits in the same sex.

Conclusions: These results are consistent with the hypothesis that host susceptibility to HFD-induced T2D is a complex trait and controlled by multiple genetic factors and sex, and that the CC population can be a powerful tool for genetic dissection of this trait.


Figures

Fig. 1
Fig. 1
End time point Body Weight (g) of 17 CC lines separately for females and males, after 12 weeks on Chow diet (CH, 18 % fat) and on high fat diet (HFD, 42 % fat). Bar graphs a and b show end time point Body Weight means (±SE) for CH and HFD of females and males, respectively, by lines. Bar graphs c and d, show diference between males and females for Chow (ΔCH = Males-Females) and HFD (ΔHF = Males-Females), respectively. Bar graphs e and f show differences between CH and HFD for females (ΔDiets/Females = HF-CH) and males (ΔDiets/Males = HF-CH), respectively. No. of animals: HFD, 128 males, 102 females; Chow, 146 males, 137 females
Fig. 2
Fig. 2
Fasting Glucose levels (mg/dL) of 17 CC lines separately for females and males, after 12 weeks on Chow diet (CH, 18 % fat) and on high fat diet (HFD, 42 % fat) measured at time 0 before IPGTT glucose injection. Bar graphs a and b show Fasting Glucose level means (±SE) for Chow and HFD of females and males, respectively, by lines. Bar graphs c and d, show diference between males and females for Chow (ΔCH = Males-Females) and HFD (ΔHF = Males-Females), respectively. Bar graphs e and f show differences between Chow and HFD for females (ΔDiets/Females = HF-CH) and males (ΔDiets/Males = HF-CH), respectively. No. of animals: HFD, 128 males, 102 females; Chow, 146 males, 137 females
Fig. 3
Fig. 3
Kinetics of Intraperitoneal glucose tolerance test (IPGTT) showing mean blood glucose level (±SE) at different time points during 180 min test. Data are shown for 17 CC lines, separately for males and females, at age 20 weeks after 12 weeks on Chow diet (CH, 18 % fat) and on high fat diet (HFD, 42 % fat). Blood glucose levels were measured at time 0, 15, 30, 60, 120 and 180 min after glucose injection. The dark central line shows average glucose levels across lines. Chart a, Males-Chow; b, males-HFD; c, females-Chow; d, females-HFD. No. of animals: HFD, 128 males, 102 females; Chow, 146 males, 137 females
Fig. 4
Fig. 4
Blood glucose levels (mg/dL) during intraperitoneal glucose tolerance test (IPGTT) of 17 CC lines separately for females and males, after 12 weeks on Chow diet (18 % fat) and on high fat diet (HFD, 42 % fat) measured at time 0, 15, 30, 60, 120 and180 min after glucose injection. Bar graphs a and b show means (±SE) of total area under the curve (AUC) for Chow and HFD of females and males, respectively, by lines. Bar graphs c and d, show diference between males and females for Chow (ΔCH = Males-Females) and HFD (ΔHF = Males-Females), respectively. Bar graphs e and f show differences between Chow and HFD for females (ΔDiets/Females = HF-CH) and males (ΔDiets/Males = HF-CH), respectively. No. of animals: HFD, 128 males, 102 females; Chow, 146 males, 137 females
Fig. 5
Fig. 5
Kinetics of Body Weight (g) means (±SE) of females (a) and males (b) of 21 CC lines from 0 to 12 weeks on high fat diet (HFD, 42 % fat). c and d, bar graphs showing mean gains (±SE) on HFD of males and females weeks 0 to 6 and 7 to 12, respectively; lines ordered according to male gains from 0 to 6 weeks. e and f, bar graphs showing differences between males and females in weight gains from 0 to 6 and from 7 to 12 weeks on HFD, respectively. No. of animals: 149 males, 116 females
Fig. 6
Fig. 6
Scattergrams showing regression of Body Weight (BW) gain in weeks 7 – 12 on Body Weight (BW) gain in weeks 0–6 on High-Fat diet (HFD, 42 % fat) by line means for 21 lines. Chart a, males; b, females. No of animals, 149 males, 116 females

Similar articles

Cited by

References

    1. National Diabetes Information Clearinghouse. National Diabetes Statistics. NIH Publication. http://www.cdc.gov/diabetes/pubs/statsreport14/national-diabetes-report-.... (2014). Accessed 26 Apr 2015.
    1. Narayan KM, Boyle JP, Thompson TJ, Sorensen SW, Williamson DF. Lifetime risk for diabetes mellitus in the United States. JAMA. 2003;290(14):1884–90. doi: 10.1001/jama.290.14.1884. - DOI - PubMed
    1. Zimmet P, Alberti KG, Shaw J. Global and societal implications of the diabetes epidemic. Nature. 2001;414:782–7. doi: 10.1038/414782a. - DOI - PubMed
    1. Florez JC, Hirschhorn J, Altshuler D. The inherited basis of diabetes mellitus: implications for the genetic analysis of complex traits. Annu Rev Genomics Hum Genet. 2003;4:257–91. doi: 10.1146/annurev.genom.4.070802.110436. - DOI - PubMed
    1. Permutt MA, Wasson J, Cox N. Genetic epidemiology of diabetes. J Clin Invest. 2005;115:1431–9. doi: 10.1172/JCI24758. - DOI - PMC - PubMed

Publication types