. 2016 Jan 5:13:1.
doi: 10.1186/s12977-015-0234-9.

HIV-1 latency and virus production from unintegrated genomes following direct infection of resting CD4 T cells

Affiliations

HIV-1 latency and virus production from unintegrated genomes following direct infection of resting CD4 T cells

Chi N Chan et al. Retrovirology. .

Abstract

Background: HIV-1 integration is prone to a high rate of failure, resulting in the accumulation of unintegrated viral genomes (uDNA) in vivo and in vitro. uDNA can be transcriptionally active, and circularized uDNA genomes are biochemically stable in non-proliferating cells. Resting, non-proliferating CD4 T cells are prime targets of HIV-1 infection and latently infected resting CD4 T cells are the major barrier to HIV cure. Our prior studies demonstrated that uDNA generates infectious virions when T cell activation follows rather than precedes infection.

Results: Here, we characterize in primary resting CD4 T cells the dynamics of integrated and unintegrated virus expression, genome persistence and sensitivity to latency reversing agents. Unintegrated HIV-1 was abundant in directly infected resting CD4 T cells. Maximal gene expression from uDNA was delayed compared with integrated HIV-1 and was less toxic, resulting in uDNA enrichment over time relative to integrated proviruses. Inhibiting integration with raltegravir shunted the generation of durable latency from integrated to unintegrated genomes. Latent uDNA was activated to de novo virus production by latency reversing agents that also activated latent integrated proviruses, including PKC activators, histone deacetylase inhibitors and P-TEFb agonists. However, uDNA responses displayed a wider dynamic range, indicating differential regulation of expression relative to integrated proviruses. Similar to what has recently been demonstrated for latent integrated proviruses, one or two applications of latency reversing agents failed to activate all latent unintegrated genomes. Unlike integrated proviruses, uDNA gene expression did not down modulate expression of HLA Class I on resting CD4 T cells. uDNA did, however, efficiently prime infected cells for killing by HIV-1-specific cytotoxic T cells.

Conclusions: These studies demonstrate that contributions by unintegrated genomes to HIV-1 gene expression, virus production, latency and immune responses are inherent properties of the direct infection of resting CD4 T cells. Experimental models of HIV-1 latency employing directly infected resting CD4 T cells should calibrate the contribution of unintegrated HIV-1.


Figures

Fig. 1
Fig. 1
Kinetics of responsiveness to activating agents following initial infection of resting CD4 T cells. a Experimental design. After infection, samples of the IL-4-treated resting CD4 T cells were maintained in culture with or without raltegravir (RAL) for the indicated time period and were then stimulated by αCD3/CD28 activation beads or prostratin plus trichostatin (Pro/TSA) for 2 days before analysis by flow cytometry. IL-4 was replenished every 7 days. Raltegravir was added on the day of infection and on days 3, 7, 14 and 21. b Emergence of GFP+ productively infected cells. Pro/TSA or αCD3/CD28 beads were added 2 days prior to analysis. Only the GFP+ cells are displayed, and the areas under the curves represent the number of GFP+ cells present in each sample. Red arrows indicate subpopulations which we have previously shown to contain predominantly unintegrated HIV-1 (uDNA) or to contain at least one copy of integrated HIV-1 DNA (iDNA) [6]. One representative of 5 experiments is shown. Additional file 1: Fig. S1A in presents a similar experiment performed using an Int-D116N integrase active site mutant. c Percentage of cells that were GFP+. Experiment was performed in triplicate. To account for proliferation of GFP-negative cells, %GFP+ was calculated as the number of GFP+ cells divided by the number of total live cells, which was adjusted for proliferation using the Expansion Index in the Proliferation Platform of FlowJo 9. Cell divisions were measured by eFluor670 dilution. Typically ≤16 % of cells underwent division through day 14, with essentially all of them GFP-negative (Additional file 1: Fig. S4A). d Cell populations predominantly expressing HIV-1 from unintegrated (GFPlow) or integrated HIV-1 (GFPhi) can be parsed in αCD3/CD28 activated T cells by accounting for cellular heterogeneity (side scatter [SSC] profile). Equivalent results were obtained utilizing the Int-D116N active site mutant (Additional file 1: Fig S1B)
Fig. 2
Fig. 2
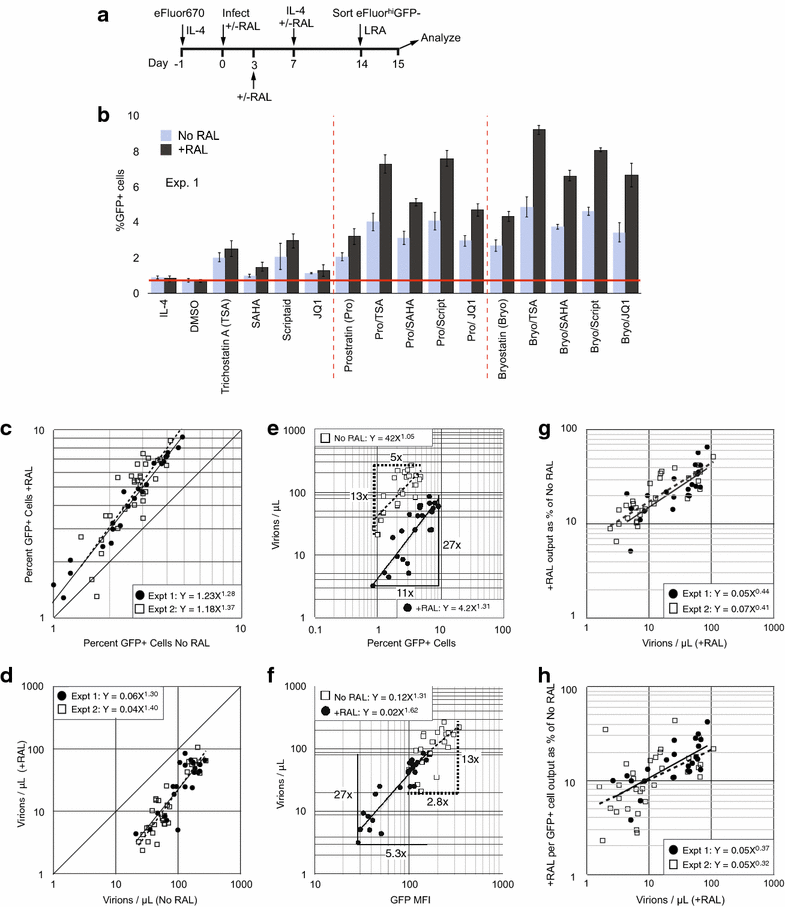
Activation of latent integration-competent HIV-1 and unintegrated HIV-1 with a panel of latency reversing agents (LRA). a Experimental design. Raltegravir was added on days 0, 3 and 7 and not removed until sorting. b The responses of latently infected cells to various LRAs under No RAL and +RAL conditions, expressed as the percentage of GFP+ cells 1 day after stimulation. Data from one experiment representative of >3 independent experiments with cells from different donors is shown. Each condition was tested in triplicate. Additional file 1: Figure S5 shows an independent experiment (Experiment 2 in Fig. 3c, d, g, h) employing an expanded panel of LRA. Similar results were obtained with the Integrase D116N mutant (not shown). c The percentage of GFP+ cells generated in the No RAL vs. the +RAL cultures for each LRA in two independent experiments from b (Expt. 1) and in Additional file 1: Fig. S5 (Expt. 2). Each symbol represents one LRA from Fig. 2b (Experiment 1) and S5 (Experiment 2). d Virus production from No RAL vs. +RAL cultures for both experiments. e The percentage of GFP+ cells generated by various LRAs vs. virus release into the culture medium to compare virus production per GFP+ cell. The dynamic range is shown for the number of GFP+ cells and for virus production as fold induction of the maximum over the minimum value. Data are from Expt. 1 and is representative of 3 additional independent experiments. f GFP Mean fluorescence intensity (MFI) of the GFP+ cells vs. virus production for No RAL and +RAL cells in Expt. 1. Similar results were obtained from Expt. 2 (not shown). The dynamic ranges are shown as in e. g Relationship between the strength of the LRA in inducing virus production (X axis) and the +RAL output expressed as a percent of the No RAL output. +RAL output reached 66 % of No RAL output for Bryostatin+ SAHA. h Relationship between the strength of the LRA in inducing virus production (X axis) and the +RAL output per GFP+ cell expressed as a percent of the No RAL output per GFP+ cell. ch All p ≤ 0.001
Fig. 3
Fig. 3
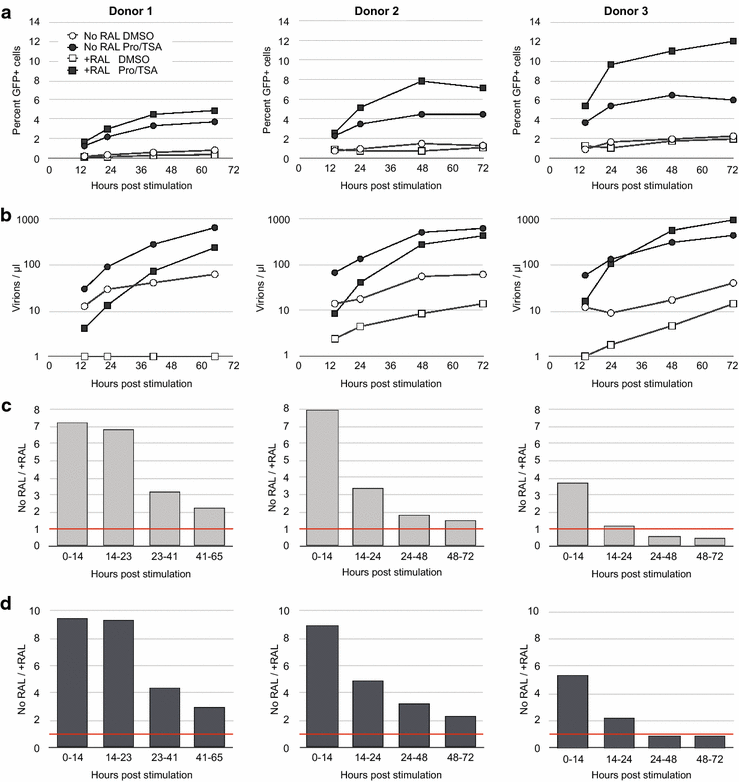
Kinetics of latency reversal and virus production from sorted GFP-negative cells following in vitro infection of resting CD4 T cells from 3 donors. The 14-day latency protocol from Fig. 2a was followed using cells from 3 HIV-negative donors following infection with equal amounts of HIV-1 in order to investigate kinetics of latent virus activation and donor variability. For added precaution against de novo infection, Indinavir was added at day 0 and 7 p.i., while efavirenz was added at day 5 p.i. for donors 2 and 3. a Percent GFP+ cells after Pro/TSA or DMSO carrier control treatment of sorted GFP-negative cells. Percent GFP+ cells prior to sort (No RAL, +RAL): Donor 1: 4.9 %, 3.3 %, Donor 2: 16.9 %, 22.4 %, Donor 3: 21.4 %, 17.3 %. b Virions released into culture medium measured by RT-qPCR for genomic viral RNA. Lower limit of quantitation was 1 virion/µl. c The difference in virus output from the No RAL and +RAL cultures decreases over time following latency reversal. Graphs present the ratio of No RAL virus output vs. +RAL virus output over the indicated interval. Output over each interval for No RAL and +RAL cells was calculated by subtracting the virions/µL at the earlier indicated time from the later time, then the ratio of No RAL/+RAL was graphed. For example, for Donor 1 during the first 14 h (“0–14”) the No RAL cells released 7.3 times as many virions as the +RAL cultures but over the 41–65 h interval, the No RAL cells release 2.2 times as many virions as the +RAL cells. Red line indicates equal output from the No RAL and +RAL cells. d The difference in virus output per GFP+ cell from the No RAL and +RAL cultures decreases over time following latency reversal. The ratio of No RAL virus output per GFP+ cell vs. +RAL virus output per GFP+ cell over the indicated interval. Output during each interval, calculated as in 3C was then divided by the percent GFP+ cells at the end of each interval. For example, for Donor 1 during the first 14 h (0–14) each GFP cell in the No RAL infections released 9.5 times as many virions as the +RAL GFP+ cells but during 41–65 h interval, the No RAL cells released 2.9 times as many virions per GFP+ cell. Red line indicates equal output from the No RAL and +RAL cells
Fig. 4
Fig. 4
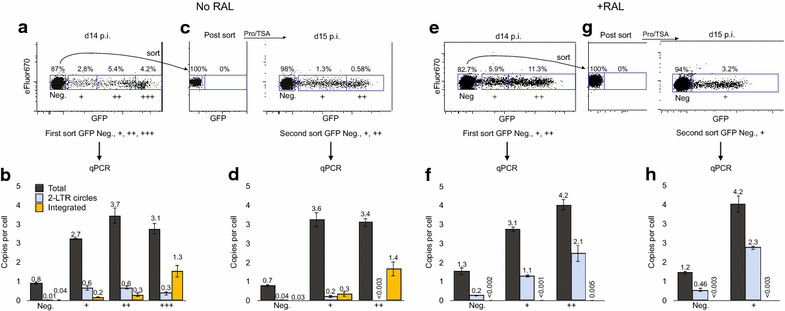
Distribution of integrated and unintegrated HIV-1 DNA after infection resting CD4 T cells and following latency reversal. Data are representative of 5 experiments (see Additional file 1: Table S1 for all experiments). Mean of triplicate PCR and SD are shown. ND none detected. a At Day 14 p.i., eFluorhi cells from No RAL cultures were sorted based on 4 levels of GFP fluorescence (blue boxes indicate sorting gates). b Sorted cells were analyzed by qPCR for total HIV-1 DNA, 2-LTR circles and integrated proviruses. c GFP-negative cells were sorted, then stimulated with Pro/TSA for 1 day, and then sorted a second time based on GFP expression. d Sorted cells were analyzed for viral DNA as in b. eh The procedures of ae were performed on raltegravir treated cells
Fig. 5
Fig. 5
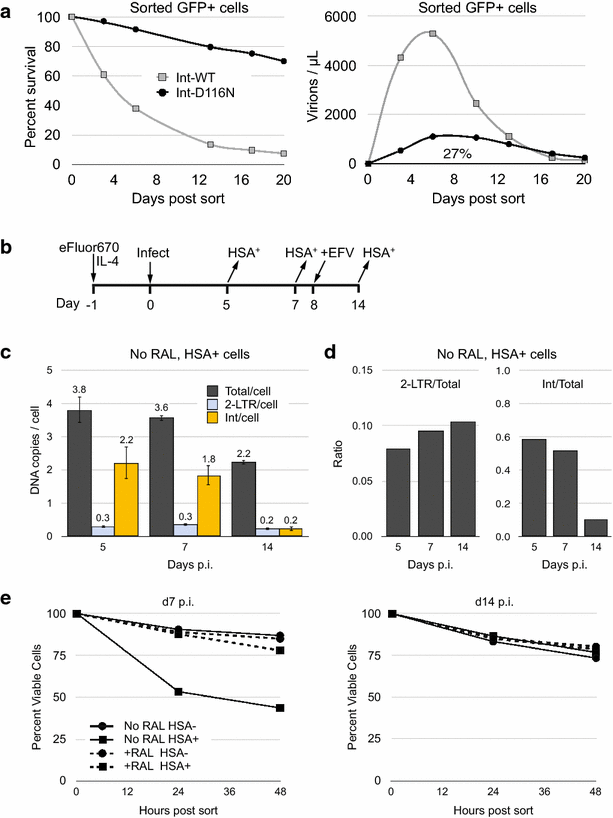
Preferential loss of resting CD4 T cells infected with integrated proviruses. a Productively infected GFP+ cells containing Int-WT or Int-D116N HIV-1 were sorted by FACS 7 days after infection and placed back into culture. Survival of the GFP+ cells was assessed by flow cytometry on the indicated days, and virus production from the FACS purified GFP+ cells was measured by RT-qPCR for viral RNA present in the culture medium as described [6]. In this experiment an Envelope+ virus was employed. b Experimental design for ce. Resting CD4 T cells infected with HSA-reporter viruses were maintained in IL-4 ± RAL for 14 days. At the indicated time points HSA+ cells in each sample were isolated using anti-HSA antibody coupled to magnetic beads. Efavirenz was added to all cells on day 8. HSA Positive and negative cells were separated using the MACS system. Cell survival was measured by forward and side scatter analysis. Data present one of two independent experiments. c Productively infected HSA+ cells purified from No RAL cultures at day 5, 7 and 14 p.i. were analyzed for viral DNA. d The ratios of 2-LTR/total HIV-1 DNA in comparison with the ratio of integrated/total HIV-1 DNA for No RAL purified HSA+ productively infected cells. e HSA+ and HSA-neg. cells were purified at day 7 and 14 p.i. and placed into fresh medium. Cell viability of these individual populations was monitored by flow cytometry over 48 h
Fig. 6
Fig. 6
A single round of maximum T cell activation does not induce the expression of all latent unintegrated or integrated viruses. a Experimental design. eFluorhiGFP-negative cells were sorted on day 14 p.i., then cells were stimulated with Pro/TSA, αCD3/CD28 beads or medium only control (Ø). Three days later (day 17) all GFP-negative cells were purified in a second sort and 30,000 cells per well were (re)stimulated in triplicate. Efavirenz was added on days 14 and 17 to sorted cells as an added precaution against virus spread. b Flow cytometric analysis of cells at the end of the first three day treatment. GFP+ cells (light grey dots) are overlaid on GFP-negative cells (black dots). Undivided cells lie above the red lines. c The percentage of GFP+ cells generated after the first round of stimulation calculated based on the total number of GFP+ of the cells placed in the wells on day 14. d Flow analysis of cells after the restimulation. Cells that remained GFP-negative after the first round of stimulation were sorted and equal numbers of these cells were re-stimulated with Pro/TSA, αCD3/CD28beads or medium alone (Ø). e The percentage of GFP+ cells generated after the second round of stimulation calculated based on the total number of GFP+ of the cells placed in the wells on day 17. Mean and SD for each condition are shown
Fig. 7
Fig. 7
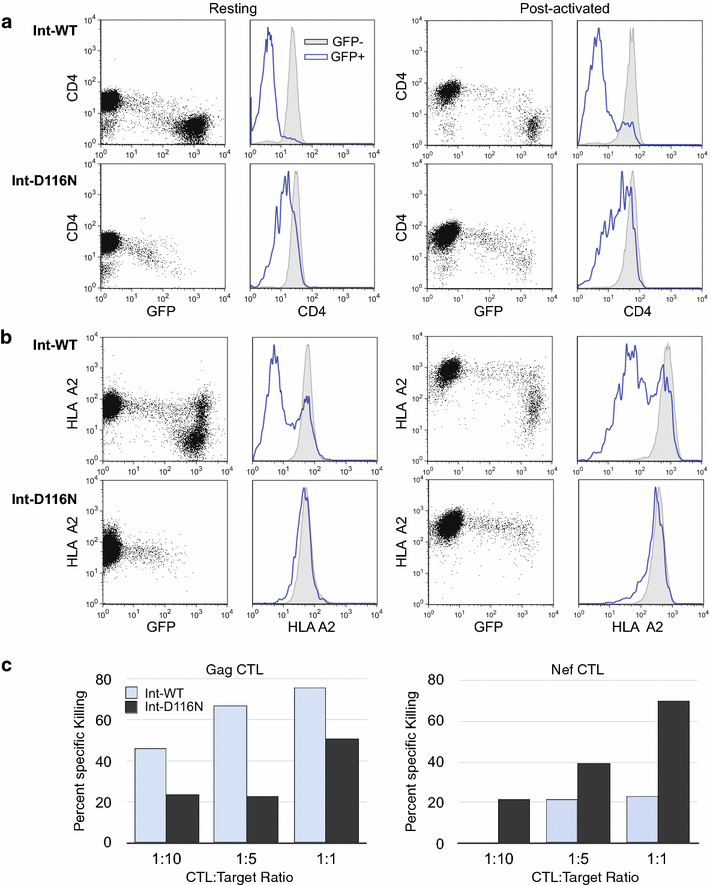
Gene expression from uDNA fails to down modulate HLA Class I but is efficiently recognized by HIV-1-specific CTL. a Unintegrated HIV-1 down modulates CD4 in both resting (left) and activated (right) CD4 T cells. Resting IL-4 treated CD4 T cells were infected then analyzed 6 days after infection with Integrase wild type (Int-WT) or Integrase mutant (Int-D116N) HIV-1 GFP reporter viruses (left). One half of the cells were then activated with αCD3/CD28 beads then analyzed 2 days later (right). Activation caused a loss of a portion of GFP+ cells, resulting in fewer GFP+ at the time of analysis. The positive control CD4 down modulation data for the integrase WT virus was also a positive control in [43]. b Only integration-competent HIV-1 down modulates HLA A2 in resting (left) and post-infection activated (right) CD4 T cells. Cells were treated as in A but stained with an anti-HLA A2 antibody. c CD8+ cytotoxic T cells that recognize defined Gag and Nef epitopes (see materials and methods) specifically kill GFP+ cells infected with Int-WT or Int-D116N HIV-1. Killing was measured by loss of GFP+ cells, with non-specific killing of HLA Class I mismatched controls subtracted from the total. One of two representative experiments is shown

References

    1. Shaw GM, Hahn BH, Arya SK, Groopman JE, Gallo RC, Wong-Staal F. Molecular characterization of human T-cell leukemia (lymphotropic) virus type III in the acquired immune deficiency syndrome. Science. 1984;226(4679):1165–1171. doi: 10.1126/science.6095449. - DOI - PubMed
    1. Pang S, Koyanagi Y, Miles S, Wiley C, Vinters HV, Chen IS. High levels of unintegrated HIV-1 DNA in brain tissue of AIDS dementia patients. Nature. 1990;343(6253):85–89. doi: 10.1038/343085a0. - DOI - PubMed
    1. Cara A, Reitz MS., Jr New insight on the role of extrachromosomal retroviral DNA. Leukemia. 1997;11(9):1395–1399. doi: 10.1038/sj.leu.2400776. - DOI - PubMed
    1. Sloan RD, Wainberg MA. The role of unintegrated DNA in HIV infection. Retrovirology. 2011;8:52. doi: 10.1186/1742-4690-8-52. - DOI - PMC - PubMed
    1. Wu Y, Marsh JW. Selective transcription and modulation of resting T cell activity by preintegrated HIV DNA. Science. 2001;293(5534):1503–1506. doi: 10.1126/science.1061548. - DOI - PubMed

Publication types