. 2016 Jan 5:6:18743.
doi: 10.1038/srep18743.

Messenger RNA delivery of a cartilage-anabolic transcription factor as a disease-modifying strategy for osteoarthritis treatment

Affiliations

Messenger RNA delivery of a cartilage-anabolic transcription factor as a disease-modifying strategy for osteoarthritis treatment

Hailati Aini et al. Sci Rep. .

Abstract

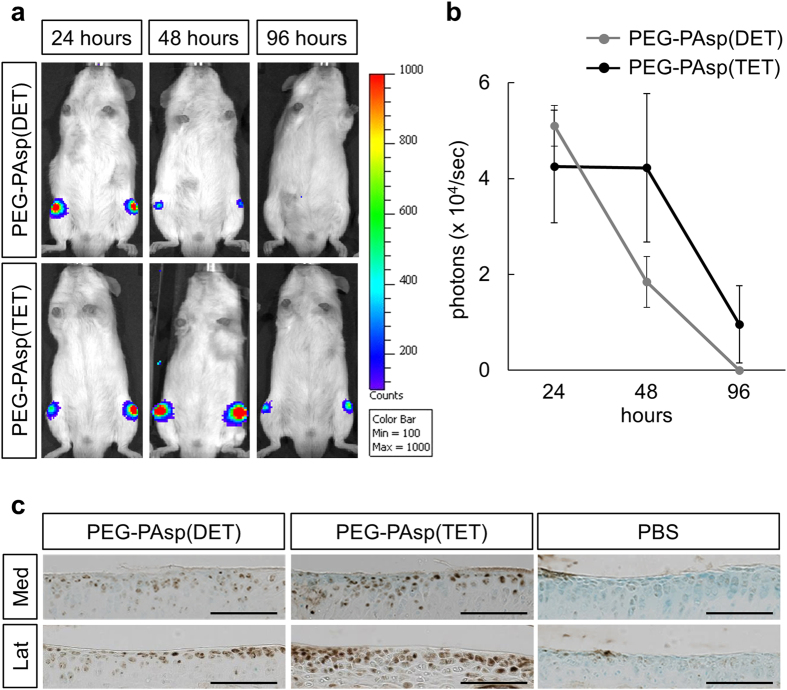
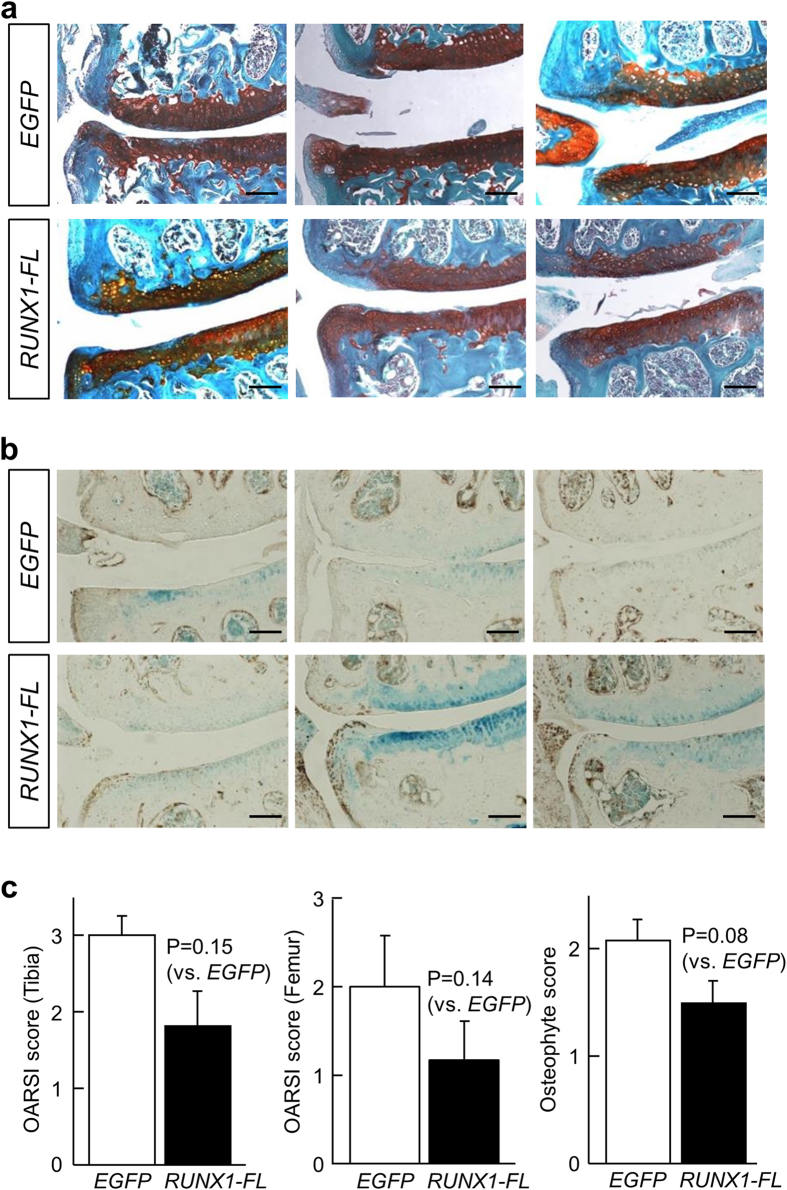
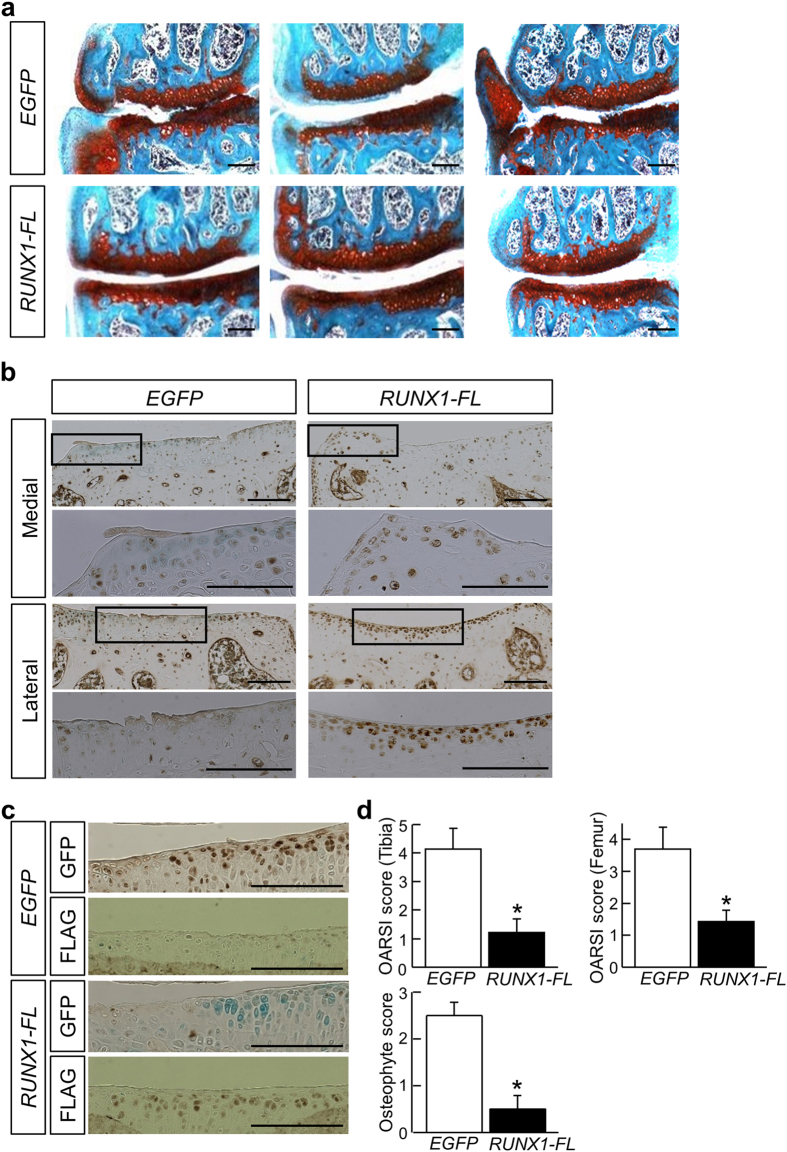
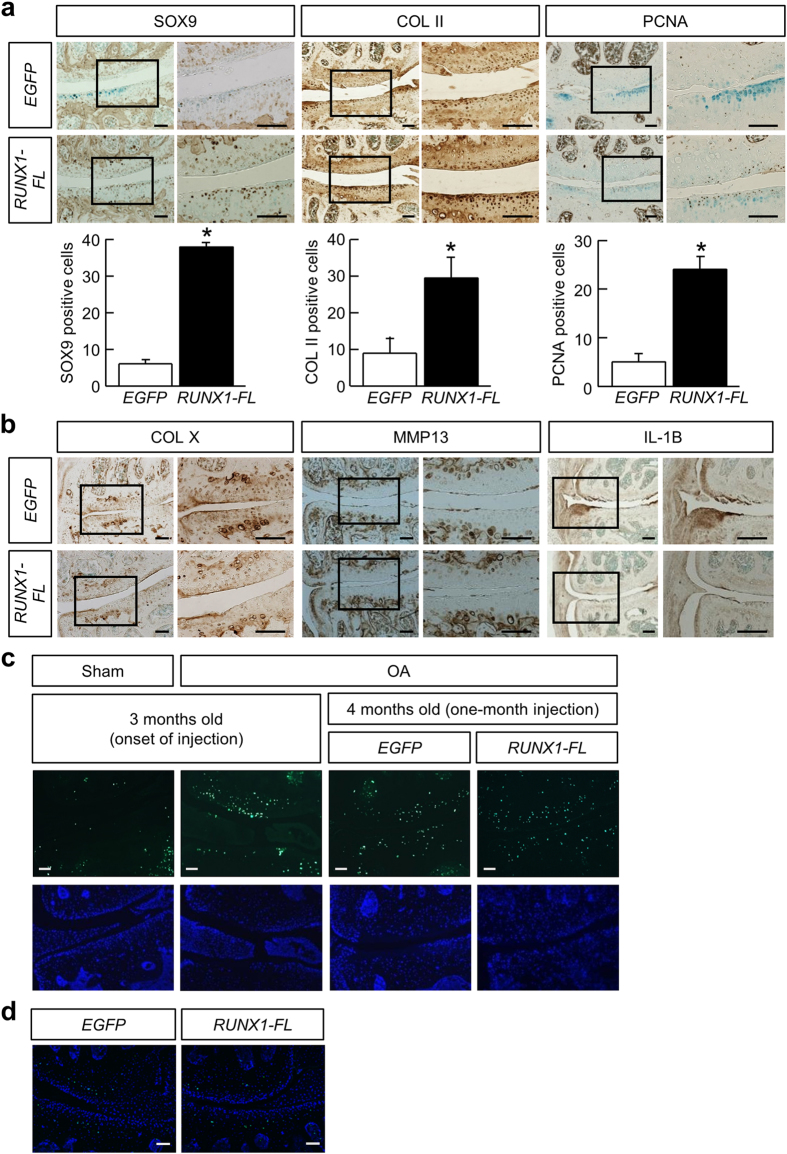
Osteoarthritis (OA) is a chronic degenerative joint disease and a major health problem in the elderly population. No disease-modifying osteoarthritis drug (DMOAD) has been made available for clinical use. Here we present a disease-modifying strategy for OA, focusing on messenger RNA (mRNA) delivery of a therapeutic transcription factor using polyethylene glycol (PEG)-polyamino acid block copolymer-based polyplex nanomicelles. When polyplex nanomicelles carrying the cartilage-anabolic, runt-related transcription factor (RUNX) 1 mRNA were injected into mouse OA knee joints, OA progression was significantly suppressed compared with the non-treatment control. Expressions of cartilage-anabolic markers and proliferation were augmented in articular chondrocytes of the RUNX1-injected knees. Thus, this study provides a proof of concept of the treatment of degenerative diseases such as OA by the in situ mRNA delivery of therapeutic transcription factors; the presented approach will directly connect basic findings on disease-protective or tissue-regenerating factors to disease treatment.


Figures

Figure 1
Figure 1. Protein expression from the reporter gene mRNA delivered into the articular cartilage using polyplex nanomicelles.
(a) Expression of luciferase from mRNA that was delivered to mouse knee joints using polyplex nanomicelles. PEG-PAsp(DET) or PEG-PAsp(TET) polyplex nanomicelle solutions carrying 1 μg luc2 mRNA was injected once into intact knee joints of ICR mice. Luciferase expression was analyzed by the IVIS imaging system at the indicated hours after the injection. Four knees were used for the analysis, and representative images are shown. (b) Quantification of the IVIS data obtained in (a). (c) Expression of GFP from mRNA that was delivered to mouse knee joints using polyplex nanomicelles. PEG-PAsp(DET) or PEG-PAsp(TET) nanomicelle solutions carrying 1 μg EGFP mRNA was injected into intact knee joints. Phosphate buffered saline (PBS) was injected as a control. Samples were collected at 4 days after the injection and subjected to the immunohistochemical analysis using an anti-GFP antibody. Brown spots indicate positive staining. Counter staining was performed with methyl green. Med, medial site of the articular cartilage; Lat; lateral site of the articular cartilage. Scale bars, 100 μm.
Figure 2
Figure 2. Histological analysis of mouse OA knee joints exposed to intra-articular injections of PEG-PAsp(DET) polyplex nanomicelles carrying RUNX1-FL or EGFP mRNA.
(a) Images of representative sections stained with safranin-O after one month of intra-articular injection of 1 μg RUNX1-FL or EGFP mRNA-loaded PEG-PAsp(DET) polyplex nanomicelles. Scale bars, 100 μm. (b) Immunostaining on the serial sections of (a) using an anti-RUNX1 antibody. Brown spots indicate positive staining. Counter staining was performed with methyl green. Scale bars, 100 μm. (c) Scoring of OA status with the OARSI scoring system and the osteophyte scoring system. The score of normal cartilage is 0. Data are expressed as the mean ± SD (N = 10).
Figure 3
Figure 3. Histological analysis of mouse OA knee joints exposed to intra-articular injection of PEG-PAsp(TET) polyplex nanomicelles carrying RUNX1-FL or EGFP mRNA.
(a) Images of representative sections stained with safranin-O after one month of intra-articular injection of 1 μg RUNX1-FL or EGFP mRNA-loaded PEG-PAsp(TET) polyplex nanomicelles. Scale bars, 100 μm. (b) Immunostaining of tibias using an anti-RUNX1 antibody on representative sections in (a). Brown spots indicate positive staining. Counter staining was performed with methyl green. Images of medial and lateral sites are shown. Medial sites were supposed to be more afflicted by the OA induction than lateral sites. Inset boxes indicate the magnified region shown below each image. Scale bars, 100 μm. (c) Immunostaining of tibias using anti-FLAG and anti-GFP antibodies on representative sections in (a). Brown spots indicate positive staining. Counter staining was performed with methyl green. Scale bars, 100 μm. (d) Scoring of OA status with both the OARSI scoring system and the osteophyte scoring system. The score of normal cartilage is 0. Data are expressed as the mean ± SD (N = 10). *P < 0.05 versus the EGFP mRNA-injected group.
Figure 4
Figure 4. Immunohistochemical analyses of mouse OA knee joints exposed to intra-articular injection of PEG-PAsp(TET) polyplex nanomicelles carrying RUNX1-FL or EGFP mRNA.
(a) Immunostaining using anti-Sox9, anti-type II collagen, and anti-PCNA antibodies on sections after one month of intra-articular injection of 1 μg RUNX1-FL or EGFP mRNA-loaded PEG-PAsp(TET) polyplex nanomicelles. Brown spots indicate positive staining. Counter staining was performed with methyl green. Inset boxes indicate the magnified region shown on the right of each image. Scale bars, 100 μm. Quantitative data of stained cells are shown below each image. Data are expressed as the mean ± SD (N = 3). *P < 0.05 versus the EGFP mRNA-injected group. (b) Immunostaining using anti-type X collagen, anti-MMP13, and anti- IL-1ß antibodies on sections after one-month intra-articular injection of 1 μg RUNX1-FL or EGFP mRNA-loaded PEG-PAsp(TET) polyplex nanomicelles. Brown spots indicate positive staining. Counter staining was performed with methyl green. Inset boxes indicate the magnified regions shown on the right of each image. Scale bars, 100 μm. (c) TUNEL staining of the indicated groups. Green spots indicate apoptotic cells in upper panels. DAPI images of the identical sections are also shown at the bottom of each section. Scale bars, 100 μm. (d) TUNEL staining of the lateral side of knees analyzed in (c). Scale bars, 100 μm.

Similar articles

Cited by

References

    1. Hawker G. A. & Stanaitis I. Osteoarthritis year in review 2014: clinical. Osteoarthritis Cartilage 22, 1953–1957 (2014). - PubMed
    1. Felson D. T. et al. Osteoarthritis: new insights. Part 1: the disease and its risk factors. Ann. Intern. Med. 133, 635–646 (2000). - PubMed
    1. Cross M. et al. The global burden of hip and knee osteoarthritis: estimates from the global burden of disease 2010 study. Ann. Rheum. Dis. 73, 1323–1330 (2014). - PubMed
    1. Arden N. & Nevitt M. C. Osteoarthritis: epidemiology. Best Pract. Res. Clin. Rheumatol. 20, 3–25 (2006). - PubMed
    1. Reginster J. Y. & Khaltaev N. G. Introduction and WHO perspective on the global burden of musculoskeletal conditions. Rheumatology (Oxford) 41 Supp 1, 1–2 (2002). - PubMed

Publication types

MeSH terms