. 2016 Jan 5:7:10281.
doi: 10.1038/ncomms10281.

Stepwise B-cell-dependent expansion of T helper clonotypes diversifies the T-cell response

Affiliations

Stepwise B-cell-dependent expansion of T helper clonotypes diversifies the T-cell response

Julia Merkenschlager et al. Nat Commun. .

Abstract

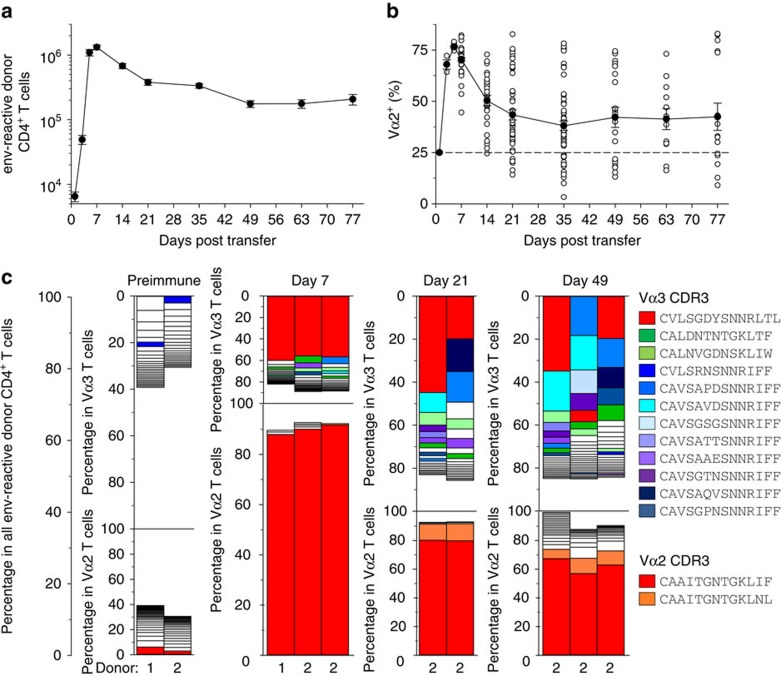
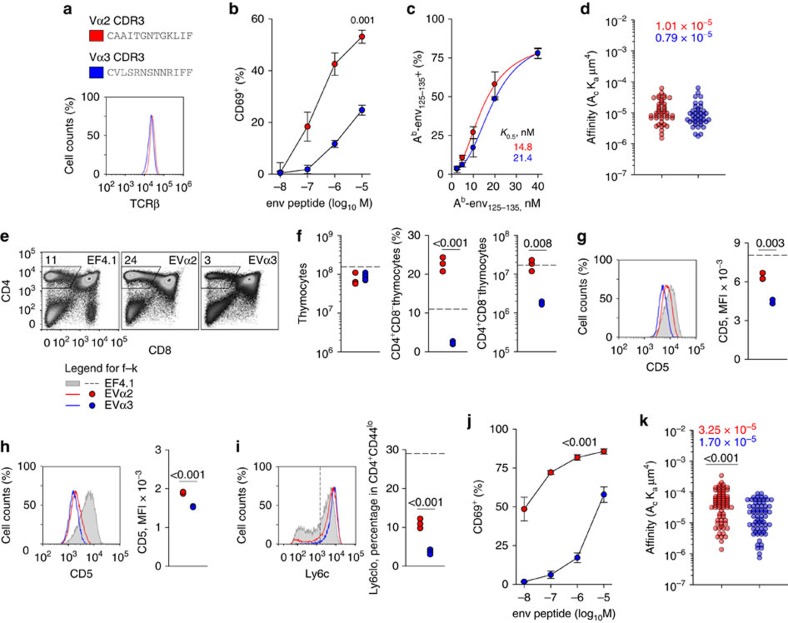
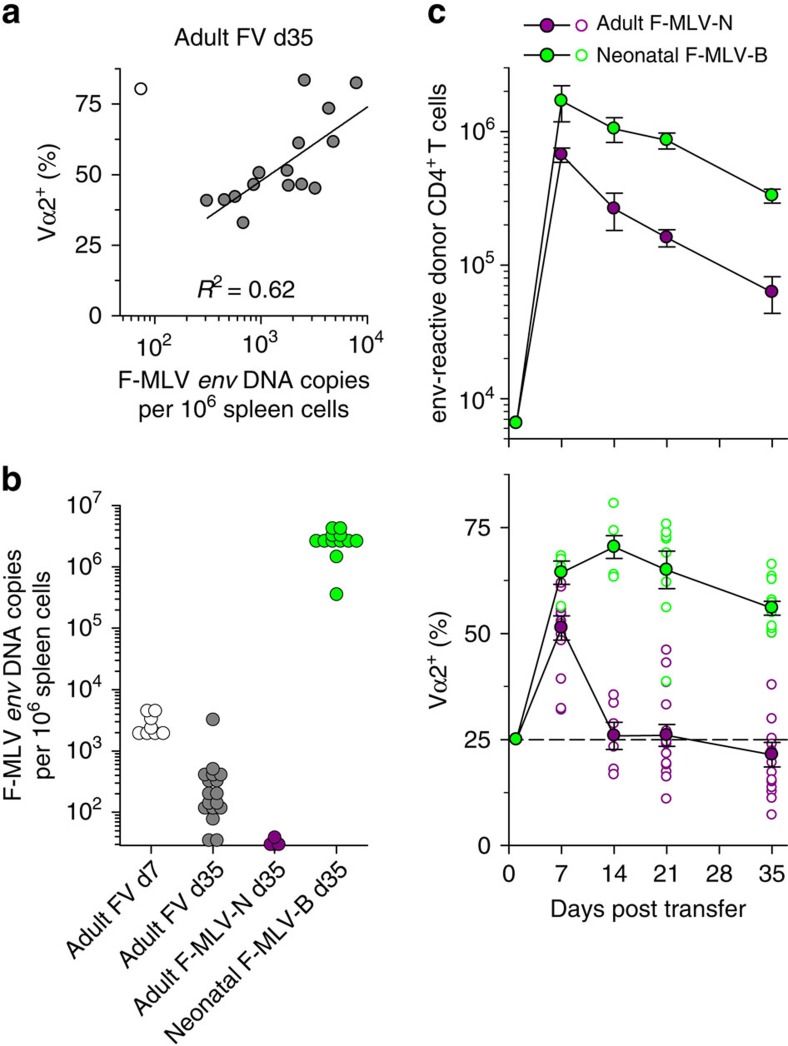
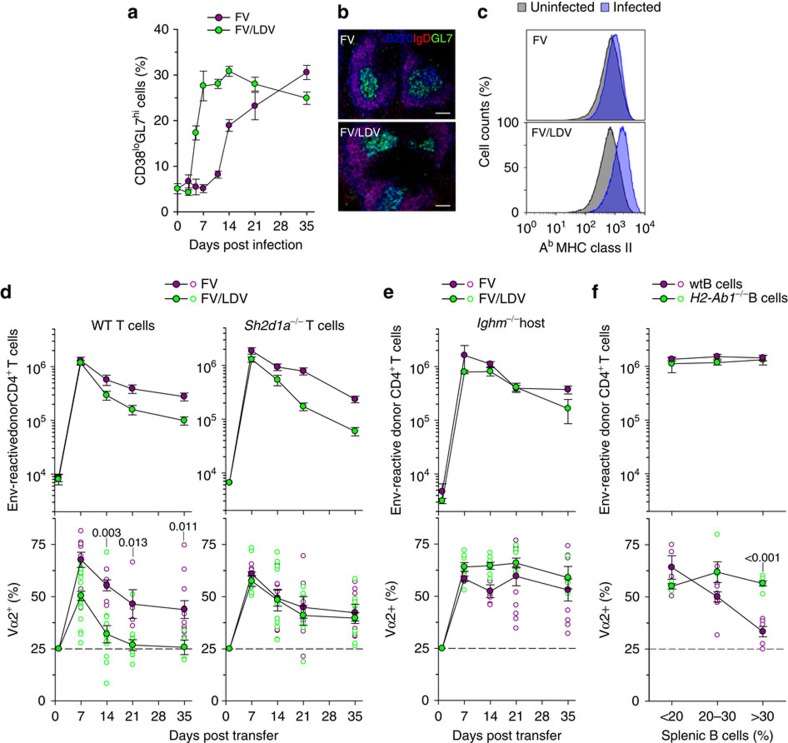
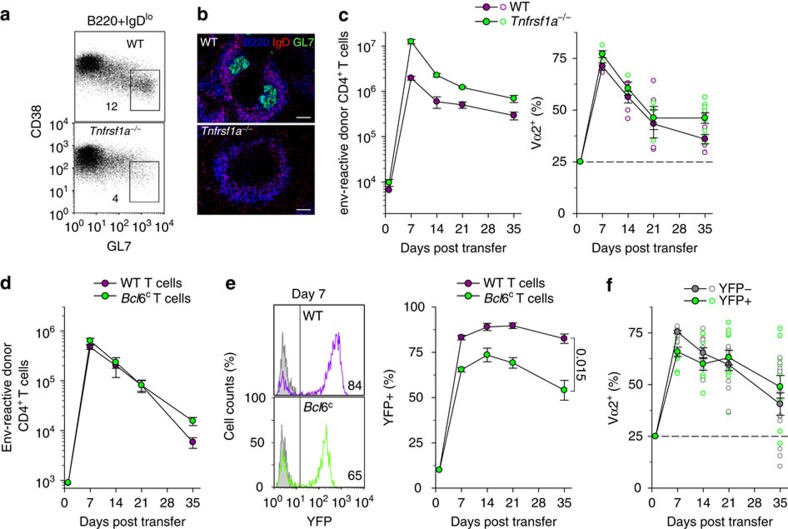
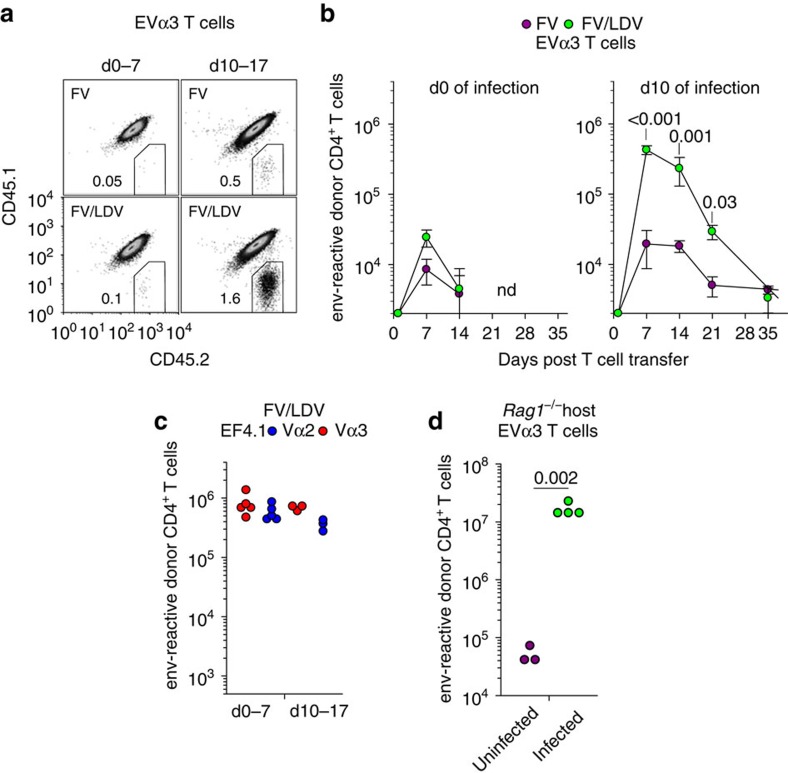
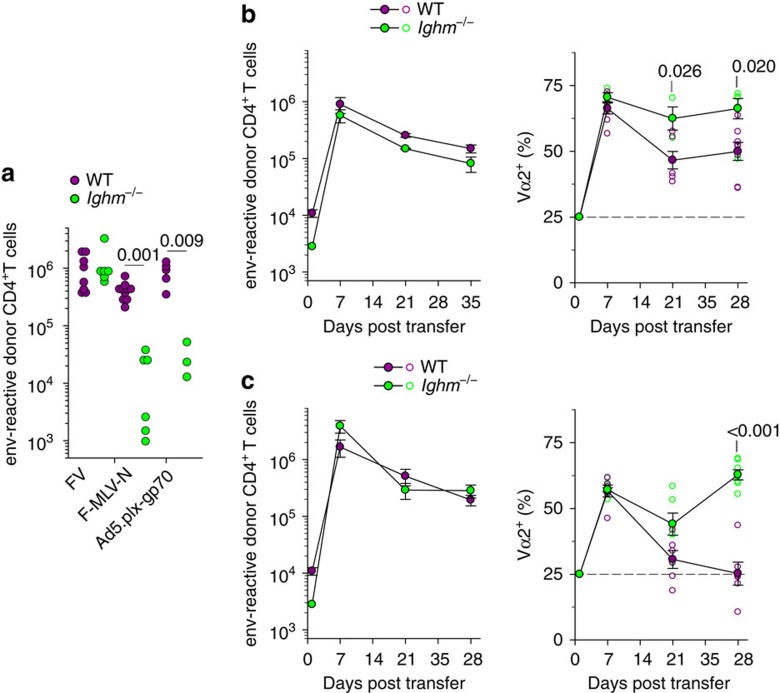
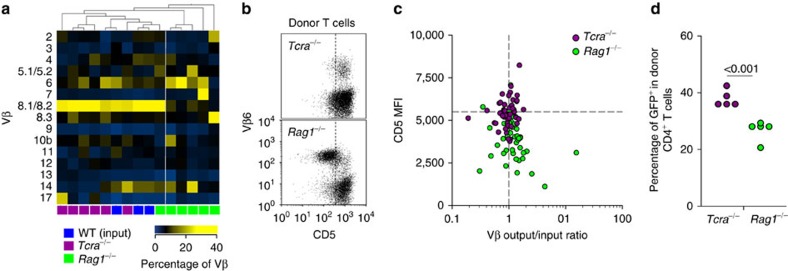
Antigen receptor diversity underpins adaptive immunity by providing the ground for clonal selection of lymphocytes with the appropriate antigen reactivity. Current models attribute T cell clonal selection during the immune response to T-cell receptor (TCR) affinity for either foreign or self peptides. Here, we report that clonal selection of CD4(+) T cells is also extrinsically regulated by B cells. In response to viral infection, the antigen-specific TCR repertoire is progressively diversified by staggered clonotypic expansion, according to functional avidity, which correlates with self-reactivity. Clonal expansion of lower-avidity T-cell clonotypes depends on availability of MHC II-expressing B cells, in turn influenced by B-cell activation. B cells clonotypically diversify the CD4(+) T-cell response also to vaccination or tumour challenge, revealing a common effect.


Figures

Figure 1
Figure 1. Clonotypic diversity of virus-specific CD4+ T cells increases over the course of FV infection.
(a) Absolute numbers and (b) Vα composition of env-reactive donor EF4.1 CD4+ T cells in the spleens of recipient mice after adoptive T-cell transfer and FV infection (n=9–61 mice per time point; P<0.001 between Vα2 frequency on day 7 and any later time point, Mann–Whitney rank sum test). (c) Frequency of various Vα2 and Vα3 clonotypes in total EF4.1 CD4+ T cells from two uninfected donor mice (preimmune; donors 1 and 2) or in env-reactive EF4.1 CD4+ T cells from the spleens of recipient mice after adoptive T-cell transfer from the indicated donor and FV infection. Each bar graph represents an individual mouse. Clonotypes with frequencies <0.5% are not plotted for simplicity. Identical clonotypes within Vα2 and Vα3 subsets are marked with the same color, with red color indicating the dominant Vα2 and Vα3 clonotypes. The scale of the Vα2 and Vα3 plots are adjusted to the relative ratio of the two subsets at a given time point.
Figure 2
Figure 2. Development and reactivity with self and foreign antigen of monoclonal EVα2 and EVα3 T cells.
(a) CDR3 sequences and TCRβ expression levels in two hybridoma cells lines representing the indicated clonotypes. (b) Responsiveness of the same hybridoma cells lines as in a to overnight stimulation with env122–141 peptide, measured by CD69 upregulation (n=2). (c) Frequency of Ab-env125–135 tetramer-positive cells, at different tetramer concentration, following staining of the same hybridoma cells lines as in a and normalized for TCR expression. Symbols represent the means (±s.e.m., n=2) of experimental data, whereas lines are fits using a four-parameter Hill equation. Numbers next to the regression lines denote apparent affinity (K0.5) estimates. (d) Effective two-dimensional TCR affinities for Ab-env125–135 of T-cell hybridomas measured by the micropipette adhesion frequency assay and normalized by TCR surface density. Each individual data point represents the affinity of a single T cell. Numbers in the plot represent the effective affinity geometric mean of the population. (e) Flow cytometric analysis of thymocyte development in EF4.1, EVα2 and EVα3 TCR-transgenic mice. (f) Absolute number of total thymocytes and frequency and number of CD4 single-positive thymocytes in the same mice as in e. (g) CD5 levels in post-selection (CD4+CD8TCRhigh) thymocytes from the same mice as in e. (h) CD5 levels in naive splenic CD4+ T cells from EVα2 and EVα3 mice. (i) Ly6c levels in naive splenic CD4+ T cells from the same mice. In fi, each symbol represents an individual mouse from one representative of two experiments. Horizontal dashed lines represent the mean values for control EF4.1 mice. (j) Responsiveness of EVα2 and EVα3 T cells to overnight env124–138 peptide stimulation. Responses were measured by CD69 upregulation and are plotted as means (±s.e.m., n=3–4). (k) Effective two-dimensional TCR affinities for Ab-env125–135 of primary T cells measured by the micropipette adhesion frequency assay and normalized by TCR surface density, and plotted as described in d.
Figure 3
Figure 3. Effect of infection kinetics on the clonal composition of virus-specific CD4+ T cells.
(a) Frequency of Vα2+ cells within env-reactive donor EF4. 1 CD4+ T cells plotted against copies of F-MLV env DNA in the spleens of recipient mice 35 days after adoptive T-cell transfer and FV infection. Symbols represent individual mice. The mouse represented with an open symbol was excluded from the regression analysis. (b) Copies of F-MLV env DNA in the spleens of recipient mice that were infected as adults with FV or F-MLV-N or as neonates with F-MLV-B. All recipients received EF4.1 CD4+ T cells as adults and analysed at the indicated time point after T-cell transfer. Each symbol is an individual mouse. The dashed line denotes the detection limit. (c) Absolute numbers (top) and Vα composition (bottom) of env-reactive donor EF4.1 CD4+ T cells in the spleens of recipient mice after T-cell adoptive transfer in adult mice either infected with F-MLV-N at the time of T-cell transfer or with F-MLV-B as neonates (n=4–15 mice per time point; P<0.001 between the two types of host on days 14–35, Mann–Whitney rank sum test). Closed symbols are the means (±s.e.m.); open symbols are individual mice; the dashed line represents the frequency of Vα2+ cells in preimmune env-reactive EF4.1 CD4+ T cells.
Figure 4
Figure 4. Clonal replacement in virus-specific CD4+ T cells requires cognate B-cell interaction.
(a) Frequency of germinal center-phenotype (CD38loGL7hi) cells in CD19+IgDlo splenic B cells over the course of FV infection or FV/LDV coinfection (n=4–13; P<0.002 between the two infections on days 5–14, Mann–Whitney rank sum test). (b) Germinal center (B220+IgDGL7+) presence in the spleen of the same mice in a 35 days post infection. The scale bar is 250 μm. (c) MHC II expression in B220+CD19+ B cells from the spleen of the same mice in a 7 days post infection, compared with uninfected mice. (P=0.0016 between the two infections, Student's t-test). (d) Absolute numbers (top) and Vα composition (bottom) of WT (left) or Sh2d1a−/− (right) env-reactive donor EF4.1 CD4+ T cells in the spleens of recipient mice after adoptive T-cell transfer and FV infection (n=3–8 mice per time point) or FV/LDV coinfection (n=3–9 mice per time point). (e) Absolute numbers (top) and Vα composition (bottom) of env-reactive donor EF4.1 CD4+ T cells in the spleens of WT or Ighm−/− recipient mice after adoptive T-cell transfer and FV infection (n=4–11 mice per time point) or FV/LDV coinfection (n=4–23 mice per time point). (f) Absolute numbers (top) and Vα composition (bottom) of env-reactive donor EF4.1 CD4+ T cells in the spleens of Ighm−/− mice previously reconstituted with WT (n=18) or H2-Ab1−/− B cells (n=14) 14 days after adoptive T-cell transfer FV/LDV coinfection, plotted against the level of B-cell reconstitution. In df, closed symbols are the means (±s.e.m.); open symbols are individual mice.
Figure 5
Figure 5. Clonal replacement in virus-specific CD4+ T cells independently of Bcl6-dependent Tfh differentiation or germinal center reaction.
(a) Frequency of germinal center-phenotype (CD38loGL7hi) cells in CD19+IgDlo splenic B cells 35 days after FV infection of WT or Tnfrsf1a−/− mice (n=3). (b) Germinal center (B220+IgDGL7+) presence in the spleen of the same mice in a. The scale bar is 250 μm. (c) Absolute numbers (left) and Vα composition (right) of env-reactive donor EF4.1 CD4+ T cells in the spleens of WT or Tnfrsf1a−/− recipient mice after adoptive T-cell transfer and FV infection (n=3–9 mice per time point). (d) Absolute numbers of WT or Bcl6-conditional (Bcl6c) env-reactive donor EF4.1 CD4+ T cells, additionally carrying the Tnfrsf4Cre and Gt(ROSA)26SorYFP alleles, in the spleens of recipient mice after adoptive T-cell transfer and FV infection (n=3–9 mice per time point). (e) YFP expression on day 7 (left) and frequency of YFP+ cells over time (right) in the same env-reactive donor EF4.1 CD4+ T cells as in d. (f) Vα2 frequency in YFP+ and YFP Bcl6-conditional env-reactive donor EF4.1 CD4+ T cells as in d. In cf, closed symbols are the means (±s.e.m.); open symbols are individual mice.
Figure 6
Figure 6. Asynchronous expansion of higher- and lower-avidity clonotypes.
(a) Flow cytometric detection of CD45.2+ donor EVα3 Rag1−/− Emv2−/− CD4+ T cells and CD45.1+CD45.2+ host CD4+ T cells following transfer either on the day of infection (d0 of infection, d0–7) or 10 days after infection (d10 of infection, d10–17) with FV or FV/LDV. In both setups, T-cell expansion was analysed 7 days after transfer (n=5–9). (b) Absolute number of env-reactive donor EVα3 CD4+ T cells recovered from the spleens of the same recipients described in a over the course of FV infection or FV/LDV coinfection (nd, not detected). (c) Absolute number of Vα2 or Vα3 env-reactive donor EF4.1 CD4+ T cells recovered from the spleens of FV/LDV infected recipients 7 days after transfer either on the day of infection (d0–7) or 10 days after infection (d10–17). (d) Numbers of EVα3 T cells recovered 7 days after transfer from the spleens of lymphocyte-deficient Rag1−/− Emv2−/− recipients that were either left uninfected or were F-MLV-B-infected. Each symbol represents an individual mouse.
Figure 7
Figure 7. B-cell-dependent expansion of lower-avidity CD4+ T-cell clonotypes in diverse infection or immunization settings.
(a) Absolute number of env-reactive donor EF4.1 CD4+ T cells 7 days after transfer into WT or Ighm−/− recipient mice infected either with FV or F-MLV-N or immunized with Ad5.pIX-gp70. Each symbol is an individual mouse. (b) Absolute numbers (left) and Vα composition (right) of env-reactive donor EF4.1 CD4+ T cells in the spleens of WT or Ighm−/− recipient mice after adoptive T-cell transfer and FBL-3 tumor challenge (n=3–8 mice per time point). (c) Absolute numbers (left) and Vα composition (right) of env-reactive donor EF4.1 CD4+ T cells in the spleens of WT or Ighm−/− recipient mice after adoptive T-cell transfer and env122–141 peptide immunization (n=6–9 mice per time point).
Figure 8
Figure 8. Balanced TCR diversity during CD4+ T-cell reconstitution requires B cells.
(a) Heat-map of hierarchically-clustered WT donors and Tcra−/− or Rag1−/− Emv2−/− recipients of purified CD4+ T cells according to the frequency of the indicated Vβ family before (WT (input)) or 21 days after T-cell reconstitution (Tcra−/− or Rag1−/−). Each column is an individual mouse. (b) Flow cytometric detection of CD5 and Vβ6 expression in donor CD4+ T cells from the same recipients as in a. (c) CD5 median fluorescent intensity (MFI) plotted against the divergence from the input frequency of each detected Vβ family in donor CD4+ T cells from the same recipients as in a. Only three recipients are plotted for clarity. The horizontal dashed line represents the CD5 MFI in control cells (P<0.001 between CD5 levels in T cells from the two types of host, Mann–Whitney rank sum test). (d) Frequency of GFP+ cells in donor CD4+ T cells 21 days after T-cell reconstitution of Tcra−/− or Rag1−/− Emv2−/− (Rag1−/−) recipients with purified CD4+ T cells from Nur77-GFP transgenic donors. Each symbol represents an individual mouse.

References

    1. Turner S. J., Doherty P. C., McCluskey J. & Rossjohn J. Structural determinants of T-cell receptor bias in immunity. Nat. Rev. Immunol. 6, 883–894 (2006). - PubMed
    1. Stritesky G. L., Jameson S. C. & Hogquist K. A. Selection of self-reactive T cells in the thymus. Annu. Rev. Immunol. 30, 95–114 (2012). - PMC - PubMed
    1. Thorborn G., Young G. R. & Kassiotis G. Effective T helper cell responses against retroviruses: are all clonotypes equal? J. Leukoc. Biol. 96, 27–37 (2014). - PubMed
    1. Morris G. P. & Allen P. M. How the TCR balances sensitivity and specificity for the recognition of self and pathogens. Nat. Immunol. 13, 121–128 (2012). - PubMed
    1. Gett A. V., Sallusto F., Lanzavecchia A. & Geginat J. T cell fitness determined by signal strength. Nat. Immunol. 4, 355–360 (2003). - PubMed

Publication types