. 2016 Mar;26(3):301-14.
doi: 10.1101/gr.198473.115. Epub 2016 Jan 4.

The life history of retrocopies illuminates the evolution of new mammalian genes

Affiliations

The life history of retrocopies illuminates the evolution of new mammalian genes

Francesco Nicola Carelli et al. Genome Res. 2016 Mar.

Abstract

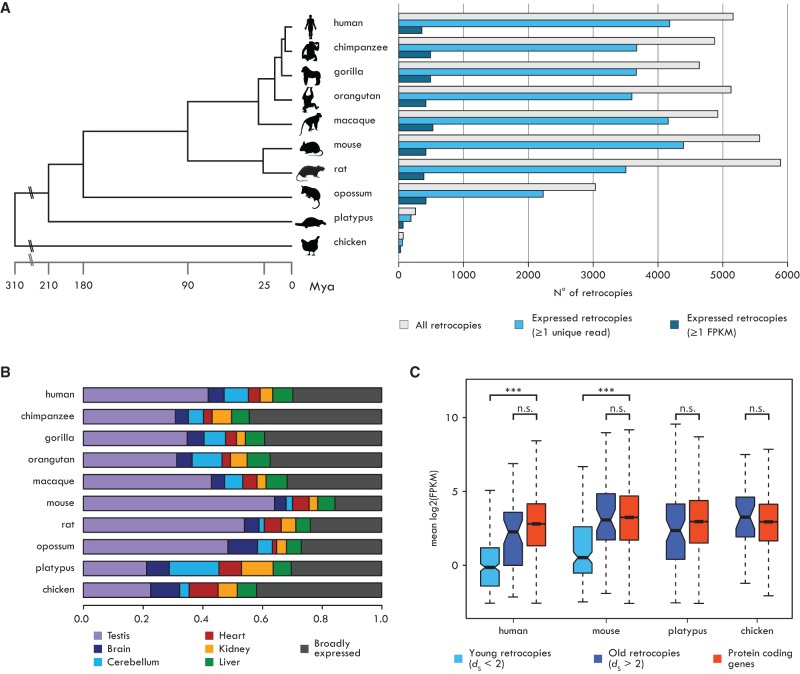
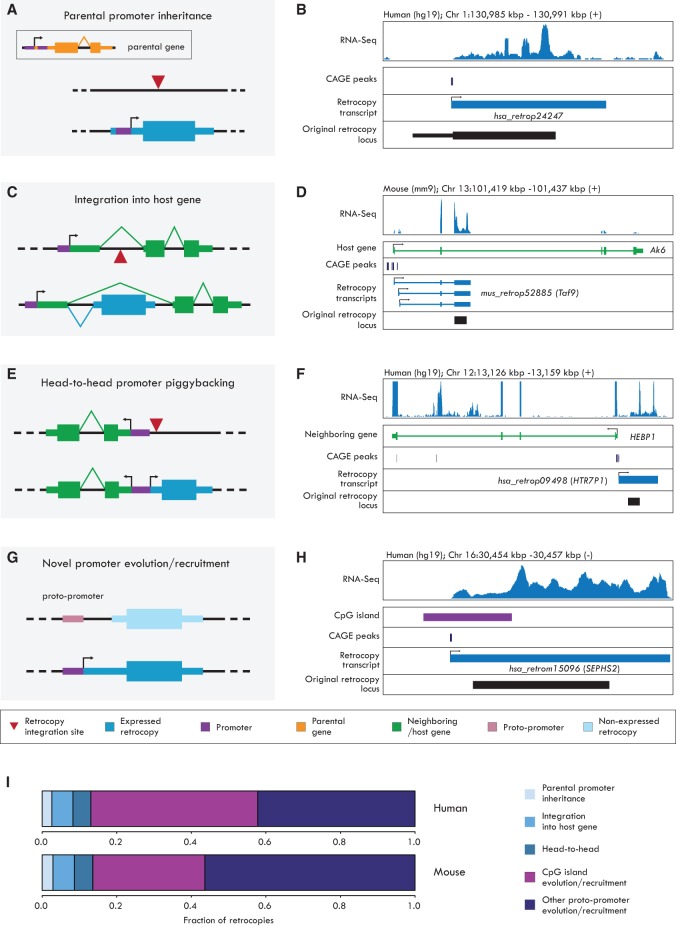
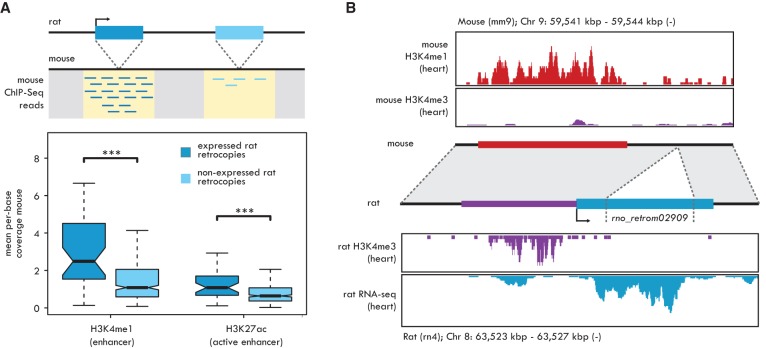
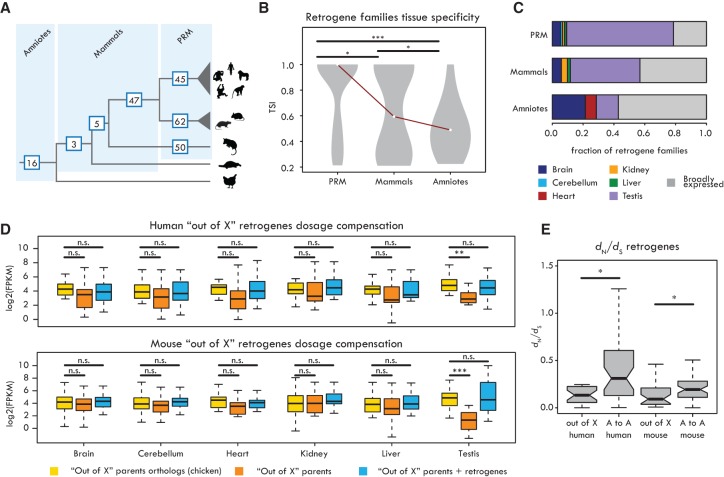
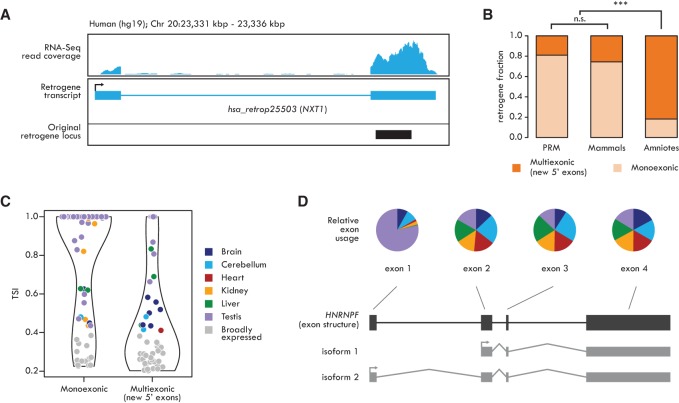
New genes contribute substantially to adaptive evolutionary innovation, but the functional evolution of new mammalian genes has been little explored at a broad scale. Previous work established mRNA-derived gene duplicates, known as retrocopies, as models for the study of new gene origination. Here we combine mammalian transcriptomic and epigenomic data to unveil the processes underlying the evolution of stripped-down retrocopies into complex new genes. We show that although some robustly expressed retrocopies are transcribed from preexisting promoters, most evolved new promoters from scratch or recruited proto-promoters in their genomic vicinity. In particular, many retrocopy promoters emerged from ancestral enhancers (or bivalent regulatory elements) or are located in CpG islands not associated with other genes. We detected 88-280 selectively preserved retrocopies per mammalian species, illustrating that these mechanisms facilitated the birth of many functional retrogenes during mammalian evolution. The regulatory evolution of originally monoexonic retrocopies was frequently accompanied by exon gain, which facilitated co-option of distant promoters and allowed expression of alternative isoforms. While young retrogenes are often initially expressed in the testis, increased regulatory and structural complexities allowed retrogenes to functionally diversify and evolve somatic organ functions, sometimes as complex as those of their parents. Thus, some retrogenes evolved the capacity to temporarily substitute for their parents during the process of male meiotic X inactivation, while others rendered parental functions superfluous, allowing for parental gene loss. Overall, our reconstruction of the "life history" of mammalian retrogenes highlights retroposition as a general model for understanding new gene birth and functional evolution.


Figures

Figure 1.
Figure 1.
Expression profiles of mammalian retrocopies. (A, left) Phylogenetic relationships and divergence times (in million years) of the investigated species. (Right) Numbers of annotated retrocopies (gray bars), retrocopies with evidence of expression (one or more unique reads; light blue bars), and retrocopies with robust expression (≥1 FPKM; dark blue bars). (B) Proportions of robustly expressed retrocopies with tissue-specific (TSI ≥ 0.4) or broad (TSI < 0.4) expression. (C) Mean expression levels across six organs for robustly expressed retrocopies and annotated protein-coding genes. Human and mouse retrocopies were subdivided into two age classes based on their dS. As most platypus and chicken retrocopies have high dS values, no age distinction was performed. Significant differences (Mann-Whitney U test with Benjamini-Hochberg correction): (***) P < 0.001; (n.s.) P > 0.05. Whiskers up to 1.5 times the interquartile range; outliers removed for graphical purposes.
Figure 2.
Figure 2.
Mechanisms of retrocopy promoter acquisition. Schematic representations (A,C,E,G) and examples (B,D,F,H) of retrocopy promoter gain mechanisms. In A,C,E,G, the gene structures are depicted as thick boxes (coding exons/exon parts), thin boxes (UTRs), and connecting lines (introns). In A,C,E,G, the upper part shows the genomic locus before (A,C,E) or upon (G) the retrocopy integration; the lower part shows the locus after the gain/recruitment of the retrocopy promoter. B,D,F,H show (from top to bottom) the RNA-seq coverage (all reads from all samples); the location of CAGE peaks; the assembled retrocopy transcript(s), with exons defined by blue boxes and introns as blue lines; and the original retrocopy locus (coding part). (A) A parental gene transcript generated from an upstream promoter carries an alternative downstream promoter from which the retrocopy will be expressed. (B) The hsa_retrop24247 human retrocopy promoter corresponds to a parentally inherited sequence (thin black box), suggesting that an alternative parental promoter was present in the retrotransposed mRNA. (C) Retrocopy integration into a host gene and generation of a chimeric transcript through splicing. (D) The mus_retrop52885 mouse retrocopy (Taf9) expresses three alternative chimeric transcripts containing exons of its host gene Ak6. The three isoforms are generated by alternative transcription start sites as indicated by the presence of multiple CAGE peaks. (E) Retrocopy expression driven by the bidirectional promoter of an upstream gene. (F) The hsa_retrop09498 (HTR7P1) human retrocopy promoter has been recruited from the neighboring gene HEBP1. (G) Retrocopy integration in proximity to a proto-promoter sequence, which will evolve as a novel retrocopy promoter. (H) The hsa_retrom15096 (SEPHS2) human retrocopy promoter overlaps a CpG island (purple box) not associated to any other gene, indicating that this sequence has been recruited or evolved as a putative novel promoter. (I) Relative contribution of promoter acquisition mechanisms in human and mouse retrocopies.
Figure 3.
Figure 3.
Enhancer-derived retrocopy promoters. (A, top) The integration loci of rat-specific robustly expressed (dark blue box) and not expressed (light blue box) retrocopies are mapped on the mouse genome (dotted lines). Mouse ChIP-seq reads are extracted from the regions surrounding the orthologous integration sites, indicated in yellow. (Bottom) Mouse H3K4me1 and H3K27ac mean per-base ChIP-seq coverage measured at the orthologous integration sites of rat-specific retrocopies. Significant differences (Mann-Whitney U test with Benjamini-Hochberg correction): (***) P < 0.001. Whiskers up to 1.5 times the interquartile range; outliers removed for graphical purposes. (B) Co-option of the rat-specific retrocopy rno_retrom02909 promoter from an enhancer element. (Top) H3K4me1 (red) and H3K4me3 (purple) ChIP-seq profiles from mouse heart. (Middle) Representation of the rat rno_retrom02909 retrocopy locus and its syntenic mouse region. The original integration locus is indicated by dotted lines. The blue box represents the assembled transcript. The red box, indicating the heart-specific mouse enhancer, is found upstream of the integration locus of the retrocopy and corresponds to its actual promoter region, shown in purple. Both the mouse enhancer and the rat promoter regions correspond to ChIP-seq peaks defined in this study (enhancer) or obtained from Rintisch et al. (2014). (Bottom) H3K4me3 ChIP-seq (purple) and RNA-seq (blue) profiles from rat heart. H3K4me3 coverage obtained from the sample “lv-H3K4me3-BXH06-male-bio1-tech1” from Rintisch et al. (2014).
Figure 4.
Figure 4.
“Out of testis” and “out of X” patterns. (A) Number of retrogene families specific of each clade indicated on the respective branch. (PRM) Retrogenes specific to primates (excluding great ape–specific ones), rodents, or marsupials. (B) Tissue specificity index (TSI) distribution of retrogene families (median TSI of each family) from different evolutionary age categories. Significant differences (Kolmogorov-Smirnov test with Benjamini-Hochberg correction): (***) P < 0.001; (*) P < 0.05. (C) Proportions of retrogenes with tissue-specific (TSI ≥ 0.5) or broad (TSI < 0.5) expression for different age categories. (D) Expression levels of chicken orthologs of parental genes of “out of X” retrogenes (yellow), “out of X” parental genes (orange), and combined expression of “out of X” retrogenes and parental genes (blue) in human (19 retrogenes) and mouse (23 retrogenes). Retrogenes compensate for the significant decrease in parental gene expression only in testis. Significant differences (Wilcoxon signed-rank test with Benjamini-Hochberg correction): (***) P < 0.001; (**) P < 0.01; (n.s.) P > 0.05. (E) dN/dS ratios between “out of X” and “autosome to autosome” (“A to A”) retrogenes in human and mouse. Significant differences (Mann-Whitney U test with Benjamini-Hochberg correction): (*) P < 0.05. Whiskers up to 1.5 times the interquartile range; outliers are removed for graphical purposes.
Figure 5.
Figure 5.
Structural evolution of retrogenes. (A) Transcript structure of the human retrogene hsa_retrop25503 (NXT1) shows the emergence of a new 5′ exon. Black box depicts the original retrocopy locus (coding part). (B) Fractions of human monoexonic and multiexonic (only new 5′ exons) retrogene families from different evolutionary age categories. Significant differences (Fisher's exact test with Benjamini-Hochberg correction): (***) P < 0.001; (n.s.) P > 0.05. (C) Tissue specificity of human monoexonic and multiexonic (only new 5′ exons) retrogenes. The violin plots indicate retrogene TSI distribution; TSI of each retrogene is indicated by colored (when TSI ≥ 0.4, representing tissue with highest expression) or gray (TSI < 0.4) dots. (D, top) Fraction of unique read counts (normalized by the number of reads mapped on the whole gene) from each organ mapping on the human HNRNPF. Exon 1 is significantly more highly transcribed in testis (DEXSeq analysis, Benjamini-Hochberg-corrected P < 0.01). Color code as in C. (Bottom) exon structure (black) and alternative transcripts (gray) of the HNRNPF gene.
Figure 6.
Figure 6.
Evolution of orphan retrogenes. (A) Orphan retrogenes are derived from a retroposition event followed by the pseudogenization of the parental gene. (B) Expression divergence between retrogenes and their parental genes, calculated as the Euclidean distance (ED) between the median expression levels across species for each of the six organs. Benjamini-Hochberg-corrected P-values obtained comparing EDs of orphan and other retrogenes with a Mann-Whitney U test. (C, top) Expression profile of the orphan retrogene RNF113 in different clades. For primates and rodents, the expression profiles represent median values across different species. Dark and light green bars indicate the expression levels from two independently originated RNF113 duplicates in primates and rodents, respectively. (B) brain; (C) cerebellum; (H) heart; (K) kidney; (L) liver; (T) testis. (Bottom) Reconstruction of the RNF113 retrogene evolution. Tree nodes indicated by squares correspond to gene duplication events (blue, retroposition; green, duplication mechanism not determined); other nodes correspond to speciation events. (D) Expression profile (median expression across species) of parental genes of orphan and nonorphan retrogenes and annotated protein-coding genes. Significant differences (Mann-Whitney U test with Benjamini-Hochberg correction): (**) P < 0.01; (*) P < 0.05; (n.s.) P > 0.05. Whiskers up to 1.5 times the interquartile range; outliers removed for graphical purposes.

References

    1. Abyzov A, Iskow R, Gokcumen O, Radke DW, Balasubramanian S, Pei B, Habegger L, Lee C, Gerstein M. 2013. Analysis of variable retroduplications in human populations suggests coupling of retrotransposition to cell division. Genome Res 23: 2042–2052. - PMC - PubMed
    1. Anders S, Reyes A, Huber W. 2012. Detecting differential usage of exons from RNA-seq data. Genome Res 22: 2008–2017. - PMC - PubMed
    1. Andersson R, Sandelin A, Danko CG. 2015. A unified architecture of transcriptional regulatory elements. Trends Genet 31: 426–433. - PubMed
    1. Bai Y, Casola C, Betrán E. 2008. Evolutionary origin of regulatory regions of retrogenes in Drosophila. BMC Genomics 9: 241. - PMC - PubMed
    1. Bayat V, Thiffault I, Jaiswal M, Tétreault M, Donti T, Sasarman F, Bernard G, Demers-Lamarche J, Dicaire MJ, Mathieu J, et al. 2012. Mutations in the mitochondrial methionyl-tRNA synthetase cause a neurodegenerative phenotype in flies and a recessive ataxia (ARSAL) in humans. PLoS Biol 10: e1001288. - PMC - PubMed

Publication types