. 2016 Jan 5:6:18694.
doi: 10.1038/srep18694.

A deleterious role for Th9/IL-9 in hepatic fibrogenesis

Affiliations

A deleterious role for Th9/IL-9 in hepatic fibrogenesis

Shan-yu Qin et al. Sci Rep. .

Abstract

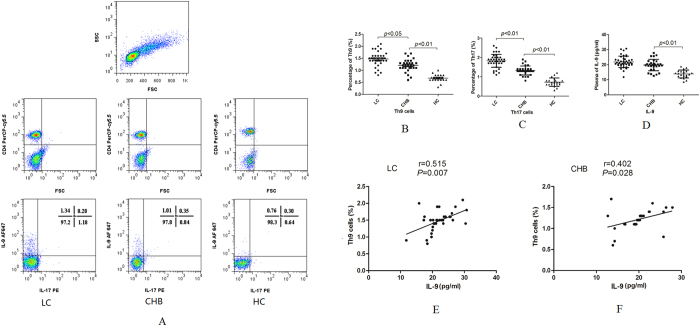
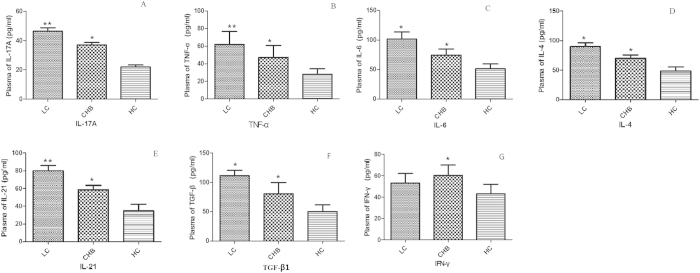
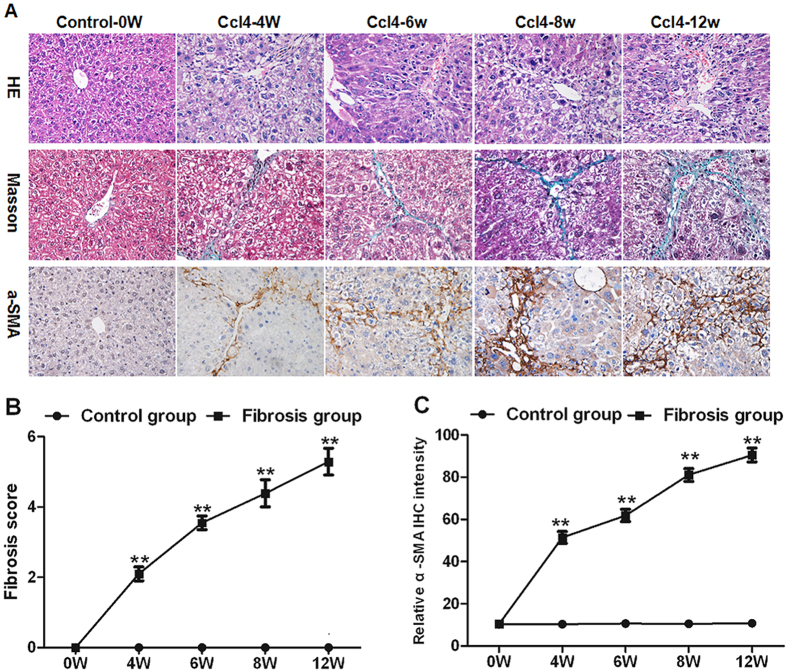
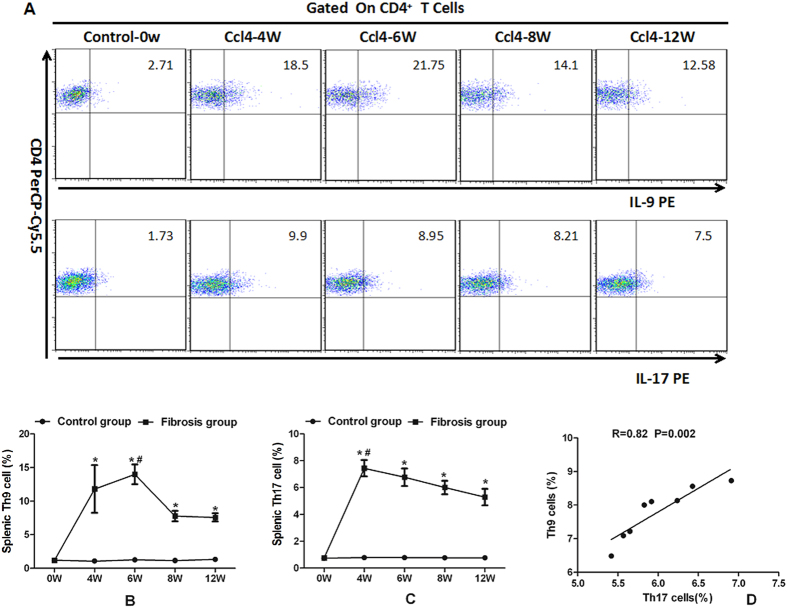
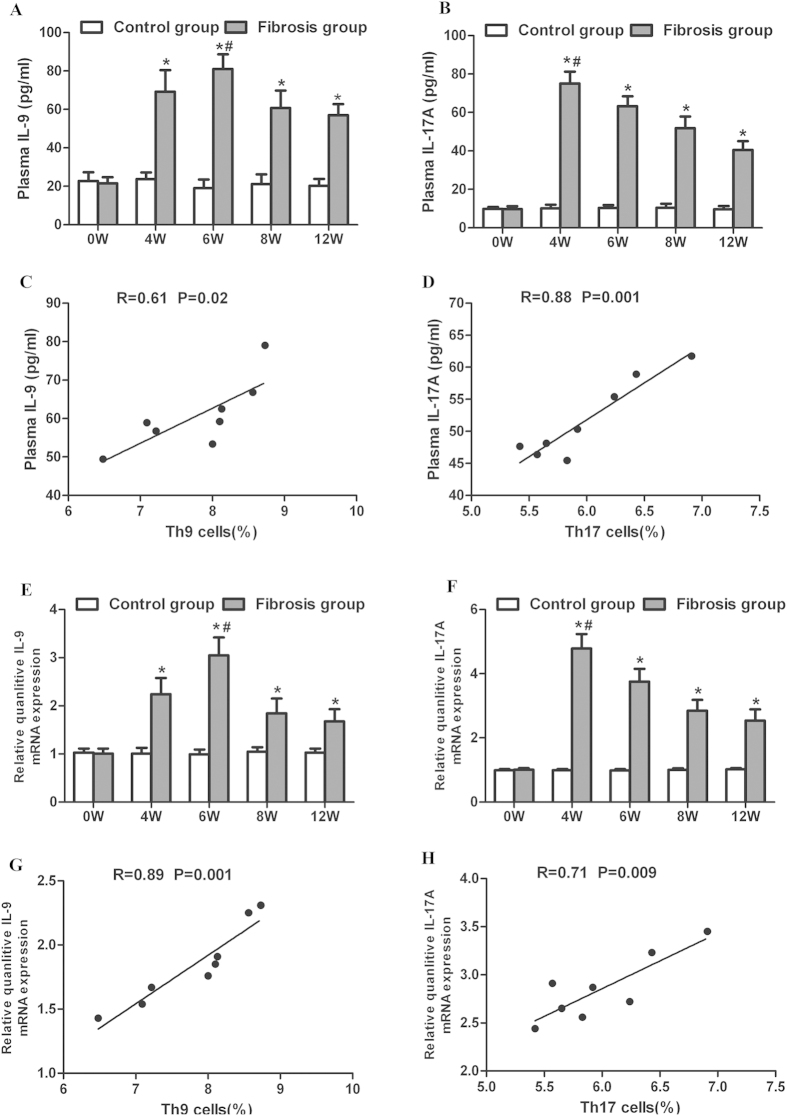
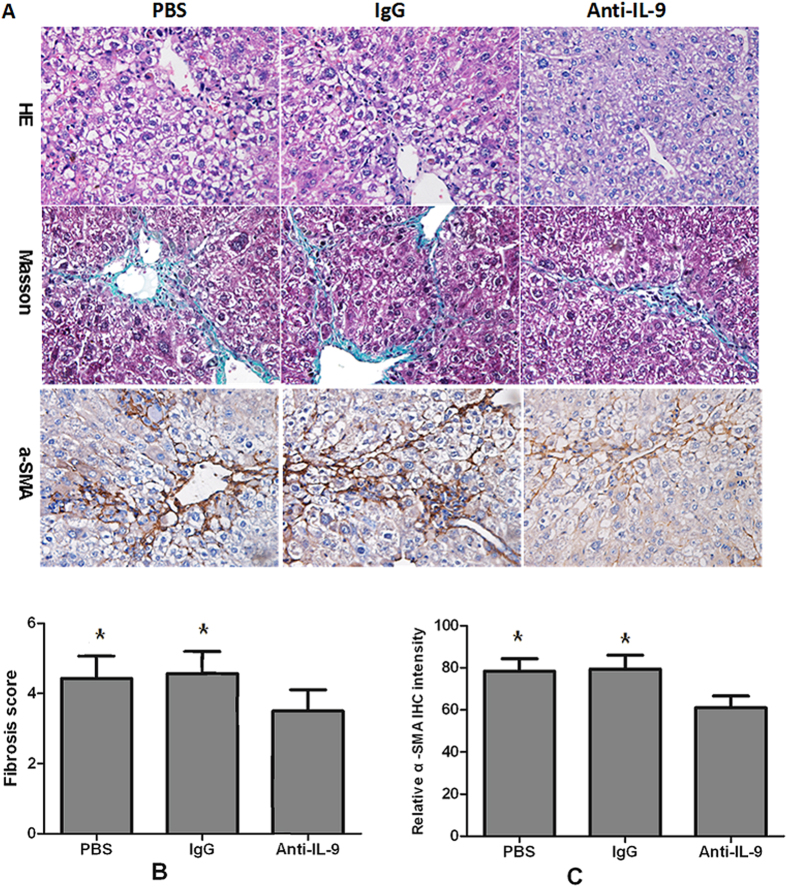
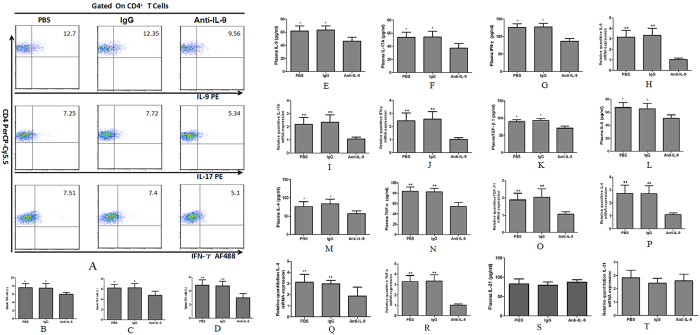
T helper 9 (Th9) cells, a recently recognized Th cell subset, are involved in autoimmune diseases. We aimed to investigate the role of Th9/interleukin-9 (IL-9) in the pathogenesis of hepatic fibrosis. Th9 and Th17 cells were quantified in chronic hepatitis B (CHB) patients with hepatic fibrosis, HBV-associated liver cirrhosis (LC) patients and healthy controls (HC). The percentages of Th9 and Th17 cells, concentrations of IL-9 and IL-17, as well as expression of IL-17, TNF-α, IL-6, IL-4, IL-21, TGF-β1 and IFN-γ were significantly increased in plasma of CHB and LC patients compared with those in HC. Splenic Th9 and Th17 cells, plasma concentrations and liver expression of IL-9 and IL-17A were significantly elevated in mice with hepatic fibrosis compared with controls. Neutralization of IL-9 in mice ameliorated hepatic fibrosis, attenuated the activation of hepatic stellate cells, reduced frequencies of Th9, Th17 and Th1 cells in spleen, and suppressed expression of IL-9, IL-17A, IFN-γ, TGF-β1, IL-6, IL-4 and TNF-α in plasma and liver respectively. Our data suggest a deleterious role of Th9/IL-9 in increasing hepatic fibrosis and exacerbating disease endpoints, indicating that Th9/IL9 based immunotherapy may be a promising approach for treating hepatic fibrosis.


Figures

Figure 1
Figure 1. Plasma Th9, Th17 cells and IL-9 in patients with liver cirrhosis (LC), chronic hepatitis B (CHB) associated liver fibrosis and healthy controls (HC).
(A) Characterization of plasma CD4+ Th-cell populations by flow cytometry in LC, CHB and HC subjects. Total lymphocytes were measured (panels in the first row) and CD4+ T cells were analyzed (panels in the second row). The percentages of Th9 cells (IL-9+ CD4+ cells) and Th17 (IL-17+CD4+ cells) in LC, CHB patients and HC are shown in the third row. (BC) Comparison of percentages of Th9 and Th17 cells between LC, CHB patients and HC. (D) Comparison of plasma levels of IL-9 between LC, CHB patients and HC. (E) Correlation between levels of IL-9 and percentages of Th9 cells in plasma of LC patients. (F) Correlation between levels of IL-9 and percentages of Th9 cells in plasma of CHB patients.
Figure 2
Figure 2
Comparisons of plasma levels of (A) IL-17A, (B) TNF-α, (C) IL-6, (D) IL-4, (E) IL-21, (F) TGF-β1 and (G) IFN-γ between LC, HB and HC groups. *p-values < 0.05, **p < 0.01.
Figure 3
Figure 3. The severity of liver fibrosis in CCl4 administrated mice from 0 to 12 weeks.
(A) Histology was evaluated by H&E staining. Fibrillar collagen deposition was assessed by Masson staining (original magnification, ×400). Activated HSCs in liver sections were quantified by immunohistochemical staining of alpha-smooth muscle actin (α-SMA) (original magnification, ×400). (B) Change of liver fibrosis score from 0 to 12 weeks after CCl4 administration. (C) Change of relative intensity of α-SMA from 0 to 12 weeks. The mean number of α-SMA-positive cells in five ocular fields per specimen was assessed as a percentage area at 400× magnification. **p <  0.01 vs. control subgroups sacrificed at the same time point. Data are shown as mean ± SD.
Figure 4
Figure 4. Percentages of splenic Th9 and Th17 cells significantly increased in mice with hepatic fibrosis.
(A) Characterization of splenic Th9 and Th17 cells by flow cytometry in CCl4 administrated mice at the 0th, 4th, 6th, 8th and 12th week. (B) Change of percentages of splenic Th9 cells in mice at different time points. (C) Change of percentages of splenic Th17 cells in mice at different time points. *p < 0.05 vs. controls sacrificed at the same time point; #p < 0.05 vs. other subgroups with fibrosis. Data are presented as mean ± SD. (D) Correlation between splenic Th9 and Th17 cells in mice with liver fibrosis at the 8th week.
Figure 5
Figure 5. plasma levels and liver expression of IL-9 and IL-17A in mice with hepatic fibrosis.
(A–B) Plasma levels of IL-9 and IL-17A in CCl4 administrated mice at the 0th, 4th, 6th, 8th and 12th week. (C) Correlation between plasma IL-9 levels and splenic Th9 percentages in the mouse model of hepatic fibrosis at the 8th week. (D) Correlation between plasma IL-17 and splenic Th17 cells in the mouse model of hepatic fibrosis at the 8th week. (E–F) Liver expression of IL-9 and IL-17A in CCl4 administrated mice at the 0th, 4th, 6th, 8th and 12th week. (G) Correlation between liver expression of IL-9 and percentages of splenic Th9 cells in mice at the 8th week. (H) Correlation between liver expression of IL-17 and percentages of splenic Th17 cells in mice at the 8th week. *p < 0.01 vs. controls sacrificed at the same time point. #p < 0.05 vs. other subgroups with fibrosis. Data are presented as mean ± SD.
Figure 6
Figure 6. anti-IL-9Ab attenuated the severity of hepatic fibrosis.
(A) Histology was assessed by H&E staining. Fibrillar collagen deposition was evaluated by Masson staining (original magnification, ×400). Activated HSCs in liver sections were quantified by immunohistochemical staining of alpha-smooth muscle actin (α-SMA) (original magnification: ×400). (B) Comparison of Ishak fibrosis score between anti-IL-9Ab, PBS and IgG treated groups. (C) Comparison of relative intensity of α-SMA in anti-IL-9Ab, PBS and IgG treated groups. **p < 0.01 compared with control PBS or IgG treated mice. Data are shown as mean ± SD.
Figure 7
Figure 7. The percentages of splenic Th9, Th17 and Th1 cells, plasma secretion and liver expression of the relevant cytokines in IL-9 neutralized mice with liver fibrosis.
(A) Characterization of splenic Th9 and Th17 cells in fibrosis mice treated with anti-IL-9Ab, PBS and IgG. (BD) The percentages of splenic Th9, Th17 and Th1 cells in anti-IL-9Ab, IgG and PBS treated groups. (EG) Plasma levels of IL-9, IL-17A and IFN-γ in anti-IL-9Ab, IgG and PBS treated groups. (HJ) The liver mRNA levels of IL-9, IL-17A and IFN-γ in anti-IL-9Ab, PBS and IgG treated groups. (KN) The plasma levels of TGF-β1, IL-6, IL-4 and TNF-α in anti-IL-9Ab, IgG and PBS treated groups. (OR) The liver mRNA levels of TGF-β1, IL-6 IL-4 and TNF-α in anti-IL-9Ab, IgG and PBS treated groups. (S) The plasma levels of IL-21 in anti-IL-9Ab, IgG and PBS treated groups. (T) The liver mRNA levels of IL-21 in anti-IL-9Ab, IgG and PBS treated groups. **p <  0.01 compared with control PBS or IgG treated mice. Data are presented as mean ± SD.

References

    1. Friedman S. L. Mechanisms of hepatic fibrogenesis. Gastroenterology 134, 1655–69 (2008). - PMC - PubMed
    1. Hashimoto N. et al. Modulation of CD4(+) T cell responses following splenectomy in hepatitis C virus-related liver cirrhosis. Clin Exp Immunol 165, 243–50 (2011). - PMC - PubMed
    1. Heymann F. et al. Hepatic macrophage migration and differentiation critical for liver fibrosis is mediated by the chemokine receptor C-C motif chemokine receptor 8 in mice. Hepatology 55, 898–909 (2012). - PMC - PubMed
    1. Iredale J. P. Models of liver fibrosis: exploring the dynamic nature of inflammation and repair in a solid organ. J Clin Invest 117, 539–48 (2007). - PMC - PubMed
    1. Karlmark K. R. et al. Chemokine-directed immune cell infiltration in acute and chronic liver disease. Expert Rev Gastroenterol Hepatol 2, 233–242 (2008). - PubMed

Publication types

MeSH terms