. 2016 Jan 5:6:18517.
doi: 10.1038/srep18517.

Integration of genomic, transcriptomic and proteomic data identifies two biologically distinct subtypes of invasive lobular breast cancer

Affiliations

Integration of genomic, transcriptomic and proteomic data identifies two biologically distinct subtypes of invasive lobular breast cancer

Magali Michaut et al. Sci Rep. .

Abstract

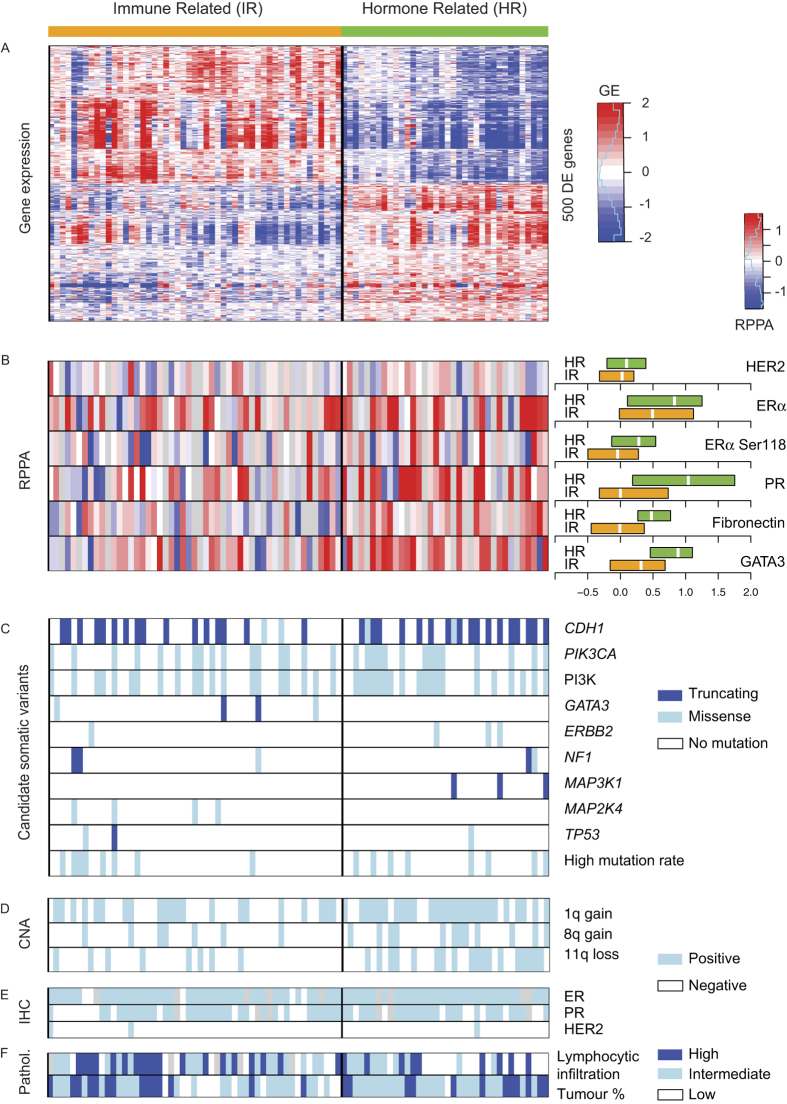
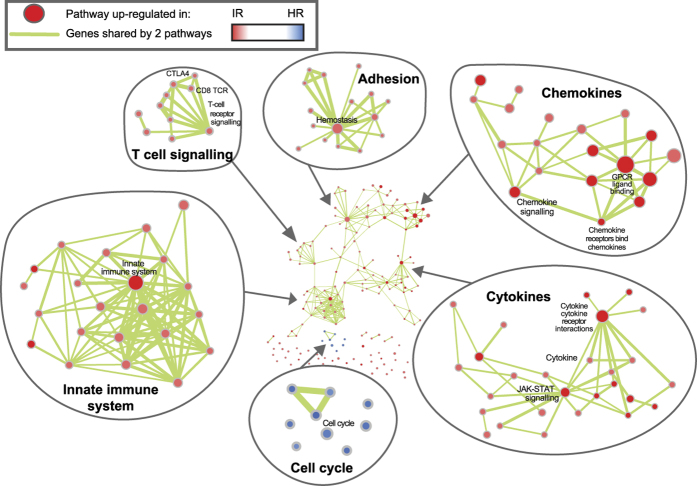
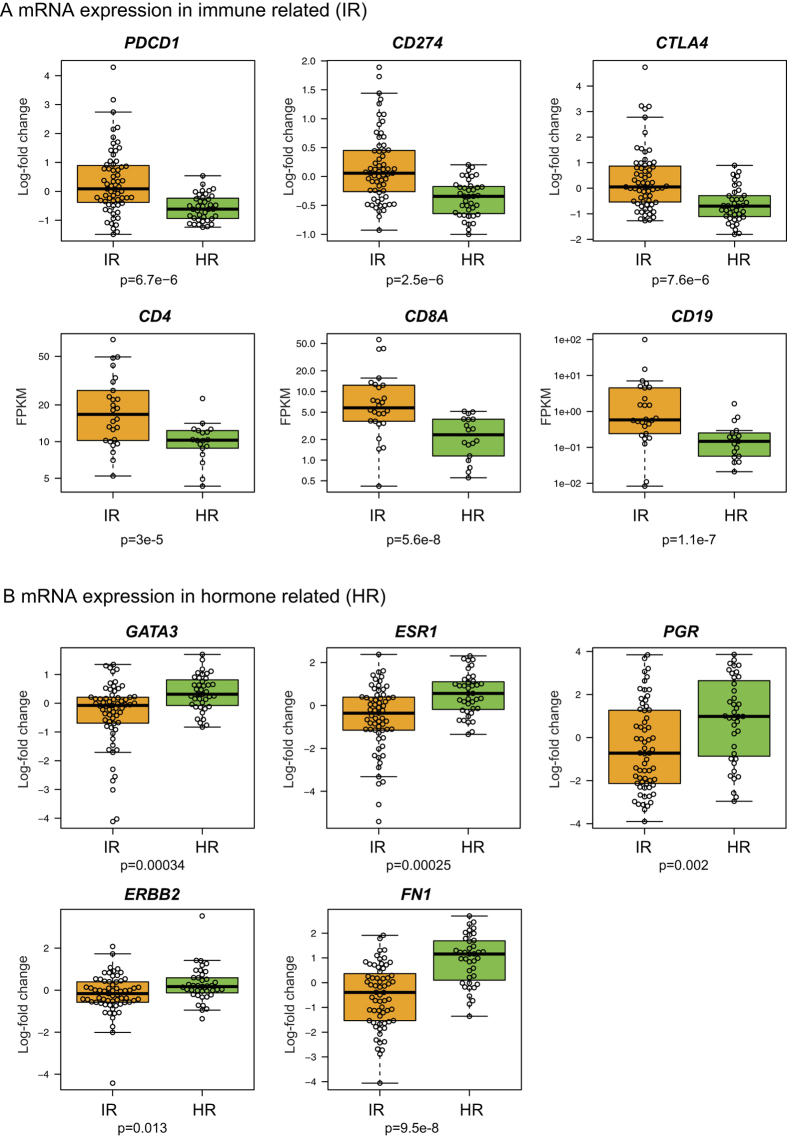
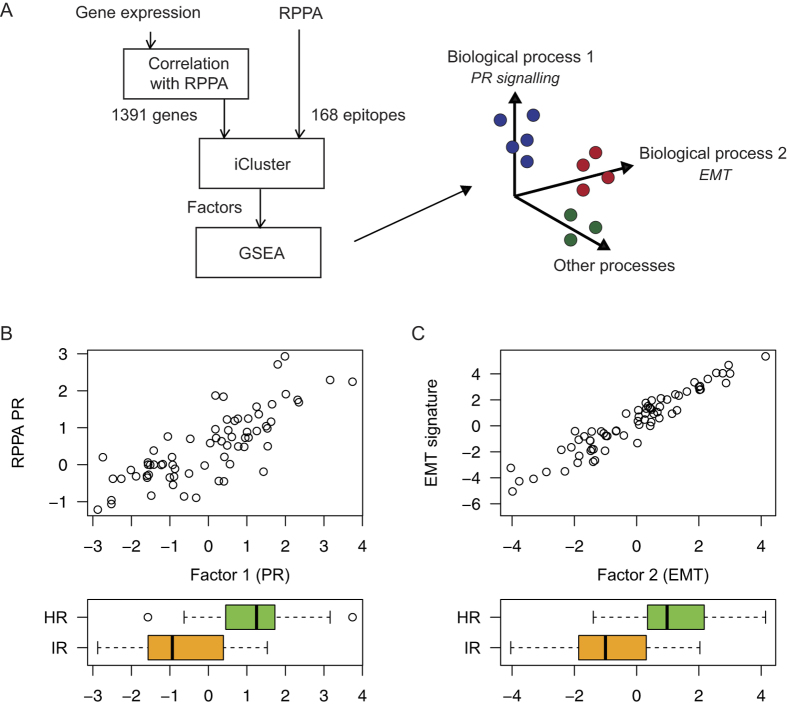
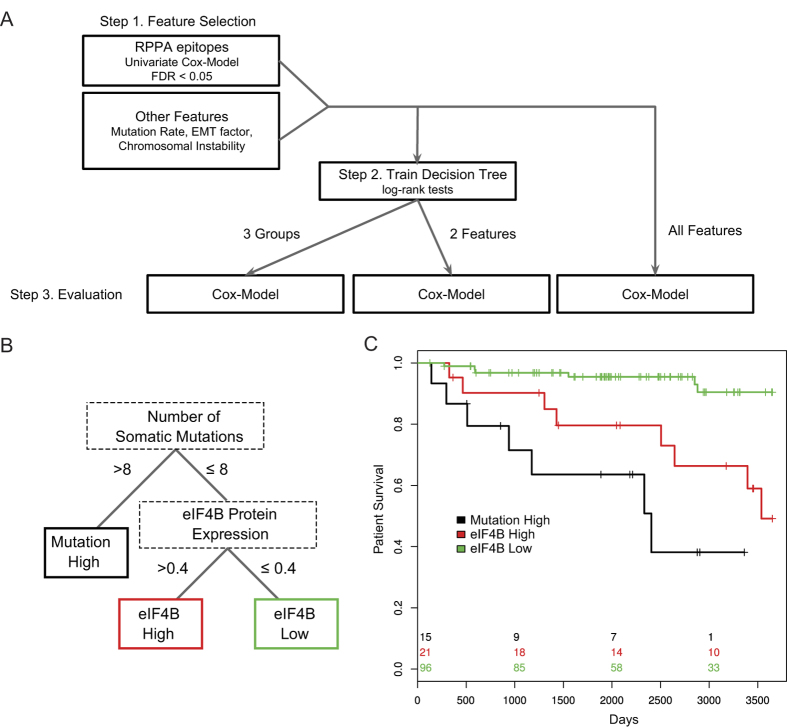
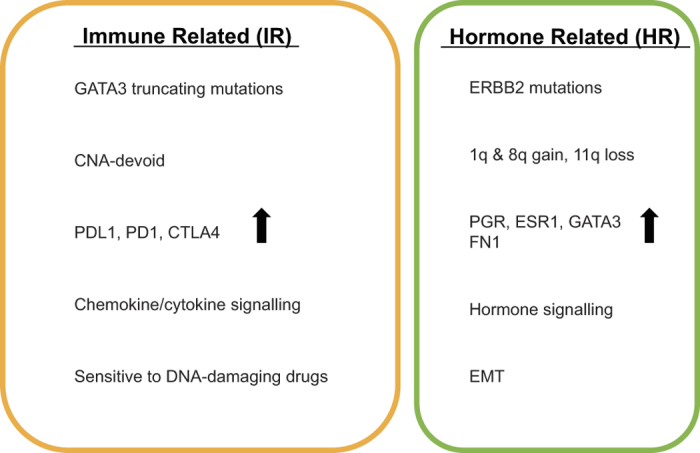
Invasive lobular carcinoma (ILC) is the second most frequently occurring histological breast cancer subtype after invasive ductal carcinoma (IDC), accounting for around 10% of all breast cancers. The molecular processes that drive the development of ILC are still largely unknown. We have performed a comprehensive genomic, transcriptomic and proteomic analysis of a large ILC patient cohort and present here an integrated molecular portrait of ILC. Mutations in CDH1 and in the PI3K pathway are the most frequent molecular alterations in ILC. We identified two main subtypes of ILCs: (i) an immune related subtype with mRNA up-regulation of PD-L1, PD-1 and CTLA-4 and greater sensitivity to DNA-damaging agents in representative cell line models; (ii) a hormone related subtype, associated with Epithelial to Mesenchymal Transition (EMT), and gain of chromosomes 1q and 8q and loss of chromosome 11q. Using the somatic mutation rate and eIF4B protein level, we identified three groups with different clinical outcomes, including a group with extremely good prognosis. We provide a comprehensive overview of the molecular alterations driving ILC and have explored links with therapy response. This molecular characterization may help to tailor treatment of ILC through the application of specific targeted, chemo- and/or immune-therapies.


Conflict of interest statement

W.M.G. is a co-founder and Chief Scientific Officer of OncoMark Limited. J.K.P., J.H., M.S. and I.M.S. received salary from Agendia as employee (no stocks or other funding). R.B. is employee and shareholder of Agendia. M.M., T.B., L.F.A.W. and R.B. are inventors on a patent about the ILC subtypes presented in this study.

Figures

Figure 1
Figure 1. Gene expression clustering reveals two ILC subtypes.
We defined two robust clusters of ILC samples by consensus clustering on the genome-wide gene expression data: immune related (IR) and hormone related (HR). We represent here the 89 samples with DNA sequencing, CNAs, and gene expression (Figure S1B). (A) Gene expression of top 250 up-regulated and top 250 down-regulated genes in one subtype versus the other. (B) RPPA values of selected epitopes. The boxplots on the right represent the distributions in both subtypes. (C) Candidate somatic variants are indicated in blue (truncating mutations in dark blue and missense mutations in light blue), while white indicates the absence of variant. PI3K is blue when any of the PI3K pathway genes is mutated (Figure S12). Samples with a high somatic mutation rate (> = 10) are shown in blue (white otherwise). (D) Copy number of selected genes. Presence (resp. absence) of the given CNA is shown in light blue (resp. white). (E) ER, PR and HER2 status as assessed by immunohistochemistry (IHC). (F) Pathology assessment of lymphocytic infiltration (defined with 3 levels) and tumour cellularity (High is >70%; Intermediate is (40–70%]; low is [30–40%]). Light blue (resp. white) indicates positive (resp. negative) and grey represent missing values in (B,E,F).
Figure 2
Figure 2. Pathway Enrichment Map contrasting both subtypes.
The networks illustrate the results of the pathway enrichment analysis (GSEA) contrasting IR and HR subtypes. Each node represents a pathway. Links between nodes represent the genes shared by both pathways (overlap coefficient >0.5). The node colours represent the strength and direction of the enrichment (red pathways are up-regulated in IR, blue ones are up-regulated in HR). The figure was made with the Enrichment Map app from Cytoscape.
Figure 3
Figure 3. Gene expression of subtype biomarkers.
The boxplots show the normalized gene expression in both IR and HR subtypes for different genes from the microarray data, unless otherwise specified. CD4, CD8A and CD19 absolute levels were quantified with RNA sequencing data on a subset of 68 samples and shown here by the number of Fragments Per Kilobase per Million (FPKM). (A) Biomarkers of the IR subtype: negative regulators of the immune response, T-cell markers CD4 and CD8A, and B-cells marker CD19 are up-regulated in IR. CD19 is only lowly expressed (FPKM < 1 in most samples). (B) Biomarkers of the HR subtype. Differences are assessed by a Wilcoxon’s rank sum test, except for the RNA sequencing data where the p-value is derived from differential expression analysis using DESeq2.
Figure 4
Figure 4. Factor analysis of mRNA and protein expression.
(A) Integrative analysis of gene expression and RPPA data using iCluster to identify factors best characterizing the samples. (B) The second factor is highly correlated with PR (from RPPA) and higher in the ER/PR subtype. (C) The first factor is highly correlated with the EMT gene expression signature of Anastassiou et al., and higher in the ER/PR subtype.
Figure 5
Figure 5. Survival tree.
(A) Workflow of the approach to predict survival from multiple data types. (B) The resulting decision tree, classifying the samples based on their somatic mutation rate and eIF4B protein level. (C) Kaplan-Meier curves of the groups of samples defined by the decision tree. Samples with high mutation rate have a poor survival, while samples with low eIF4B level have a good survival.
Figure 6
Figure 6. Summary description of both subtypes.
The figure represents the immune related (IR) and hormone related (HR) subtypes with their main characteristics.

References

    1. Guiu S. et al. Invasive lobular breast cancer and its variants: How special are they for systemic therapy decisions? Critical reviews in oncology/hematology, 10.1016/j.critrevonc.2014.07.003 (2014). - DOI - PubMed
    1. Pestalozzi B. C. et al. Distinct clinical and prognostic features of infiltrating lobular carcinoma of the breast: combined results of 15 International Breast Cancer Study Group clinical trials. Journal of Clinical Oncology 26, 3006–3014, 10.1200/JCO.2007.14.9336 (2008). - DOI - PubMed
    1. Iorfida M. et al. Invasive lobular breast cancer: subtypes and outcome. Breast cancer research and treatment 133, 713–723, 10.1007/s10549-012-2002-z (2012). - DOI - PubMed
    1. Arpino G., Bardou V. J., Clark G. M. & Elledge R. M. Infiltrating lobular carcinoma of the breast: tumor characteristics and clinical outcome. Breast cancer research 6, R149–156, 10.1186/bcr767 (2004). - DOI - PMC - PubMed
    1. Perou C. M. et al. Molecular portraits of human breast tumours. Nature 406, 747–752, 10.1038/35021093 (2000). - DOI - PubMed

Publication types

MeSH terms