

Comparison of self-reported and biomedical data on hypertension and diabetes: findings from the China Health and Retirement Longitudinal Study (CHARLS)
- PMID: 26729390
- PMCID: PMC4716227
- DOI: 10.1136/bmjopen-2015-009836
Comparison of self-reported and biomedical data on hypertension and diabetes: findings from the China Health and Retirement Longitudinal Study (CHARLS)
Abstract
Objectives: We examined the level of agreement between biomedical and self-reported measurements of hypertension and diabetes in a Chinese national community sample, and explored associations of the agreement and possible contextual effects among provinces and geographic regions in China.
Design: Secondary analysis of a cohort sample.
Setting and participants: Community samples were drawn from the national baseline survey of the China Health and Retirement Longitudinal Study (CHARLS, 2011-2012) through multistage probability sampling, which included households with members 45 years of age or above with a total sample size of 17,708 individuals.
Outcome measures: Sensitivity, specificity and κ were used as measurements of agreements or validity; variance of validity measures among provinces and communities was estimated using random-effects models.
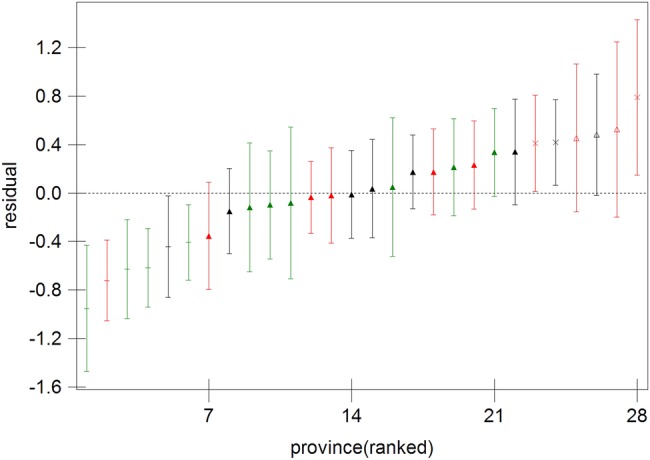
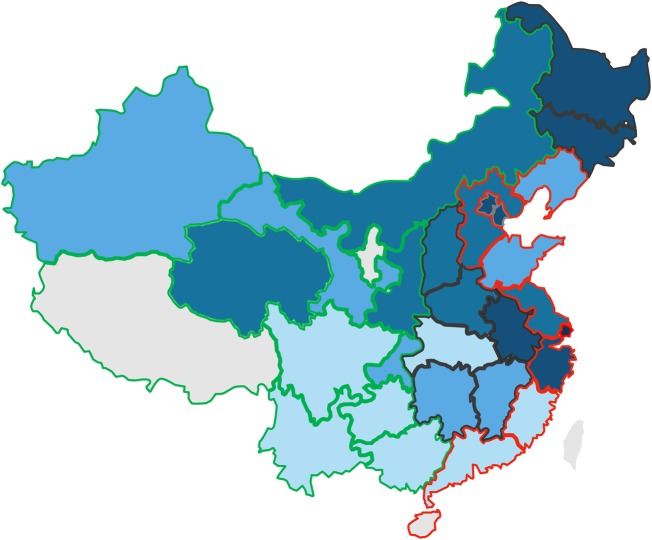
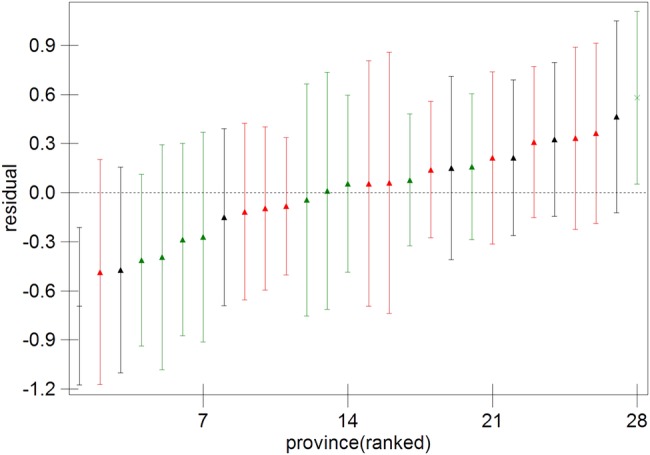
Results: Self-reports for hypertension and diabetes showed high specificity (96.3% and 98.3%, respectively) but low sensitivity (56.3% and 61.5%, respectively). Agreement between self-reported data and biomedical measurements was moderate for both hypertension (κ 0.57) and diabetes (κ 0.65), with respondents who were older, of higher socioeconomic status, better educated and who had hospital admissions in the past 12 months showing stronger agreements than their counterparts. Large and significant variations in the sensitivity among provinces for hypertension, and among communities for both hypertension and diabetes, could neither be attributed to the effects of respondents' characteristics nor to the contextual effects of city-village differences.
Conclusions: As a considerable number of people in the overall sample were unaware of their conditions, self-reports will lead to an underestimation of the prevalence of hypertension and diabetes. However, in more developed communities or provinces, self-reported data can be a reliable estimate of the prevalence of the two conditions. Further investigations of contextual effects at provincial and community levels could highlight public health strategies to improve awareness of the two conditions.
Keywords: EPIDEMIOLOGY.
Published by the BMJ Publishing Group Limited. For permission to use (where not already granted under a licence) please go to http://www.bmj.com/company/products-services/rights-and-licensing/
Figures
References
Publication types
MeSH terms
Grants and funding
LinkOut - more resources
Full Text Sources
Other Literature Sources
Medical
Research Materials
Miscellaneous