. 2016 Jan 4;60(3):1717-24.
doi: 10.1128/AAC.02434-15.

Combination Effects of Antimicrobial Peptides

Affiliations

Combination Effects of Antimicrobial Peptides

Guozhi Yu et al. Antimicrob Agents Chemother. .

Abstract

Antimicrobial peptides (AMPs) are ancient and conserved across the tree of life. Their efficacy over evolutionary time has been largely attributed to their mechanisms of killing. Yet, the understanding of their pharmacodynamics both in vivo and in vitro is very limited. This is, however, crucial for applications of AMPs as drugs and also informs the understanding of the action of AMPs in natural immune systems. Here, we selected six different AMPs from different organisms to test their individual and combined effects in vitro. We analyzed their pharmacodynamics based on the Hill function and evaluated the interaction of combinations of two and three AMPs. Interactions of AMPs in our study were mostly synergistic, and three-AMP combinations displayed stronger synergism than two-AMP combinations. This suggests synergism to be a common phenomenon in AMP interaction. Additionally, AMPs displayed a sharp increase in killing within a narrow dose range, contrasting with those of antibiotics. We suggest that our results could lead a way toward better evaluation of AMP application in practice and shed some light on the evolutionary consequences of antimicrobial peptide interactions within the immune system of organisms.


Figures

FIG 1
FIG 1
Schematic illustration of four parameters, MIC, ψmax, ψmin, and κ, predicted by the Hill function. The MIC is estimated by the lowest concentration that inhibits the growth of the whole treated bacterium population. ψmax and ψmin represent the maximal and minimal growth rates of bacteria under gradients of drug treatment, respectively. κ predicts the shape and slope of the pharmacodynamic curve; the higher the κ value, the steeper the pharmacodynamic curve.
FIG 2
FIG 2
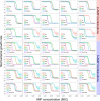
Pharmacodynamic curves of AMPs. The pharmacodynamic curves of AMPs were obtained by fitting killing curves to the Hill function (see equation 4). Combinations of two or three AMPs were differentiated. The curves illustrate the effects (reflected as net bacterial growth rate) of increasing the concentrations of AMP(s). The ribbon represents the 95% confidence interval.
FIG 3
FIG 3
Variations of MIC, κ, and ψmin in the Hill function predicted by the MCMC method. Results showed that these parameters vary among combinations with different numbers of AMPs. MICs declined with increasing numbers of AMPs in combination (ANOVA, F1,39 = 6.647, P = 0.0138); combinations with three AMPs had the highest κ values (ANOVA, F1,39 = 7.447, P = 0.00935). ψmin (Psimin) did not show significant differences among single AMPs and two- and three-AMP combinations (ANOVA, F1,39 = 1.855, P = 0.181).
FIG 4
FIG 4
Combination index of AMPs applied at concentrations which can achieve 50% of their maximal effect (E50). At E50, all the combinations with Api (except the combination of Api and Mel) showed antagonistic effects in two-AMP combinations, but only two combinations, ApiIndMel and ApiLLPex, showed antagonistic effects in three-AMP combinations. The gradient of colors represents different levels of each interaction.
FIG 5
FIG 5
Combination index of fraction level within the effect range. Three-AMP combinations are more significantly synergistic than two-AMP combinations (Student's t test, t = 8.2016, df = 606.57, P = 1.42e−15). The combination index did not vary within different effect ranges in both two-AMP and three-AMP combinations (ANOVA, F1,661 = 1.332, P = 0.2488). Black dots denote outliers.
FIG 6
FIG 6
Comparison of κ values of AMPs and antibiotics in our experiment and other, similar experiments. With similar experimental methods, conditions of measurements, and mathematical models, κ values of antibiotics in our experiment are similar to those of antibiotics in other experiments (ANOVA, F1,36 = 1.591, P = 0.215). However, κ values of AMPs are significantly higher than those of antibiotics both in our experiment and in other experiments (ANOVA, F1,77 = 150.5, P < 0.001). Data in boxes “Antibiotics (1),” “Antibiotics (2),” and “Antibiotics (3)” are from references , , and , respectively.

References

    1. Greco WR, Bravo G, Parsons JC. 1995. The search for synergy: a critical review from a response surface perspective. Pharmacol Rev 47:331–385. - PubMed
    1. Chou TC. 2006. Theoretical basis, experimental design, and computerized simulation of synergism and antagonism in drug combination studies. Pharmacol Rev 58:621–681. doi:10.1124/pr.58.3.10. - DOI - PubMed
    1. Imamovic L, Sommer MO. 2013. Use of collateral sensitivity networks to design drug cycling protocols that avoid resistance development. Sci Transl Med 5:204ra132. doi:10.1126/scitranslmed.3006609. - DOI - PubMed
    1. Cokol M, Chua HN, Tasan M, Mutlu B, Weinstein ZB, Suzuki Y, Nergiz ME, Costanzo M, Baryshnikova A, Giaever G, Nislow C, Myers CL, Andrews BJ, Boone C, Roth FP. 2011. Systematic exploration of synergistic drug pairs. Mol Syst Biol 7:544. doi:10.1038/msb.2011.71. - DOI - PMC - PubMed
    1. Tamma PD, Cosgrove SE, Maragakis LL. 2012. Combination therapy for treatment of infections with gram-negative bacteria. Clin Microbiol Rev 25:450–470. doi:10.1128/CMR.05041-11. - DOI - PMC - PubMed

Publication types

MeSH terms

Substances