

DNA Methylation mediated down-regulating of MicroRNA-33b and its role in gastric cancer
- PMID: 26729612
- PMCID: PMC4700416
- DOI: 10.1038/srep18824
DNA Methylation mediated down-regulating of MicroRNA-33b and its role in gastric cancer
Abstract
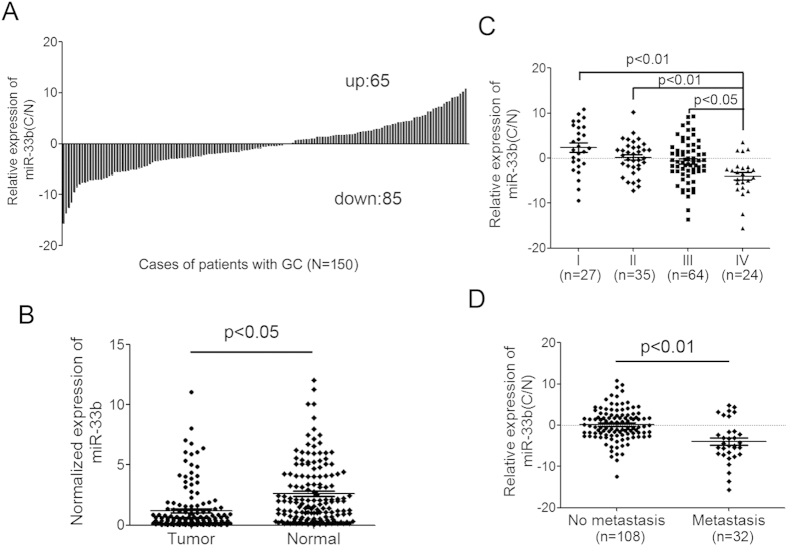
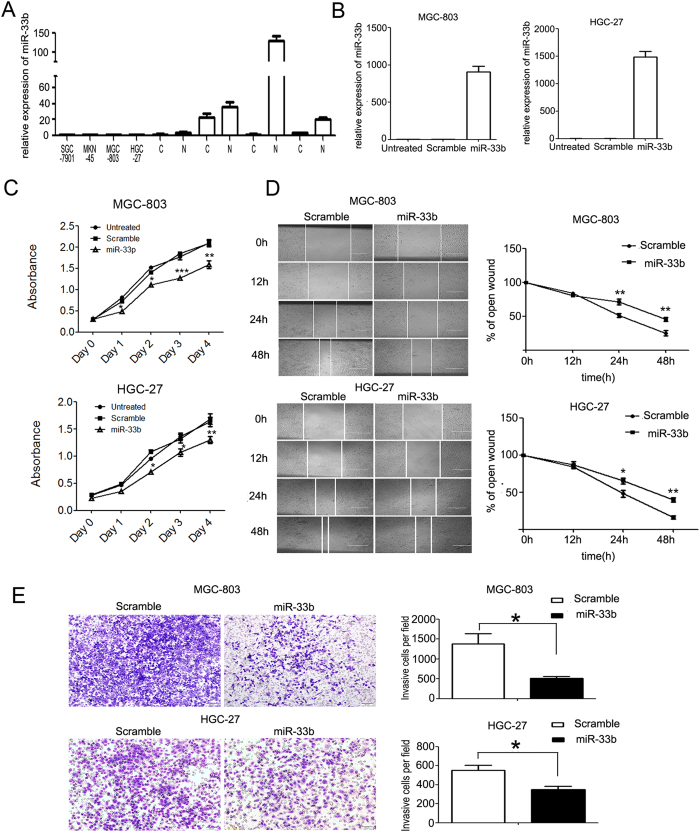
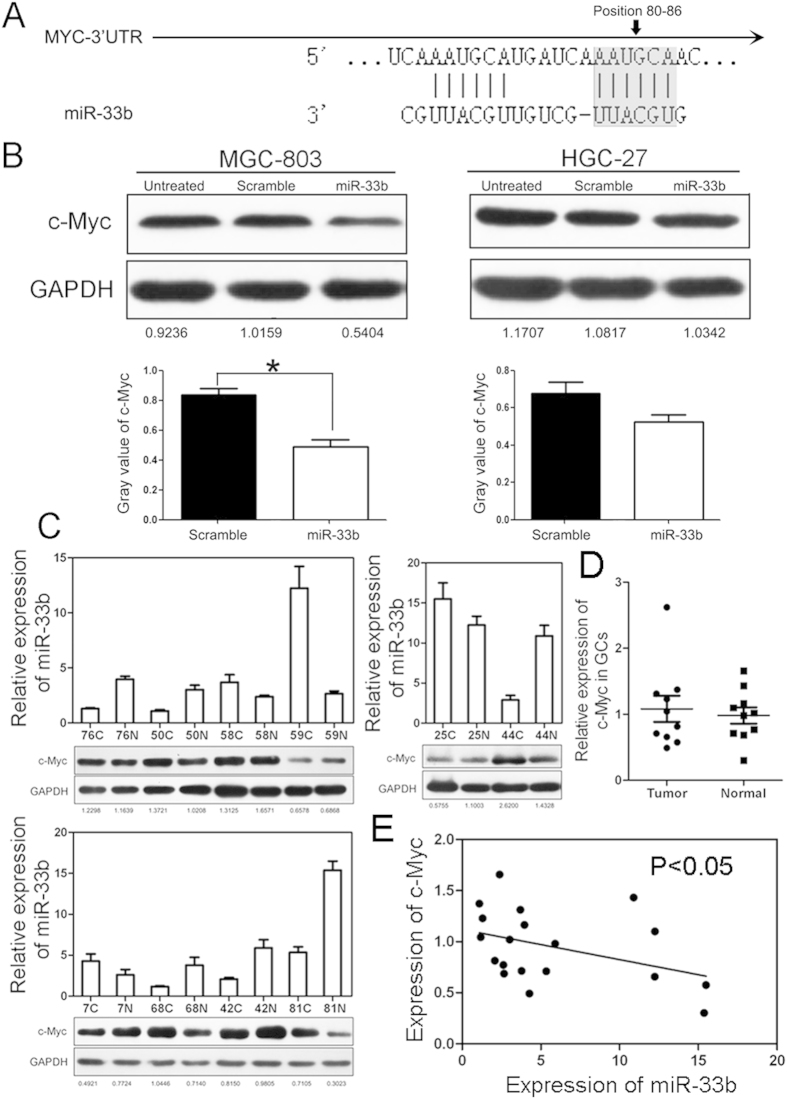
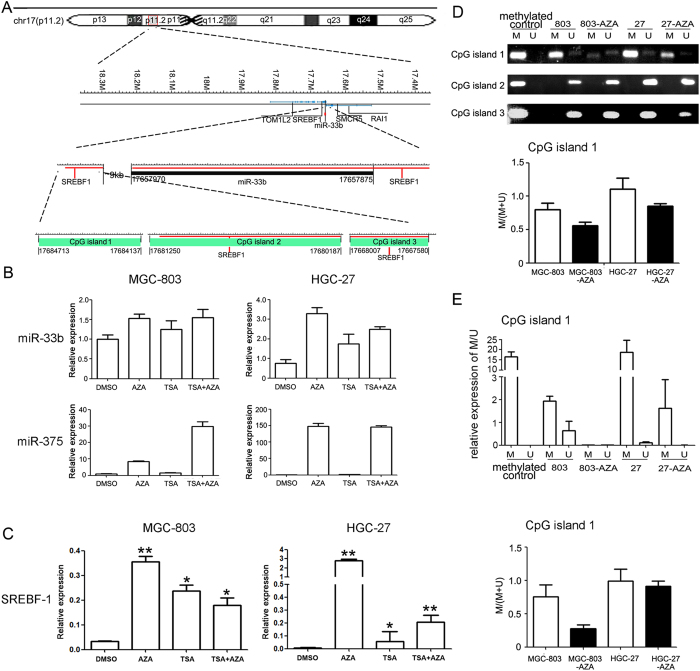
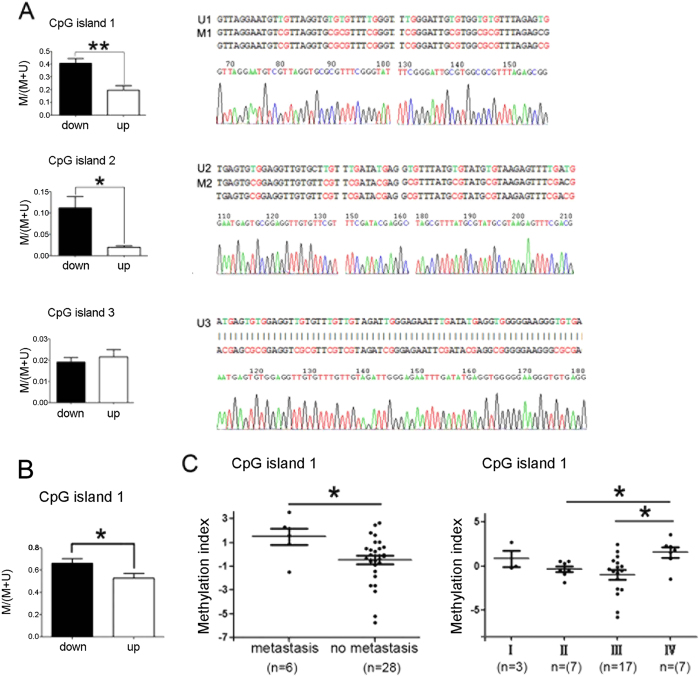
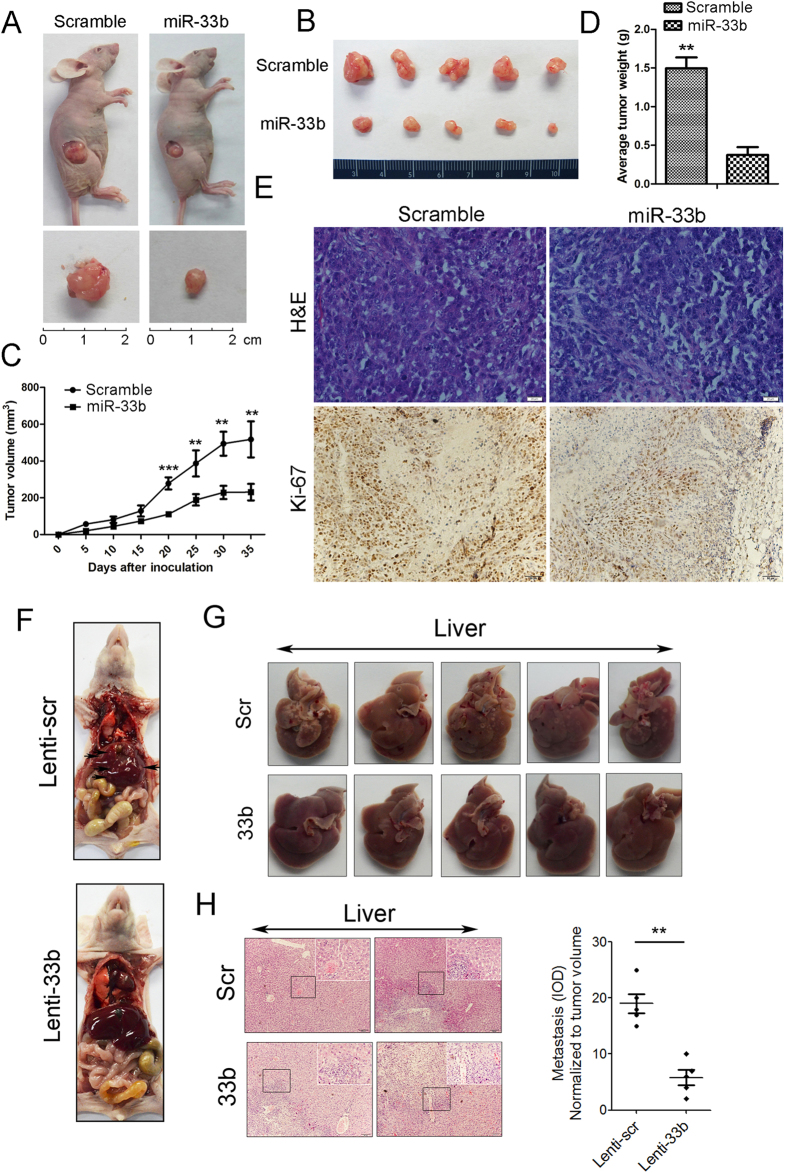
The discovery of microRNAs (miRNAs) provides a new and powerful tool for studying the mechanism, diagnosis and treatment of human cancers. Currently, down-regulation of tumor suppressive miRNAs by CpG island hypermethylation is emerging as a common hallmark of cancer. Here, we reported that the down-regulation of miR-33b was associated with pM stage of gastric cancer (GC) patients. Ectopic expression of miR-33b in HGC-27 and MGC-803 cells inhibited cell proliferation, migration and invasion, which might be due to miR-33b targeting oncogene c-Myc. Moreover, enhanced methylation level of the CpG island upstream of miR-33b in GC patients with down-regulated miR-33b was confirmed by methylation-specific PCR (MSP) amplification. Furthermore, re-introduction of miR-33b significantly suppressed tumorigenesis of GC cells in the nude mice. In conclusion, miR-33b acts as a tumor suppressor and hypermethylation of the CpG island upstream of miR-33b is responsible for its down-regulation in gastric cancer.
Figures
Similar articles
-
DNA methylation downregulated mir-10b acts as a tumor suppressor in gastric cancer.Gastric Cancer. 2015 Jan;18(1):43-54. doi: 10.1007/s10120-014-0340-8. Epub 2014 Jan 31. Gastric Cancer. 2015. PMID: 24481854
-
MicroRNA-10a is down-regulated by DNA methylation and functions as a tumor suppressor in gastric cancer cells.PLoS One. 2014 Jan 31;9(1):e88057. doi: 10.1371/journal.pone.0088057. eCollection 2014. PLoS One. 2014. Retraction in: PLoS One. 2023 Mar 29;18(3):e0283120. doi: 10.1371/journal.pone.0283120. PMID: 24498243 Free PMC article. Retracted. Clinical Trial.
-
MicroRNA-596 acts as a tumor suppressor in gastric cancer and is upregulated by promotor demethylation.World J Gastroenterol. 2019 Mar 14;25(10):1224-1237. doi: 10.3748/wjg.v25.i10.1224. World J Gastroenterol. 2019. PMID: 30886505 Free PMC article.
-
miR-33b in human cancer: Mechanistic and clinical perspectives.Biomed Pharmacother. 2023 May;161:114432. doi: 10.1016/j.biopha.2023.114432. Epub 2023 Feb 24. Biomed Pharmacother. 2023. PMID: 36841026 Review.
-
Epigenetic regulation of microRNAs in gastric cancer.Dig Dis Sci. 2014 Apr;59(4):716-23. doi: 10.1007/s10620-013-2939-8. Epub 2013 Nov 19. Dig Dis Sci. 2014. PMID: 24248419 Review.
Cited by
-
Methylation of the HOXA10 Promoter Directs miR-196b-5p-Dependent Cell Proliferation and Invasion of Gastric Cancer Cells.Mol Cancer Res. 2018 Apr;16(4):696-706. doi: 10.1158/1541-7786.MCR-17-0655. Epub 2018 Feb 16. Mol Cancer Res. 2018. PMID: 29453320 Free PMC article.
-
Regulatory mechanisms of microRNA expression.J Transl Med. 2016 May 20;14(1):143. doi: 10.1186/s12967-016-0893-x. J Transl Med. 2016. PMID: 27197967 Free PMC article. Review.
-
Potential roles of DNA methylation in the initiation and establishment of replicative senescence revealed by array-based methylome and transcriptome analyses.PLoS One. 2017 Feb 3;12(2):e0171431. doi: 10.1371/journal.pone.0171431. eCollection 2017. PLoS One. 2017. PMID: 28158250 Free PMC article.
-
How to stomach an epigenetic insult: the gastric cancer epigenome.Nat Rev Gastroenterol Hepatol. 2017 Aug;14(8):467-478. doi: 10.1038/nrgastro.2017.53. Epub 2017 May 17. Nat Rev Gastroenterol Hepatol. 2017. PMID: 28513632 Review.
-
DNA Methylation Mediated Down-Regulation of miR-370 Regulates Cell Growth through Activation of the Wnt/β-Catenin Signaling Pathway in Human Osteosarcoma Cells.Int J Biol Sci. 2017 Apr 10;13(5):561-573. doi: 10.7150/ijbs.19032. eCollection 2017. Int J Biol Sci. 2017. PMID: 28539830 Free PMC article.
References
-
- Shiozaki H., Doki Y., Tamura S. & Monden M. Molecular mechanism of carcinogenesis in gastric cancer: Intercellular molecule cadherin and catenin. Rinsho Nihon. 59, 88–93 (2001). - PubMed
-
- Ma G. F. et al. FoxP3 inhibits proliferation and induces apoptosis of gastric cancer cells by activating the apoptotic signaling pathway. Biochem Biph Res Co. 430, 804–809 (2013). - PubMed
-
- Carneiro P. et al. E-cadherin dysfunction in gastric cancer—cellular consequences, clinical applications and open questions. FEBS letters. 586, 2981–2989 (2012). - PubMed
-
- Kong Y. W., Ferland-McCollough D., Jackson T. J. & Bushell M. microRNAs in cancer management. Lancet Oncol. 13, 249–258 (2012). - PubMed
Publication types
MeSH terms
Substances
LinkOut - more resources
Full Text Sources
Other Literature Sources
Medical
Research Materials
Miscellaneous
