Review
. 2016 Jun;231(6):1199-218.
doi: 10.1002/jcp.25298. Epub 2016 Feb 2.

Evidence-Based Theory for Integrated Genome Regulation of Ontogeny--An Unprecedented Role of Nuclear FGFR1 Signaling

Affiliations
Review

Evidence-Based Theory for Integrated Genome Regulation of Ontogeny--An Unprecedented Role of Nuclear FGFR1 Signaling

Michal K Stachowiak et al. J Cell Physiol. 2016 Jun.

Abstract

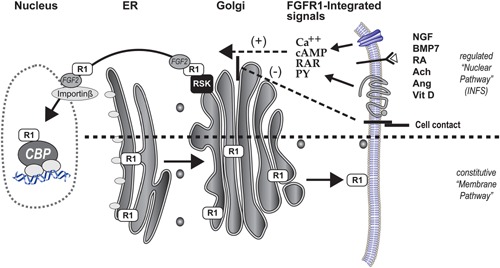
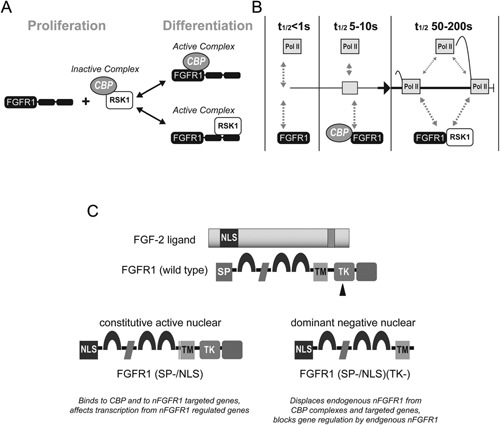
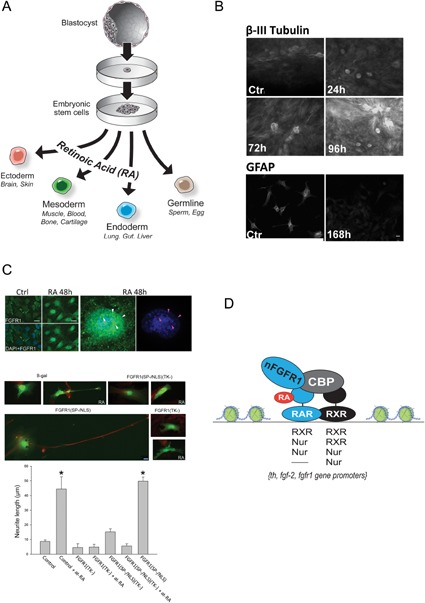
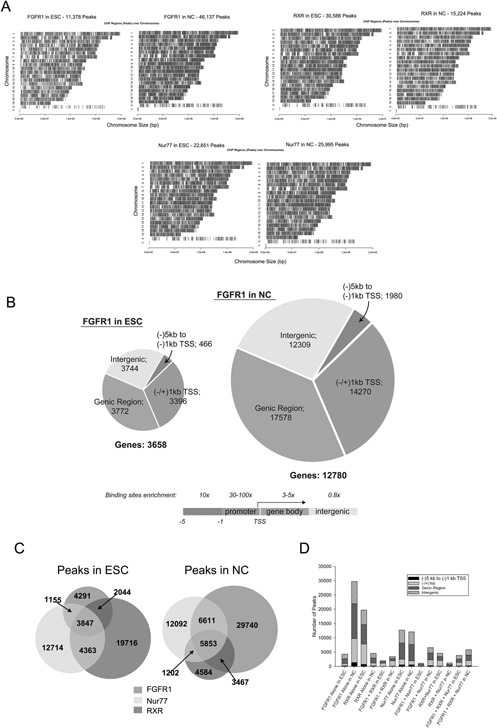
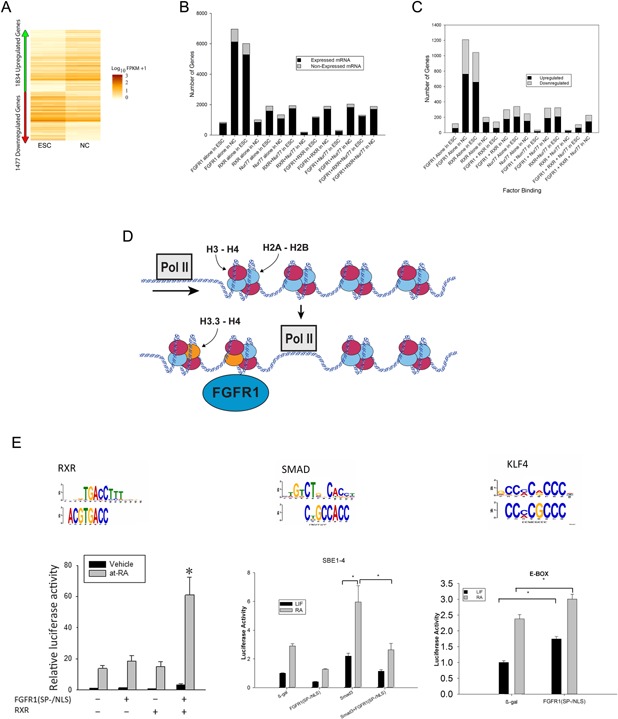
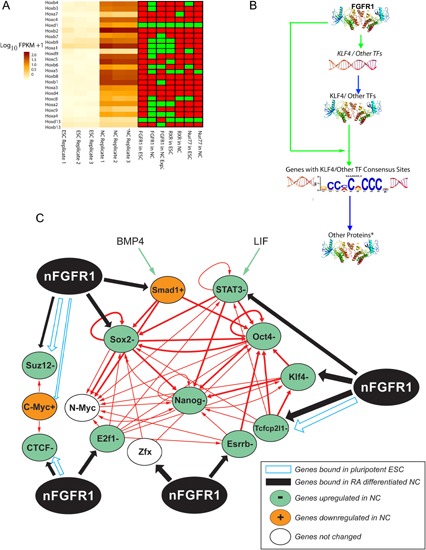
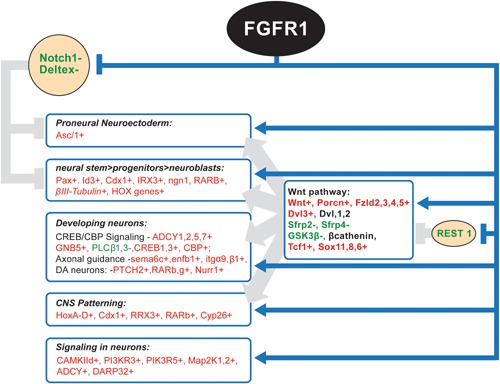
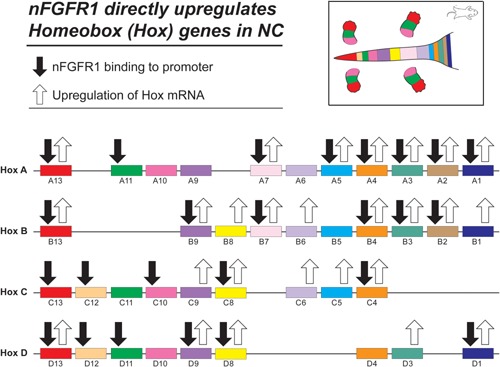
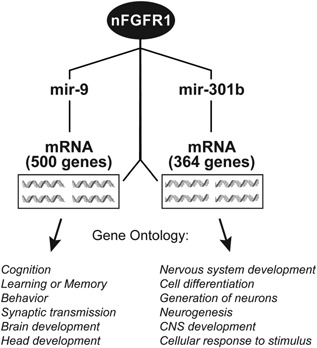
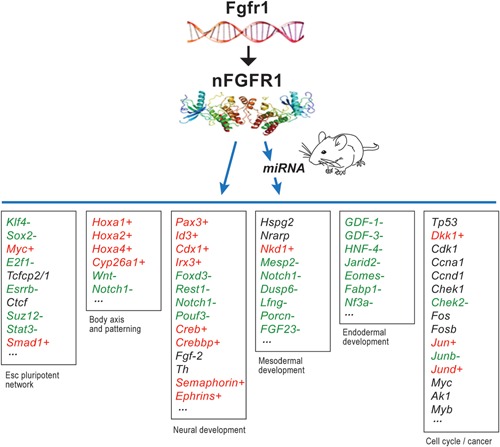
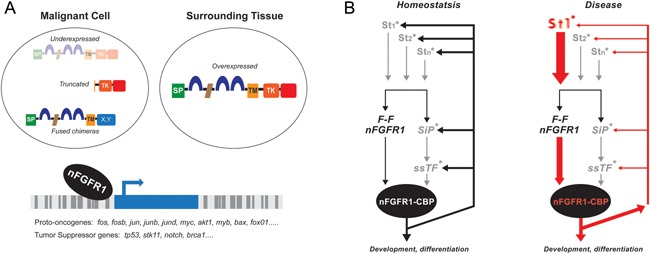
Genetic experiments have positioned the fgfr1 gene at the top of the gene hierarchy that governs gastrulation, as well as the subsequent development of the major body axes, nervous system, muscles, and bones, by affecting downstream genes that control the cell cycle, pluripotency, and differentiation, as well as microRNAs. Studies show that this regulation is executed by a single protein, the nuclear isoform of FGFR1 (nFGFR1), which integrates signals from development-initiating factors, such as retinoic acid (RA), and operates at the interface of genomic and epigenomic information. nFGFR1 cooperates with a multitude of transcriptional factors (TFs), and targets thousands of genes encoding for mRNAs, as well as miRNAs in top ontogenic networks. nFGFR1 binds to the promoters of ancient proto-oncogenes and tumor suppressor genes, in addition to binding to metazoan morphogens that delineate body axes, and construct the nervous system, as well as mesodermal and endodermal tissues. The discovery of pan-ontogenic gene programming by integrative nuclear FGFR1 signaling (INFS) impacts our understanding of ontogeny, as well as developmental pathologies, and holds new promise for reconstructive medicine, and cancer therapy.


Figures

Figure 1
Figure 1
Newly synthesized FGFR1 can enter either the constitutive membrane pathway or regulated nuclear pathway in membrane pathway the receptor is processed and glycosylated in Golgi and accumulates in plasma membrane. In the nuclear pathway, an atypical transmembrane domain in FGFR1 allows newly translated immobile receptor to be released from the pre‐Golgi membrane into cytosol generating a highly mobile protein in a process that involves proteasomes and is facilitated by the FGF‐2 ligand, and ribosomal S6 kinase (Dunham‐Ems et al., 2006, 2009). The nuclear transport of FGFR1 is mediated by importin‐β (Reilly and Maher, 2001). The nuclear accumulation of the hypoglycosylated nuclear form of FGFR1 (nFGFR1) is stimulated by a variety of developmental signals, including various growth factors (i.e., EGF, NGF, BDNF, BMP), vitamins D and retinoids, hormones, and neurotransmitters, calcium, cyclic AMP, and is inhibited by cell contact receptors. This is the reason that this pathway is referred to as integrative signaling (Stachowiak et al., 2015). FRET and co‐immunoprecipitation assays show that the NLS containing 23 kDa FGF‐2 interacts with nFGFR1 during nuclear transport and in the nucleus while, 18 kDa FGF‐2, which lacks a bipartite NLS, interacts with FGFR1 only in the cytoplasm (Dunham‐Ems et al., 2009). Biophotonic assays, including FLIP and FRAP, have demonstrated that cytoplasmic FGFR1 exists in three separate populations: (1) an immobile, newly synthesized Endoplasmic Reticulum (ER) population; (2) a highly mobile, non‐glycosylated, cytosolic population; and (3) a slowly diffusing, membrane receptor population (Dunham‐Ems et al., 2006). Nuclear accumulation of FGFR1 in live cells is promoted by an accelerated cytoplasmic to nuclear import, as well by as a reduced nuclear to cytoplasmic export (Lee et al., 2012, 2013; Stachowiak et al., 2012b). In addition, activation of cell surface FGFR1 by FGF‐2 induces FGFR1 internalization, which is dependent upon the ARF6, Dynamin2 and Rab5 endocytic machinery, and is inhibited by cell surface E‐cadherin adhesion complexes (Bryant and Stow, 2005). Once internalized, FGFR1 may be released from endosomes, or trafficked in a retrograde fashion to the ER/Golgi for cytoplasmic release via the RSK1‐associated pathway.
Figure 2
Figure 2
(A) The investigation has framed a threefold mechanism for nFGFR1 activation of CBP‐dependent transcription (Fang et al., 2005) in proliferating non‐differentiated cells, CBP is arrested in an inactive complex with RSK1 or RSK2. As FGFR1 accumulates in the nucleus, the TK domain binds to the N‐terminal kinase domain of RSK and disrupts the CBP‐RSK complex. The N‐terminal domain of another FGFR1 molecule interacts with the N‐terminal domain of CBP forming a CBP‐nFGFR1 complex. The nFGFR1‐CBP complex activates transcription by recruiting RNA Pol II and acetylating histones (Fang et al., 2005), while RSK1‐bound nFGFR1 phosphorylates TFs and, potentially, other chromatin proteins. (B) Kinetic model of INFS from FRAP mobility measurements (Dunham‐Ems et al., 2009; Stachowiak et al., 2012b). Bimodal analyses of the R1‐EGFP FRAP recovery demonstrate that nuclear FGFR1 contains a hyperkinetic component (“F” Fast recovering t1/2 < 1 sec; present in nucleoplasm), a hypokinetic component (“S” Slow‐recovering, t1/2 = 24 sec; chromatin‐associated), and an immobile component (non‐recovering, nuclear matrix‐associated). FGFR1 that is not engaged in transcription associates with nuclear matrix and is immobile. Activation of transcription by cAMP releases FGFR1 from matrix via an FGFR1 interaction with 23 kDa FGF‐2 generating an “F” R1, which engages in rapid (t1/2 < 1 sec) “non‐productive” molecular collisions and chromatin scanning. R1‐CBP binding converts “F” R1 into hypokinetic “S” R1 (t1/2 5–10 sec). We propose that the “S” FGFR1 represents FGFR1‐CBP oscillations that drive the formation of the RNA Pol II (Pol II) Preinitiation Complex (PIC). CBP binding to DNA‐associated transcription factors may extend the residence of CBP‐FGFR1 on chromatin, thereby promoting initiation of transcription. During transcriptional activation, the rate of oscillations is further reduced (“S” R1 converts into “ES”, (t/12 > 50 sec), possibly reflecting FGFR1 and RSK1 binding events and the formation of productive elongating complexes. The kinetics of RNA Polymerase II (RPII) are based on the methods of (Darzacq et al., 2007) and are similar to FGFR1. Close co‐localization of nFGFR1 and RNA Pol II is illustrated by immunostaining and super‐resolution microscopy in Video—Supplemental Material (collaborative experiment with Dr. Hari Shroff, NIH) l (Video 1). (C) Engineering constitutive active and dominant negative FGFR1. Testing function of nFGFR1 by gain and loss experiments—transfection of the constitutively active/nuclear variant FGFR1(SP‐/NLS), in which the cleavable SP is replaced with the NLS of FGF2, provides a means to generate INFS signals directly in the nucleus bypassing the afferent stimuli. Transfection of dominant‐negative variants of FGFR1(SP‐/NLS)(TK‐), which lack the tyrosine kinase (TK) domain, block nFGFR1 function specifically in the cell nucleus (Stachowiak et al., 2012b, 2015). The tyrosine kinase deleted (TK‐) mutant displaces endogenous nFGFR1 from the CBP complex and the gene promoter (Peng et al., 2002).
Figure 3
Figure 3
(A) During early embryogenesis embryonic stem cells (ESCs) appear in the inner cell mass of the blastocyst. Each of ESC is capable of developing into an organism with all of its tissues and thus is referred to as pluripotent. Retinoic acid appears in the primitive streak during gastrulation when three germ layers are formed, and has broad regulatory functions in ontogenesis including axis development in the vertebrate embryo (Morriss‐Kay and Sokolova, 1996). RA stimulates pluripotent cells to differentiate into neuronal, cardiac, myogenic, adipogenic, and vascular smooth muscle cells, depending on ligand concentration. (B) In vitro, at high concentrations (1–10 μM), RA promotes the exit of ESCs from the pluripotent state and their development specifically into the neuronal lineages. Within a few hours, nFGFR1 accumulates in the nuclei of ESC,s as the cells exit from the cell cycle, and neurogenic and neuronal genes are upregulated. By 24 h, the cells display a neuronal morphology (including long neurites and growth‐cone endings), and express neuron‐specific β‐III tubulin (B), MAP2, neurofilament L, TH (Lee et al., 2012), as well as glutamate and acetylcholine receptors (Guan et al., 2001; Okada et al., 2004; Akanuma et al., 2012; Lee et al., 2012). After 96 h of at‐RA treatment, only single cells displayed characteristic glial morphology and GFAP immunoreactivity (B), (Lee et al., 2012). Bar size—20 µm. With additional time and appropriate conditions the ESCs develop complex neuronal networks and 3D brain‐like organoids (not shown). Reprinted with permission from J Cell Biochem 113:2920–2936. (C) RA acid stimulates the nuclear accumulation of nFGFGR1 in ESCs which is both necessary and sufficient for RA‐induced neuronal differentiation. Top—ESC were incubated with or without (control) 1 µM at‐RA for 48 h and immunolabeled with N‐terminal αFGFR1 (ABCAM) (+goat‐anti mouse‐Alex488). On the enlarged nucleus arrowheads point to weakly stained (DAPI) euchromatin regions with high FGFR1‐IR after at‐RA stimulation. Center and bottom—the at‐RA‐induced outgrowth of β‐III‐tubulin containing neurites in mESC is inhibited by transfected dominant negative nuclear FGFR1 (FGFR1(SP‐/NLS)(TK‐) and by cytoplasmic/nuclear FGFR1(TK‐). In the absence of at‐RA, the average neurite outgrowth induced by active nuclear FGFR1(SP‐/NLS) is similar to the at‐RA induced outgrowth. Bar size—20 µm (Lee et al., 2012). (D) RA signaling is mediated by both retinoic acid receptors (RARs) and retinoid X receptors (RXRs), which can act as homo or heterodimers on RA‐responsive elements (RAREs) within RA‐regulated genes (Lefebvre et al., 2010). Additionally, RXR is highly versatile with respect to its heterodimerization; among the many other nuclear receptors with which it can interact are two members of the orphan nuclear subfamily, Nur77 and Nurr1. These factors also function independently by binding Nur‐response elements, as monomers (NBRE) and dimers (NurRE) (Maira et al., 1999; Maira et al., 2003; Lefebvre et al., 2010). nFGFR1 forms CBP‐containing low mobility chromatin complexes with RXR, RAR, and Nurs. These complexes bind to RARE, NBRE, and NurRE sequences within RA‐activated Fgfr1, Fgf‐2, and Th genes, and synergistically activate isolated RA‐ and Nur‐responsive elements (Baron et al., 2012; Lee et al., 2012, 2013).
Figure 4
Figure 4
(A) nFGFR1, RXR, and Nur77 peaks are heterogeneously distributed on all chromosomes in both ESCs and NCs. The density of binding sites on Ch. X was approximately fivefold lower than on other chromosomes (chromosome Y is absent). (reprinted from PLoS ONE 10:e0123380). (B) In mESC and NC genomes 2/3 of targeted sites are within promoter and genic regions. Relative to their global genomic representation, one observes an enrichment of FGFR1, RXR or Nur77 peaks within 5'UTR and exon regions and lack enrichment in the intron or 3'UTR regions. Within the promoter, the highest enrichment was found in the bidirectional promoter (50‐ to 100‐fold). In unidirectional promoters 10‐ to 30‐fold enrichment was observed −1/+1 kb from TSS and 5–10 fold in −1/−5 kb. (C) Genome‐wide colocalization of nFGFR1, RXR, and Nur77 peaks. Venn diagram illustrates the number of individual and overlapping nFGFR1, RXR, and Nur77 binding sites (Reprinted from PLoS ONE 10:e0123380). (D) nFGFR1, RXR, and Nur77 peaks co‐localize within all genomic regions. Specifically in the proximal promoter and NCs, the number of sites at which RXR or Nur77 bind together with nFGFR1 was markedly higher than the number of sites at which either RXR or Nur77 bind without nFGFR1. (Reprinted from PLoS ONE 10:e0123380).
Figure 5
Figure 5
(A) Heatmap representation of genes that are differentially expressed in pluripotent ESCs and RA‐induced NCs from three biological replicates. Out of 14,443 expressed genes, 1,834 were up‐regulated and 1,477 were down‐regulated in NCs (fold change [FC] >±2.0 and P‐value <0.035 were considered significant). Values are displayed as fragments per kb of transcript per million fragments mapped (FPKM). (B) >85% of promoter targeted sites are on active, expressed, genes. (C) Approximately 60% of genes with proximal promoters targeted by nFGFR1, RXR, and Nur77 or their combinations were upregulated and approximately 40% of genes were downregulated. In NCs, the population of regulated genes targeted by RXR was reduced, the number of regulated genes targeted by Nur77 was not changed, while the number of regulated genes targeted by nFGFR1 alone, nFGFR1+RXR, nFGFR1+Nur77, or nFGFR1+RXR+Nur77 increased several fold. In NCs, the population of regulated genes that were targeted by nFGFR1 (2,058 genes) constituted over 62% of all differentially regulated genes; that is, it was noticeably larger than the population of regulated genes that did not bind nFGFR1 (480 genes). (D) Increased incorporation of histone variant H3.3 (marker of gene activation), into nFGFR1 peaks on gene promoters links even more nFGFR1 binding to gene regulation. (E) nFGFR1 targeting of different promoter elements confers gene activation or inhibition. (A‐E reprinted or modified from PLoS ONE 10:e0123380), E—left part reprinted with permission from J Cell Biochem 113:2920–2936.
Figure 6
Figure 6
(A) Heat‐map illustrating the expression patterns of core pluripotent genes (left) and associated proximal promoter binding of nFGFR1, RXR and Nur77 (right; Terranova et al., 2015; reprinted from PLoS ONE 10:e0123380). (B) The pluripotent gene network is based on Chen et al. (2008) (Ivanova et al., 2006). nFGFR1 binding to gene promoters is marked by blue and black arrows. Genes expressed at high levels in ESC and repressed in NC are marked with green ovals, genes activated in NC with orange ovals and genes expressed in ESC and NC at the same levels with white ovals (Terranova et al., 2015). These pluripotency TFs are wired to the ES genome in two major ways. The first cluster includes the self‐assembling Oct4 and Sox2 complex, their partner Nanog. The second cluster consists of c‐Myc, n‐Myc, Zfx, and E2f1, which with additional self‐renewal regulators Esrrb, Tcfcp21, and Klf4 wired to and control the first cluster as shown in Fig. B. Among those genes, important OSKM group (Oct4, Sox2,Klf4, and Myc) has been distinguished by the ability to induce pluripotent state in fibroblast and other differentiated cells (Tanabe et al., 2014). Maintenance of the self‐renewing state of the mouse embryonic stem cells (ESCs), also requires the environmental factor cytokine, LIF, which activates STAT3 through phosphorylation and serum derived BMP4 which triggers Smad1 phosphorylation. BMP4, acts in conjunction with LIF to maintain the self‐renewal and pluripotency of mESC by activating the first cluster Oct4, Sox2, and Nanog cluster genes (Ying et al., 2003). Closely related to the pluripotency networks are Polycomb repressor SUZ12 and CTCF an insulator binding protein. Suz12 protein binds to diverse genes, which direct cell development and differentiation, but which are repressed by SUZ12 in ESC. As the SUZ12 is replaced by E2f1 or other coactivators, the developmental genes become activated, cells exit from the pluripotent state and begin lineage development. The CTCF is the vertebrate insulator and chromatin architectural protein. CTCF forms multi‐subunit protein complexes with cohesion, which differentially co‐localizes in the vicinity of specific CTCF binding sites (Balakrishnan et al., 2012). The CTCF protein controls expression of gene multi‐gene programs including the self‐renewal network. In the pluripotent ESC (+LIF), Suz12, Myc, Tcfcp2l1, and Stat3 are under direct inhibition by nFGFR1 (Terranova et al., 2015). In RA‐differentiated NC the Klf4, Sox2, Stat3, E2f1, Esrrb, Suz12, Smad1, Zfx, Tcfcp2l1, and Ctcf pluripotency genes become down‐regulated in a process that involves direct promoter binding by nFGFR1 and accompanied by a loss of RXR binding. The Oct4 and Nanog genes, which do not bind nFGFR1 are repressed by nFGFR1 indirectly in ESC and NC. The repression of Klf4, Sox2, Stat3, E2f1, Esrrb, Suz12, Smad1, Zfx, Tcfcp2l1, Ctcf, Oct4, and Nanog genes in differentiating NC by endogenous nFGFR1 was demonstrated by transfection of dominant negative nuclear FGFR1 (SP‐/NLS)(TK‐). FGFR1 (SP‐/NLS)(TK‐) profoundly increased expression of the pluripotency genes and prevented cell differentiation. Moreover, the same pluripotency genes were turned off by constitutively active nuclear FGFR1 (SP‐/NLS) which stopped cell self‐renewal and induced differentiation. Figure is based on Terranova et al. (2015) and Chen et al. (2008). (C) Dual level of transcriptional regulation by nFGFR1. In the case of Klf4 and several other pluripotent TFs (i.e., TP53, SMAD, CTCF, MYC, OCT4, SOX2, STAT3, RXR, Nurr1, and Nur77) nFGFR1 interacts with TFs encoding genes as well as with the consensus sequences to which they bind. This dual level regulation implies a feed‐forward mechanism, in which nFGFR1 controls both the generation of TFs and their downstream function to finely tune the pluripotency and other ontogenetic gene networks (modified from PLoS ONE 10:e0123380).
Figure 7
Figure 7
nFGFR1 targets and regulates key genes that program and execute different stages of neural development (based on the results of ChiPseq, ChiP, RNAseq, and RNA analyses). nFGFR1 removes “developmental road blocks” imposed by anti‐neural Notch1 and REST genes. nFGFR1 binds and inhibits the Notch1 gene in NC and vacates Deltex1 gene promoter in down‐regulated Deltex1 gene. nFGFR1 shows dynamic binding to the REST gene promoter and 3′ region indicating nFGFR1 role in the REST inactivation in differentiated NC. nFGFR1 targets and activates several master gene that instruct neural development. Those include proneural Ascl1, and multiple genes in the Wnt pathway. In general nFGFR1 binding correlates the activation of genes that stimulate or transduce WNT signals (red +) and with down‐regulation of the genes that inhibit Wnt receptors (green −). nFGFR1 binding activates neuronal developmental genes Pax, Id3, Cdx1, IRX3, CREB/CBP signaling genes, and the CNS patterning genes. nFGFR1 targets activated axonal guidance genes, and genes involved in synaptic plasticity and development of DA neurons.
Figure 8
Figure 8
(A) Activation of Hox genes during RA induced ESC transition to NC is accompanied by nFGFR1 binding to their promoters. The analyses of the HoxA cluster showed that nFGFR1 binding plays an essential role in the activation HoxA genes by RA. Furthermore, nFGFR1 binding is sufficient to activate several of the HoxA gene in ESC in the absence RA stimulation (Terranova et al., 2015). Hox genes are organized based on information from (P. Turpenny). (B) nFGFR1‐dependent mechanism may promote the sequential expression of Hox genes during ontogeny. During development Hox genes at the 3′ end of the clusters are activated first followed by Hox genes located at more 5′ positions. The mechanism of 3′–5′ time co‐linearity could involve an initial direct 1 activation of the 3′ Hox genes (i.e., Hox A1 and A2) by nFGFR1 followed a delayed co‐activation of the Hox 5′ genes by accumulating HoxA1, A2, and Cdx1 transcriptional factors along with nFGFR1.
Figure 9
Figure 9
nFGFR1 targets promoters of miRNAs upregulated during RA induced mESC differentiation to NC. (A) nFGFR1 binds to promoters of mir301 and mir9 in NC but not ESC. Thus, nFGFR1 may indirectly control translation of mRNAs targeted by mir301 and mir9 in differentiating NC. Mir301 and mir9 have binding sequences in a great number of mRNAs (364 and 500, respectively; identified by mirtarbase data base analysis, Supplementary table). Gene Ontology identifies functions of mir301 and mir9 targeted genes as being related to cell development and differentiation, brain development and function.
Figure 10
Figure 10
Genetic experiments position the Fgfr1 gene at the top of gene hierarchy that directs the development of multicellular animals. Fgfr1 governs gastrulation, as well as development of the major body axes, neural plate, central and peripheral nervous systems, and mesoderm by affecting the genes that control the cell cycle, pluripotency and differentiation (Ciruna et al., 1997; Partanen et al., 1998; Ciruna and Rossant, 2001; Dequeant and Pourquie, 2008) and microRNAs (Bobbs et al., 2012). This regulation is executed by nuclear protein, nFGFR1, which integrates a plethora of development controlling epigenomic signals (Stachowiak et al., 2015). nFGFR1 cooperates with RXR, Nurs and other CBP binding TFs, and targets thousands of genomic loci, including promoters of the mRNA and miRNA genes that reside at the top of the ontogenetic networks (Terranova et al., 2015). The dynamic nature of nFGR1 and its partner proteins illustrates how probabilistic molecular collisions (see Box 2, Fig. 2B) control the flow of information in structured genomic networks that underwrite development. The figure lists the discussed examples of nFGFR1 binding (ChiPseq) to promoters of different categories of developmental genes in which color denotes upregulation (red +) or downregulation (green −) during transition from ESCs to NCs (RNA‐seq). Black indicates nFGFR1 targeted genes that are not differentially expressed in ESC and NC (<2‐fold change). Figure is based on (Terranova et al., 2015) and linked database).
Figure 11
Figure 11
(A) Malignancy—in cancer cells nFGFR1 has been found depleted, truncated or fused with other genes. In cancer cell lines with reduced nFGFR1 expression, an up‐regulation of endogenous nFGFR1 or transfection of constitutively active nuclear FGFR1(SP‐/NLS) promote cell differentiation. Studies of non‐transformed ESC and NC show that nFGFR1 binds to promoters of key developmental proto‐oncogenes and tumor suppressor genes suggesting that the generation of cancerous phenotypes may involve altered structure/function of nFGFR1 and/or regulation of altered genes by nFGFR1. In cells surrounding pancreatic or glioma tumors nFGFR1 is found overexpressed and may promote cell migration and metastasis. (B) Developmental disease—disruption of INFS in schizophrenia. “Feed‐Forward‐And‐Gate” signaling by INFS in development. Neurogenic signals generated by diverse extracellular stimuli (St; neurotransmitters, hormones, growth factors, cell contact receptors) are propagated through signaling pathways (SiP; cAMP, Ca++/PKC, MAPK) to sequence specific transcription factors ([TF; CREB, AP1, NfkB, Smads, Klf4, Stat3, nuclear retinoid receptors {RXR/RAR} and orphan Nur receptors, etc.,]). In parallel, a newly synthesized FGFR1 translocates into the nucleus and “feeds forward” (F‐F) developmental signals directly to CREB binding protein (CBP), an essential transcriptional co‐activator and gene‐gating factor. The coupled activation of TFs and CBP by nFGFR1 allows genes to coordinately respond to developmental signals and cell development. In the proposed transcriptional circuit INFS co‐ordinates incoming developmental signals (St) through the Feed‐Forward (FF) module and reinforces or turns off those input signals via a feedback (FB) module (Lee et al., 2012). *marks signaling pathways in which schizophrenia‐linked genes a have been found, including cAMP, G‐protein signaling, PKC, MAPK, NfkB, CREB, RXR, and Nurr1 (Buervenich et al., 2000; Sun et al., 2010; Jablensky et al., 2011). In schizophrenia and other neurodevelopmental diseases, mutations of these individual genes, including “weak” copy variations could deregulate this auto‐regulated genomic circuit (red lines) and thus lead to broad molecular and developmental dysfunctions (Figure is based on information in (Stachowiak et al., 2013) and in (Terranova et al., 2015) and linked database).

References

    1. Akanuma H, Qin XY, Nagano R, Win‐Shwe TT, Imanishi S, Zaha H, Yoshinaga J, Fukuda T, Ohsako S, Sone H. 2012. Identification of stage‐specific gene expression signatures in response to retinoic acid during the neural differentiation of mouse embryonic stem cells. Front Genet 3:141. - PMC - PubMed
    1. Alexander T, Nolte C, Krumlauf R. 2009. Hox genes and segmentation of the hindbrain and axial skeleton. Annu Rev Cell Dev Biol 25:431–456. - PubMed
    1. Ayalew M, Le‐Niculescu H, Levey DF, Jain N, Changala B, Patel SD, Winiger E, Breier A, Shekhar A, Amdur R, Koller D, Nurnberger JI, Corvin A, Geyer M, Tsuang MT, Salomon D, Schork NJ, Fanous AH, O'Donovan MC, Niculescu AB. 2012. Convergent functional genomics of schizophrenia: From comprehensive understanding to genetic risk prediction. Mol Psychiatry 17:887–905. - PMC - PubMed
    1. Balakrishnan SK, Witcher M, Berggren TW, Emerson BM. 2012. Functional and molecular characterization of the role of CTCF in human embryonic stem cell biology. PLoS ONE 7:e42424. - PMC - PubMed
    1. Baron O, Forthmann B, Lee YW, Terranova C, Ratzka A, Stachowiak EK, Grothe C, Claus P, Stachowiak MK. 2012. Cooperation of nuclear fibroblast growth factor receptor 1 and Nurr1 offers new interactive mechanism in postmitotic development of mesencephalic dopaminergic neurons. J Biol Chem 287:19827–19840. - PMC - PubMed

Publication types

MeSH terms

LinkOut - more resources