

Observed decrease in atmospheric mercury explained by global decline in anthropogenic emissions
- PMID: 26729866
- PMCID: PMC4725498
- DOI: 10.1073/pnas.1516312113
Observed decrease in atmospheric mercury explained by global decline in anthropogenic emissions
Abstract
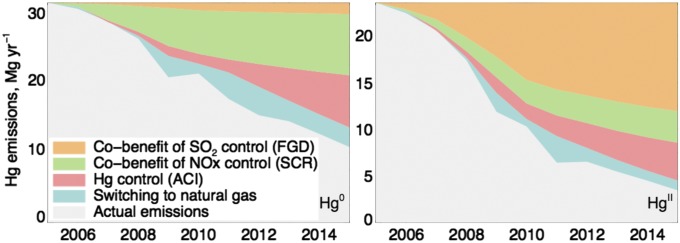
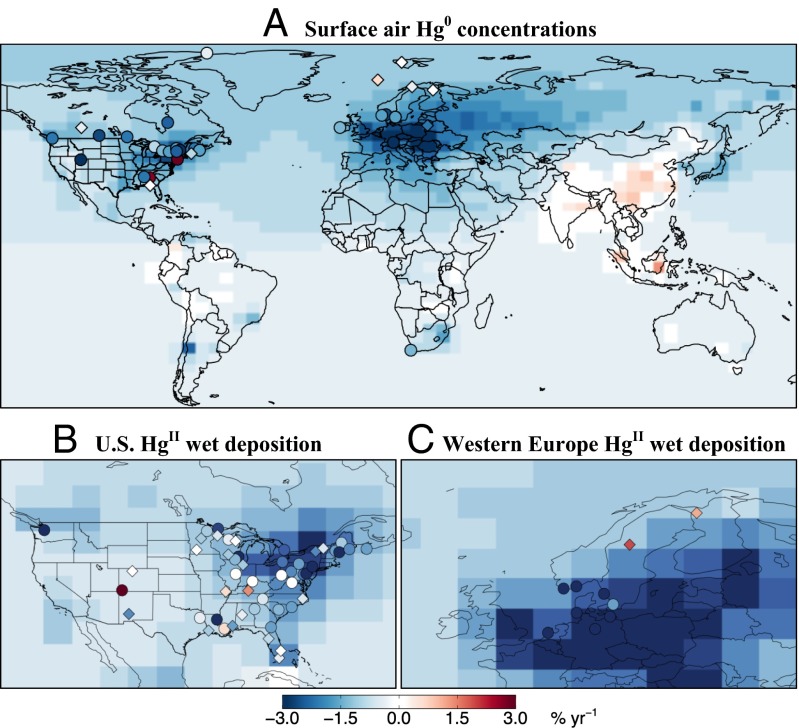
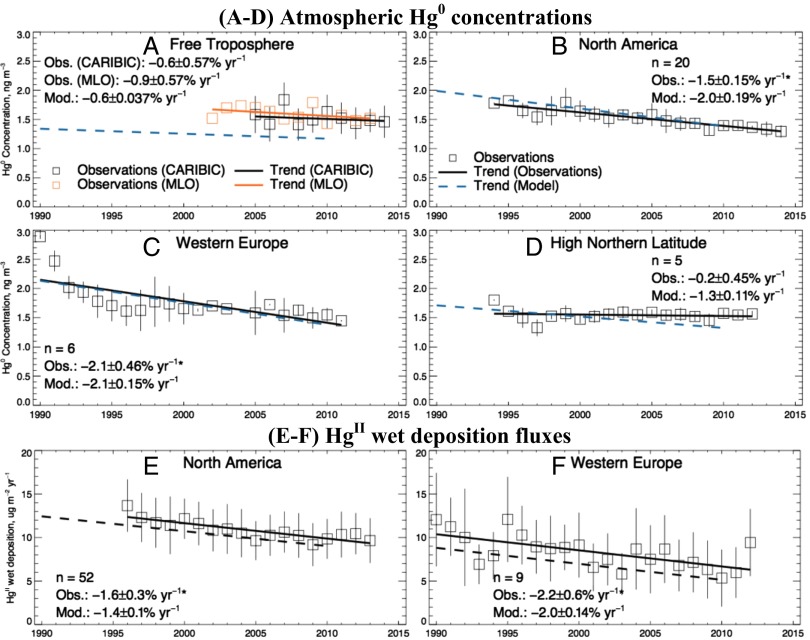
Observations of elemental mercury (Hg(0)) at sites in North America and Europe show large decreases (∼ 1-2% y(-1)) from 1990 to present. Observations in background northern hemisphere air, including Mauna Loa Observatory (Hawaii) and CARIBIC (Civil Aircraft for the Regular Investigation of the atmosphere Based on an Instrument Container) aircraft flights, show weaker decreases (<1% y(-1)). These decreases are inconsistent with current global emission inventories indicating flat or increasing emissions over that period. However, the inventories have three major flaws: (i) they do not account for the decline in atmospheric release of Hg from commercial products; (ii) they are biased in their estimate of artisanal and small-scale gold mining emissions; and (iii) they do not properly account for the change in Hg(0)/Hg(II) speciation of emissions from coal-fired utilities after implementation of emission controls targeted at SO2 and NOx. We construct an improved global emission inventory for the period 1990 to 2010 accounting for the above factors and find a 20% decrease in total Hg emissions and a 30% decrease in anthropogenic Hg(0) emissions, with much larger decreases in North America and Europe offsetting the effect of increasing emissions in Asia. Implementation of our inventory in a global 3D atmospheric Hg simulation [GEOS-Chem (Goddard Earth Observing System-Chemistry)] coupled to land and ocean reservoirs reproduces the observed large-scale trends in atmospheric Hg(0) concentrations and in Hg(II) wet deposition. The large trends observed in North America and Europe reflect the phase-out of Hg from commercial products as well as the cobenefit from SO2 and NOx emission controls on coal-fired utilities.
Keywords: atmosphere; emission; mercury; trend.
Conflict of interest statement
The authors declare no conflict of interest.
Figures
References
-
- Horowitz HM, Jacob DJ, Amos HM, Streets DG, Sunderland EM. Historical Mercury releases from commercial products: Global environmental implications. Environ Sci Technol. 2014;48(17):10242–10250. - PubMed
-
- Selin NE, et al. Chemical cycling and deposition of atmospheric mercury: Global constraints from observations. J Geophys Res. 2007;112(D2):D02308.
-
- Slemr F, Brunke EG, Ebinghaus R, Kuss J. Worldwide trend of atmospheric mercury since 1995. Atmos Chem Phys. 2011;11(10):4779–4787.
Publication types
MeSH terms
Substances
LinkOut - more resources
Full Text Sources
Other Literature Sources
Medical
Research Materials
