. 2015 Dec 23:11:69-91.
doi: 10.2147/IJN.S92031. eCollection 2016.

Nanostructured ultra-thin patches for ultrasound-modulated delivery of anti-restenotic drug

Affiliations

Nanostructured ultra-thin patches for ultrasound-modulated delivery of anti-restenotic drug

Lorenzo Vannozzi et al. Int J Nanomedicine. .

Abstract

This work aims to demonstrate the possibility to fabricate ultra-thin polymeric films loaded with an anti-restenotic drug and capable of tunable drug release kinetics for the local treatment of restenosis. Vascular nanopatches are composed of a poly(lactic acid) supporting membrane (thickness: ~250 nm) on which 20 polyelectrolyte bilayers (overall thickness: ~70 nm) are alternatively deposited. The anti-restenotic drug is embedded in the middle of the polyelectrolyte structure, and released by diffusion mechanisms. Nanofilm fabrication procedure and detailed morphological characterization are reported here. Barium titanate nanoparticles (showing piezoelectric properties) are included in the polymeric support and their role is investigated in terms of influence on nanofilm morphology, drug release kinetics, and cell response. Results show an efficient drug release from the polyelectrolyte structure in phosphate-buffered saline, and a clear antiproliferative effect on human smooth muscle cells, which are responsible for restenosis. In addition, preliminary evidences of ultrasound-mediated modulation of drug release kinetics are reported, thus evaluating the influence of barium titanate nanoparticles on the release mechanism. Such data were integrated with quantitative piezoelectric and thermal measurements. These results open new avenues for a fine control of local therapies based on smart responsive materials.

Keywords: barium titanate nanoparticles; drug delivery; layer-by-layer polyelectrolytes; micro/nanotherapeutic systems; restenosis; thin films; ultrasound.


Figures

Figure 1
Figure 1
Illustration of the nanofilm interaction with the vessel wall. Note: The PLLA substrate can be also provided with BaTiO3 nanoparticles (not shown). Abbreviations: DB103, anti-restenotic drug used in this study; PLLA, poly(l-lactic acid); VSMC, vascular smooth muscle cell.
Figure 2
Figure 2
Illustration of the fabrication procedure for PLLA/PE nanofilms on Si wafers. Notes: (A) Deposition of a PVA layer; (B) deposition of a PLLA layer; (C) deposition of ten PE bilayers after oxygen plasma treatment; (D) drug loading; (E) deposition of ten additional bilayers plus a single layer of chitosan. Abbreviations: PE, polyelectrolyte; PLLA, poly(l-lactic acid); PVA, poly(vinyl alcohol); DB103, anti-restenotic drug used in this study.
Figure 3
Figure 3
PLLA nanolayer thickness as a function of PLLA concentration and spin-coating speed. Five different samples were analyzed for each velocity and concentration. Abbreviation: PLLA, poly(l-lactic acid).
Figure 4
Figure 4
AFM images of PLLA nanofilm surface for different concentrations of BaTiO3 nanoparticles. Notes: (A) 1 mg/mL; (B) 2.5 mg/mL; (C) 5 mg/mL; (D) 7.5 mg/mL; and (E) 10 mg/mL. Each scan is associated with three height profiles, corresponding to three different image positions. Scale bars =3 μm. Abbreviations: AFM, atomic force microscopy; PLLA, poly(l-lactic acid).
Figure 4
Figure 4
AFM images of PLLA nanofilm surface for different concentrations of BaTiO3 nanoparticles. Notes: (A) 1 mg/mL; (B) 2.5 mg/mL; (C) 5 mg/mL; (D) 7.5 mg/mL; and (E) 10 mg/mL. Each scan is associated with three height profiles, corresponding to three different image positions. Scale bars =3 μm. Abbreviations: AFM, atomic force microscopy; PLLA, poly(l-lactic acid).
Figure 5
Figure 5
SEM image and EDX microanalysis, at different concentrations. Notes: (A) Electron microscopy images (top pictures) and EDX microanalysis (bottom pictures) of PLLA (20 mg/mL) doped with BaTiO3 nanoparticles at different concentrations: 1 mg/mL; 2.5 mg/mL; 5 mg/mL; 7.5 mg/mL; and 10 mg/mL. In the bottom pictures: Ti is reported in red, whereas Ba is reported in green. Thus, the nanoparticles are represented in yellow. Scale bars =2 µm. (B) Sum-frequency generation signal acquisition (left) shows BaTiO3 nanoparticles (in white) within the PLLA matrix, and the emission spectrum (right). Scale bar =5 µm. Abbreviations: EDX, energy-dispersive X-ray spectroscopy; PLLA, poly(l-lactic acid); SFG, Sum-frequency-generated; SHG, second harmonic generation; CARS, coherent anti-stokes raman scattering; SEM, scanning electron microscopy.
Figure 6
Figure 6
Morphological and surface characterization of PLLA nanofilm after drug deposition. Notes: (A) Thickness of polyelectrolytes spinned over PLLA and PLLA(BaTiO3) samples. Three different samples were analyzed for each experimental point. (B) SEM image of a drug-loaded sample constituted of PLLA substrate and ten polyelectrolyte bilayers. Scale bar =20 µm. (C) SEM image of a sample constituted of PLLA substrate and ten polyelectrolyte bilayers, without drug loading. Scale bar =20 µm. (D, E) AFM images showing PLLA/PE and PLLA(BaTiO3)/PE nanofilm top surfaces, respectively. Scale bars =5 µm. (F) Picture of a free-standing PLLA/PE nanofilm (evidenced by the dashed blue line), in water. Abbreviations: AFM, atomic force microscopy; PE, polyelectrolyte; PLLA, poly(l-lactic acid); SEM, scanning electron microscopy.
Figure 7
Figure 7
In vitro drug release tests. Notes: (A) Illustration of the different samples types tested during drug release experiments; (B) drug release profiles; (C) magnified inset. Release profiles are normalized respect to the maximum release condition (seen in PLLA/PE samples after US stimulation). Five different samples were analyzed for each experimental point. Abbreviations: PE, polyelectrolyte; PLLA, poly(l-lactic acid); US, ultrasound; h, hours.
Figure 8
Figure 8
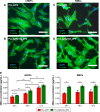
In vitro tests. Notes: Fluorescence images of nHDFs (left pictures) and SMCs (right pictures), respectively on PLLA/PE (A, C) and on PLLA(BaTiO3)/PE (B, D) samples with DB103 after 72 hours. Scale bars =100 µm. (E) DNA quantification for nHDFs (left) and SMCs (right), to evaluate their proliferation rate over PLLA/PE and PLLA(BaTiO3)/PE nanofilms. Three samples were analyzed for each sample type and for each time-point. *P<0.05, **P<0.01. Abbreviations: nHDFs, normal human dermal fibroblasts; PE, polyelectrolyte; PLLA, poly(l-lactic acid); SMCs, smooth muscle cells; h, hours.
Figure 9
Figure 9
In vitro drug release tests with US stimulation. Notes: (A) Drug release profiles from the nanofilms after the US trigger, performed 10 minutes after starting the experiment. Five different samples were analyzed for each experimental point. (B) Magnified inset; (C, D) comparison between the drug release profiles for non-triggered (full line) and US-triggered (dashed line) samples. Release profiles are normalized respect to the maximum release condition (PLLA/PE under US stimulation). Abbreviations: PE, polyelectrolyte; PLLA, poly(l-lactic acid); US, ultrasound; h, hours.
Figure 10
Figure 10
Piezoelectric characterization and thermographic evaluation during US stimulation. Notes: PFM measurements referred to topography, amplitude, and phase for PLLA/PE (A) and PLLA(BaTiO3)/PE (B) nanofilms. Scale bars =2 µm. (C) Thermographic images of PLLA/PE and PLLA(BaTiO3)/PE samples before and after the US stimulation (10 seconds). (D) Evaluation of temperature variations in comparison with PBS only, used as control. Five different samples were analyzed for each sample type and for each time-point. Abbreviations: PE, polyelectrolyte; PFM, piezoresponse force microscopy; PLLA, poly(l-lactic acid); PBS, phosphate-buffered saline; s, seconds; US, ultrasound.

References

    1. Nobuyoshi M, Kimura T, Ohishi H, et al. Restenosis after percutaneous transluminal coronary angioplasty: pathologic observations in 20 patients. J Am Coll Cardiol. 1991;17(2):433–439. - PubMed
    1. Chakhtoura EY, Hobson RW, II, Goldstein J, et al. In-stent restenosis after carotid angioplasty-stenting: incidence and management. J Vasc Surg. 2001;33(2):220–226. - PubMed
    1. Tosaka A, Soga Y, Iida O, et al. Classification and clinical impact of restenosis after femoropopliteal stenting. J Am Coll Card. 2012;59(1):16–23. - PubMed
    1. Austin GE, Ratliff NB, Hollman J, Tabei S, Phillips DF. Intimal proliferation of smooth muscle cells as an explanation for recurrent coronary artery stenosis after percutaneous transluminal coronary angioplasty. J Am Coll Cardiol. 1985;6(2):369–375. - PubMed
    1. Zargham R. Preventing restenosis after angioplasty: a multistage approach. Clin Sci. 2008;114:257–264. - PubMed

Publication types

MeSH terms