

Simultaneous Sodium and Calcium Imaging from Dendrites and Axons
- PMID: 26730401
- PMCID: PMC4699831
- DOI: 10.1523/ENEURO.0092-15.2015
Simultaneous Sodium and Calcium Imaging from Dendrites and Axons
Abstract
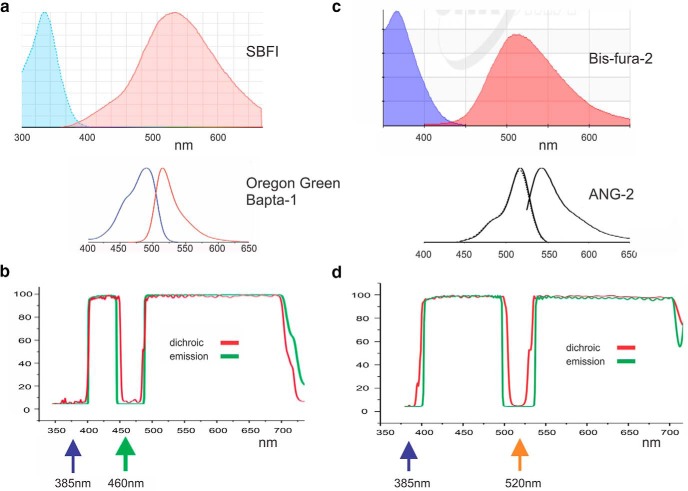
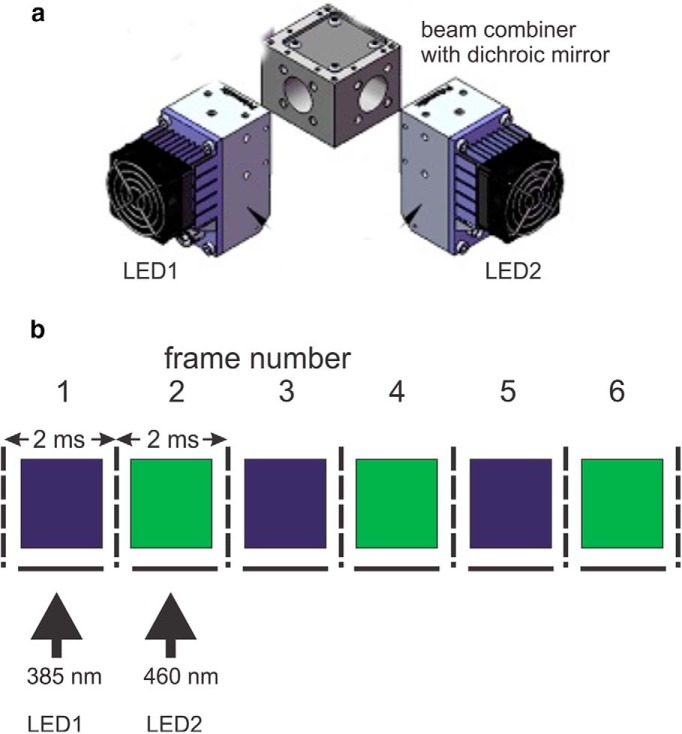
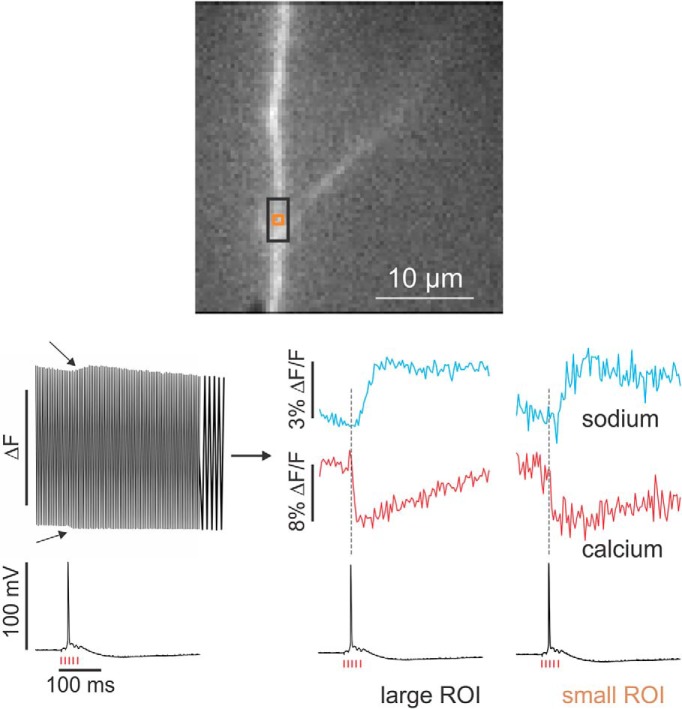
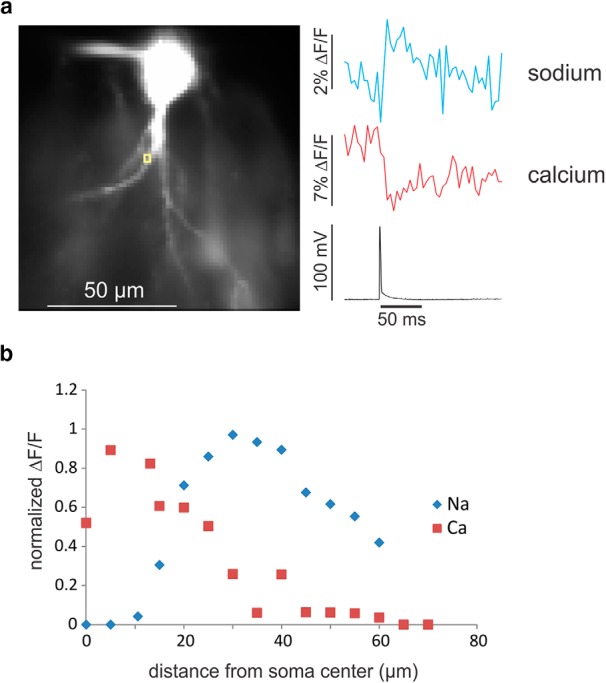
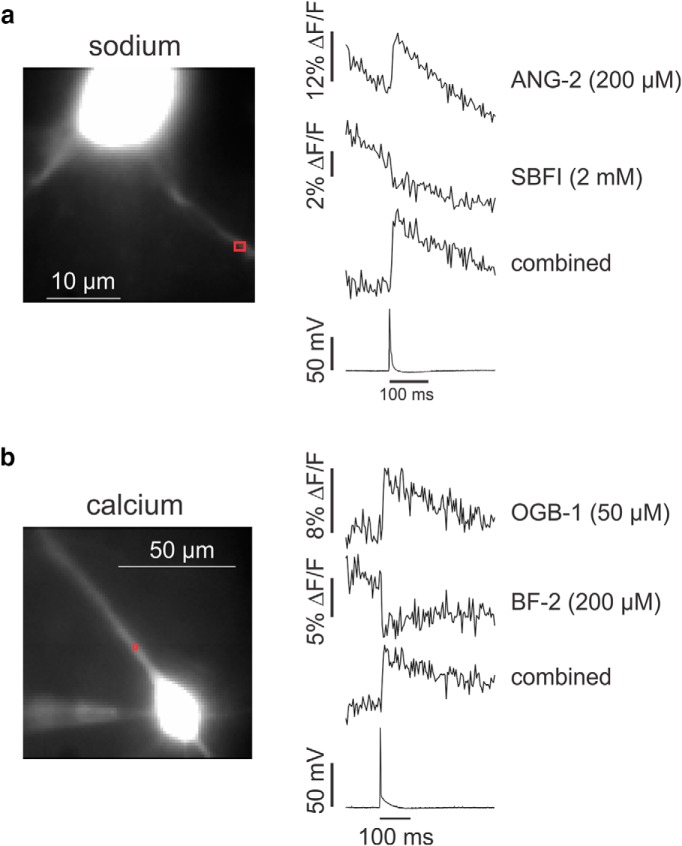
Dynamic calcium imaging is a major technique of neuroscientists. It can reveal information about the location of various calcium channels and calcium permeable receptors, the time course, magnitude, and location of intracellular calcium concentration ([Ca(2+)]i) changes, and indirectly, the occurrence of action potentials. Dynamic sodium imaging, a less exploited technique, can reveal analogous information related to sodium signaling. In some cases, like the examination of AMPA and NMDA receptor signaling, measurements of both [Ca(2+)]i and [Na(+)]i changes in the same preparation may provide more information than separate measurements. To this end, we developed a technique to simultaneously measure both signals at high speed and sufficient sensitivity to detect localized physiologic events. This approach has advantages over sequential imaging because the preparation may not respond identically in different trials. We designed custom dichroic and emission filters to allow the separate detection of the fluorescence of sodium and calcium indicators loaded together into a single neuron in a brain slice from the hippocampus of Sprague-Dawley rats. We then used high-intensity light emitting diodes (LEDs) to alternately excite the two indicators at the appropriate wavelengths. These pulses were synchronized with the frames of a CCD camera running at 500 Hz. Software then separated the data streams to provide independent sodium and calcium signals. With this system we could detect [Ca(2+)]i and [Na(+)]i changes from single action potentials in axons and synaptically evoked signals in dendrites, both with submicron resolution and a good signal-to-noise ratio (S/N).
Keywords: calcium; imaging; sodium.
Conflict of interest statement
The authors report no conflict of interest.
Figures
Similar articles
-
Spatial distribution of synaptically activated sodium concentration changes in cerebellar Purkinje neurons.J Neurophysiol. 1997 Jan;77(1):145-52. doi: 10.1152/jn.1997.77.1.145. J Neurophysiol. 1997. PMID: 9120555
-
A generalised method to estimate the kinetics of fast Ca(2+) currents from Ca(2+) imaging experiments.J Neurosci Methods. 2016 Aug 1;268:66-77. doi: 10.1016/j.jneumeth.2016.05.005. Epub 2016 May 6. J Neurosci Methods. 2016. PMID: 27163479
-
Confocal imaging of dendritic Ca2+ transients in hippocampal brain slices during simultaneous current- and voltage-clamp recording.Microsc Res Tech. 1994 Nov 1;29(4):279-89. doi: 10.1002/jemt.1070290404. Microsc Res Tech. 1994. PMID: 7841500
-
Imaging Submillisecond Membrane Potential Changes from Individual Regions of Single Axons, Dendrites and Spines.Adv Exp Med Biol. 2015;859:57-101. doi: 10.1007/978-3-319-17641-3_3. Adv Exp Med Biol. 2015. PMID: 26238049 Free PMC article. Review.
-
Spatial and temporal aspects of neuronal calcium and sodium signals measured with low-affinity fluorescent indicators.Pflugers Arch. 2024 Jan;476(1):39-48. doi: 10.1007/s00424-023-02865-1. Epub 2023 Oct 6. Pflugers Arch. 2024. PMID: 37798555 Review.
Cited by
-
Temporal dynamics of Na/K pump mediated memory traces: insights from conductance-based models of Drosophila neurons.Front Neurosci. 2023 May 22;17:1154549. doi: 10.3389/fnins.2023.1154549. eCollection 2023. Front Neurosci. 2023. PMID: 37284663 Free PMC article.
-
Comparison of fluorescence probes for intracellular sodium imaging in prostate cancer cell lines.Eur Biophys J. 2016 Oct;45(7):765-777. doi: 10.1007/s00249-016-1173-7. Epub 2016 Sep 22. Eur Biophys J. 2016. PMID: 27660079 Free PMC article.
-
Fast Synaptically Activated Calcium and Sodium Kinetics in Hippocampal Pyramidal Neuron Dendritic Spines.eNeuro. 2022 Nov 29;9(6):ENEURO.0396-22.2022. doi: 10.1523/ENEURO.0396-22.2022. Print 2022 Nov-Dec. eNeuro. 2022. PMID: 36379712 Free PMC article.
-
Ca2+ entry through NaV channels generates submillisecond axonal Ca2+ signaling.Elife. 2020 Jun 17;9:e54566. doi: 10.7554/eLife.54566. Elife. 2020. PMID: 32553116 Free PMC article.
-
The Mammalian Olfactory Bulb Contributes to the Adaptation of Odor Responses: A Second Perceptual Computation Carried Out by the Bulb.eNeuro. 2021 Sep 24;8(5):ENEURO.0322-21.2021. doi: 10.1523/ENEURO.0322-21.2021. Print 2021 Sep-Oct. eNeuro. 2021. PMID: 34380657 Free PMC article.
References
-
- Callaway JC, Ross WN (1997) Spatial distribution of synaptically activated sodium concentration changes in cerebellar Purkinje neurons. J Neurophysiol 77:145–152 . - PubMed
Publication types
MeSH terms
Substances
Grants and funding
LinkOut - more resources
Full Text Sources
Miscellaneous