. 2016 Mar:277:124-138.
doi: 10.1016/j.expneurol.2015.12.020. Epub 2015 Dec 28.

Disconnection and hyper-connectivity underlie reorganization after TBI: A rodent functional connectomic analysis

Affiliations

Disconnection and hyper-connectivity underlie reorganization after TBI: A rodent functional connectomic analysis

N G Harris et al. Exp Neurol. 2016 Mar.

Abstract

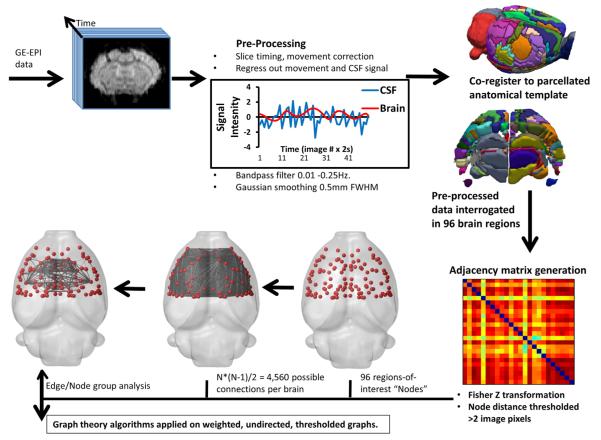
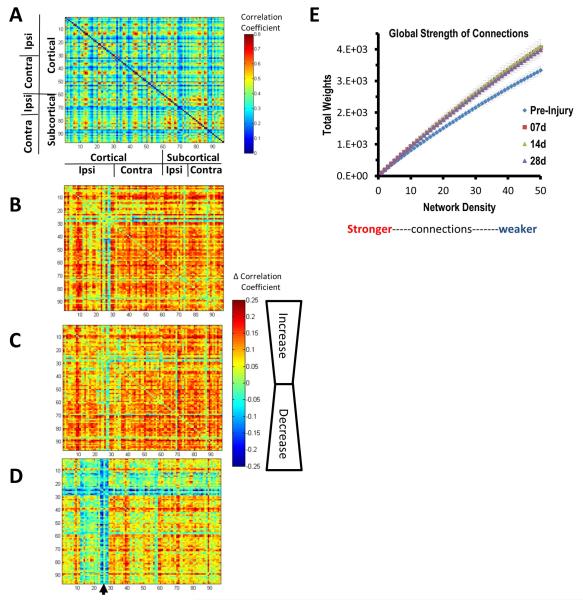
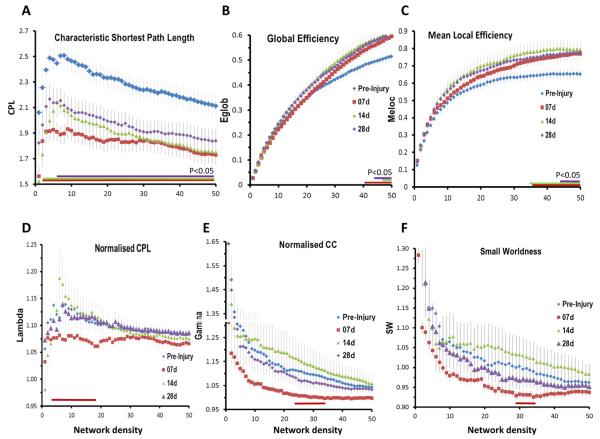
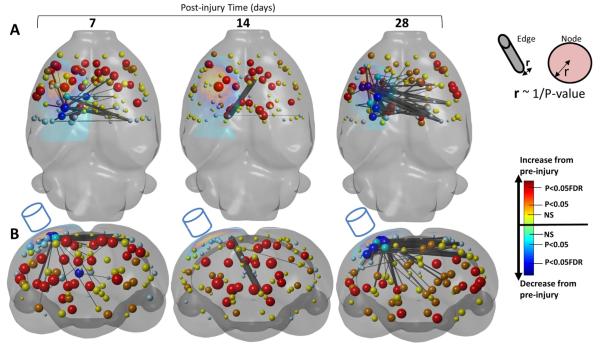
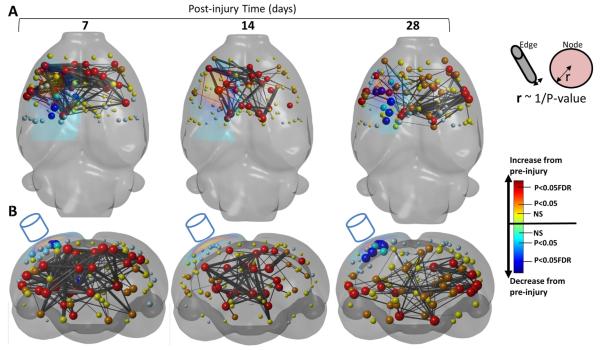
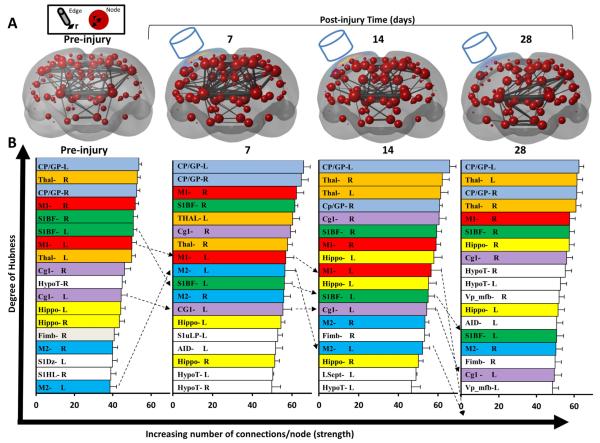
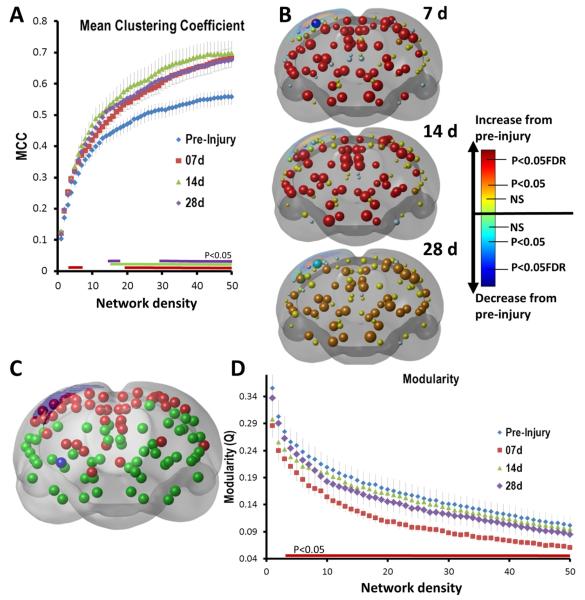
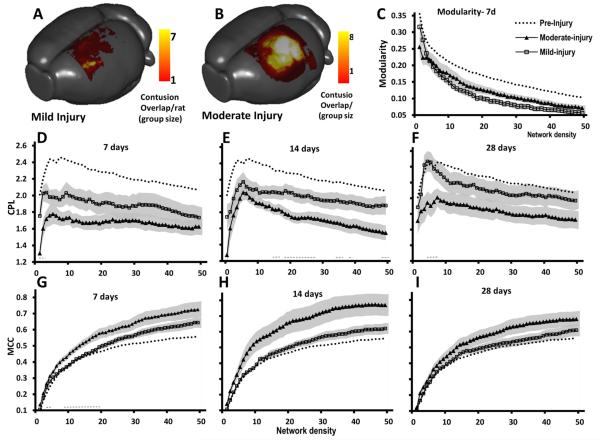
While past neuroimaging methods have contributed greatly to our understanding of brain function after traumatic brain injury (TBI), resting state functional MRI (rsfMRI) connectivity methods have more recently provided a far more unbiased approach with which to monitor brain circuitry compared to task-based approaches. However, current knowledge on the physiologic underpinnings of the correlated blood oxygen level dependent signal, and how changes in functional connectivity relate to reorganizational processes that occur following injury is limited. The degree and extent of this relationship remain to be determined in order that rsfMRI methods can be fully adapted for determining the optimal timing and type of rehabilitative interventions that can be used post-TBI to achieve the best outcome. Very few rsfMRI studies exist after experimental TBI and therefore we chose to acquire rsfMRI data before and at 7, 14 and 28 days after experimental TBI using a well-known, clinically-relevant, unilateral controlled cortical impact injury (CCI) adult rat model of TBI. This model was chosen since it has widespread axonal injury, a well-defined time-course of reorganization including spine, dendrite, axonal and cortical map changes, as well as spontaneous recovery of sensorimotor function by 28 d post-injury from which to interpret alterations in functional connectivity. Data were co-registered to a parcellated rat template to generate adjacency matrices for network analysis by graph theory. Making no assumptions about direction of change, we used two-tailed statistical analysis over multiple brain regions in a data-driven approach to access global and regional changes in network topology in order to assess brain connectivity in an unbiased way. Our main hypothesis was that deficits in functional connectivity would become apparent in regions known to be structurally altered or deficient in axonal connectivity in this model. The data show the loss of functional connectivity predicted by the structural deficits, not only within the primary sensorimotor injury site and pericontused regions, but the normally connected homotopic cortex, as well as subcortical regions, all of which persisted chronically. Especially novel in this study is the unanticipated finding of widespread increases in connection strength that dwarf both the degree and extent of the functional disconnections, and which persist chronically in some sensorimotor and subcortically connected regions. Exploratory global network analysis showed changes in network parameters indicative of possible acutely increased random connectivity and temporary reductions in modularity that were matched by local increases in connectedness and increased efficiency among more weakly connected regions. The global network parameters: shortest path-length, clustering coefficient and modularity that were most affected by trauma also scaled with the severity of injury, so that the corresponding regional measures were correlated to the injury severity most notably at 7 and 14 days and especially within, but not limited to, the contralateral cortex. These changes in functional network parameters are discussed in relation to the known time-course of physiologic and anatomic data that underlie structural and functional reorganization in this experiment model of TBI.

Keywords: Bold; Connectivity; Controlled cortical impact; Plasticity; Rat; Reorganization; Resting state fMRI.


Figures

Fig. 1
Fig. 1
Network analysis pipeline used for rodent brain.
Fig. 2
Fig. 2
Gross changes in functional correlation post-injury. [A] The pre-injury, group mean correlation matrix for all 96 regions examined and group mean difference matrices (injured — pre-injury) for [B] 7 days, [C] 14 days and [D] 28 days after injury showing that in addition to the expected decreases in ipsilateral S1 connectivity at 28 days (arrow in [D]) there were widespread increases in regional BOLD signal correlation coefficients at 7 and 14 days which persisted in contralateral cortical and bilateral subcortical areas to 28 days post-injury. [E] The total weight of connections over the whole brain was significantly greater at all times after injury and at all network density levels examined (P < 0.05, 2-tailed t-test). The greatest difference to pre-injury was clearly among the more weakly connected regions at the higher range of density values. All matrices were unthresholded at the 35% density level.
Fig. 3
Fig. 3
Global measures of network connectivity after TBI. [A] The characteristic shortest path length (CPL) was significantly reduced from pre-injury values at all times after injury and at all connection strengths. This was particularly evident at 7 days after injury and although CPL values partially resolved towards pre-injury levels among the strongest connections at 14 days, and among all density levels by 28 days, CPL remained significantly shorter than pre-injury at the majority of density levels examined. [B] Global efficiency (Eglob) and [C] mean local efficiency (Meloc) were significantly increased at all times after injury but only among the weaker connections levels. Normalized CPL and CC were reduced from pre-injury only at 7 days after injury and only significantly at small density ranges. The quotient of these at 7 days small worldness was also lower overall density ranges compared to pre-injury. Data are means ± sems; colored horizontal bars indicate P < 0.05 compared to pre-injury, two-tailed t-test). (For interpretation of the references to color in this figure legend, the reader is referred to the web version of this article.)
Fig. 4
Fig. 4
Loss of functional connectivity. [A] Axial and [B] coronal, 3-dimensional-rendered statistical difference plots of node and decrease in edge strength at 7, 14 and 28 days after contusion injury (surface-projected yellow region on left of each brain ~ mean contusion volume) compared to pre-injured showing the brain regions of significant loss of functional connectivity (edge strength, black/gray bars, P < 0.005 FDR corrected) that occur mainly within regions of significant loss of nodal connectedness (node strength spheres, dark blue — q = 0.05, FDR-corrected, turquoise — P < 0.05, uncorrected, light blue — decrease from pre-injury P > 0.05). There was a loss of connectivity around peri-contusional regions (edges of yellow surface-projected region plotted on the left of each brain) at 7 days post-injury combined with some early loss of inter-hemispheric and subcortical connectivity. This was less evident at 14 days but became even more pronounced at 28 days. Key: node and edge radii are equivalent to the reciprocal of the P value between pre- and post-injury time-point of connection strength. Node colors represent the probability levels that describe the difference compared to pre-injury. Red — increase from pre-injury (q = 0.05, FDR-corrected) orange — increase from pre-injury (P < 0.05, uncorrected), yellow circles — increase from pre-injury (P > 0.05). (For interpretation of the references to color in this figure legend, the reader is referred to the web version of this article.)
Fig. 5
Fig. 5
Summary plots of edge connectivity changes after injury. The number of significant decreases [A] and increases [B] in edge connections per brain region at 7 and 28 days after injury compared to pre-injury was summed for all 96 nodes examined. The mean contusion volume is shown as a surface-projected black region. [A] Decreases in connectivity were relatively mild at 7 days after injury but this expanded to the ipsilateral cortex, thalamus and hippocampus and to the contralesional cortex by 28 days. [B] Increases in connectivity were especially marked early after injury in bilaterally in both cortical and subcortical regions. This persisted until 28 days only in bilateral subcortical regions and some contralesional and ipsilesional pericontusional regions. Key: colors denote the number of significant changes in connections compared to pre-injury. (For interpretation of the references to color in this figure legend, the reader is referred to the web version of this article.)
Fig. 6
Fig. 6
Increase in functional connectivity. [A] Axial and [B] coronal, 3-dimensional-rendered statistical difference plots of node and increased in edge strength at 7, 14 and 28 days after injury compared to pre-injured showing the brain regions of significant increase in connectivity (edge strength, black/gray bars, q = 0.005 FDR corrected) that occur almost exclusively in regions of low nodal connectedness (node strength data is repeated here from Fig. 4). The greatest increase in connectivity occurred at 7 days after injury over wide areas of the brain. Increased connectivity persisted until 14 and 28 days where enhanced connections were largely subcortical and contra-lesional cortex. Key — see Fig. 3.
Fig. 7
Fig. 7
Change in degree of hubness. [A] Coronal, 3-dimensional, rendered plots showing group mean node strength of connection (radii of node ~ mean number of weighted nodal connections at 35% network density) and mean connection strength between nodes among the top 2% of connections (edge radii ~ number of node-to-node connections) before and at 7, 14 and 28 days after injury. The average contusion size is superimposed on the left cortical surface and the cylinder represents the approximate impact of the injury device. [B] Mean node strength (the sum of the weights of the edges connected to each node at 35% network density) was calculated for each node, ranked at each time-point and the top 20% were plotted to assess the change among the most highly connected hub nodes. Injury resulted in progressive reductions in the rank of ipsi-lesional, highly connected cortical hubs that were adjacent to the primary injury site (S1BF-L, M1-L, Cg1-L) and also a transient increase in M2-L cortex at 7 days (hatched lines). Despite significant alterations in subcortical connectivity (see text), the Thal and CP-GP regions remained the most highly connected areas of the brain. Key: CP-GP = caudate putamen and globus pallidus, Cg1 = cingulate cortex, Fimb = fimbria, Hippo = hippocampus, HypoT = hypothalamus, M1, M2 = motor cortex, S1Dz/S1HL/S1uLP = sensory cortex dysgranular/hindlimb/upper lip region, L.Septn. = lateral septal nucleus, Thal = thalamus, Vp_mfb = ventral palladium and medial forebrain bundle.
Fig. 8
Fig. 8
Early and persistent increases in local connectedness and a temporary decrease in modularity. The mean clustering coefficient (MCC), an indication of the local connectedness of networks was assessed at [A] an average nodal (global) level and [B] a regional nodal level. [A] MCC was significantly increased from 7 days after injury compared to pre-injured over both strongly connected and at more weakly connected ranges (3–6%, 19–50%). This persisted until 28 d at 20–50% density levels (colored horizontal bars indicate P < 0.05 compared to pre-injury, two-tailed t-test; data are means ± sem). [B] 3-Dimensional, rendered, coronal plots of statistically different changes in regional (node) MCC at 7, 14 and 28 d post-injury compared to pre-injury. Apart from significant decreases in local connectedness within the primary cortical injury site (blue spheres; see Fig. 3 for key), there was a brain-wide increase in local connectivity that persisted among many regions for 14 days after injury (red spheres, q = 0.05, FDR corrected) and until 28 days (orange nodes, P < 0.05, uncorrected). [C] Modularity — the degree to which network circuitry is organized in a similar community structure was determined for unthresholded data over all groups. Two major modules were found corresponding to cortical and subcortical regions (red and green nodes, respectively). [D] Modularity was decreased at 7 days after injury, but not at any other time. This was significant over the majority of the density levels examined indicating a robust effect (P < 0.05, two-tailed t-test). (For interpretation of the references to color in this figure legend, the reader is referred to the web version of this article.)
Fig. 9
Fig. 9
Global CPL and MCC parameters of network-based functional connectivity do not significantly discriminate between different injury severities. Surface-projection plots of mean contusion size among [A] mild versus [B] moderately-injured rats at 28 days (color is equivalent to number of rats with an overlapping contusion site). Although there was a trend towards mild (square symbols) and moderate (triangular symbols) injury group differences in both global CPL [C–E] and MCC [F–H] network parameters at most density levels and at all time-after injury, CPL was significantly lower after moderate compared to mild injury, most notably at mid-range density values at 14 days [D] while MCC values were significantly higher after moderate injury compared to mild injury at low density levels only at 7 days [F] (horizontal dashed line = P < 0.05, 2 tailed t-test). Symbol values are group means and shaded area is standard error. Dotted line data represent pre-injury mean values of all rats for comparison.
Fig. 10
Fig. 10
Earlier but not later post-injury increases in regional network parameters of functional connectivity are associated with the degree of injury. Linear regression analysis was performed on the network parameter data (strength, local clustering coefficient [CC] and local regional efficiency [EREG]) from each of the 96 nodes for each time point after injury versus final contusion volume at 28 days. Analysis yielded significant positive correlations for all three network parameters in a number of brain regions (P < 0.05, r range = 0.26– 0.59). Data are plotted as the presence or absence of significant nodal correlations along Y and at each brain (node) region along X at 7, 14 and 28 days post-injury. Data indicate that post-injury changes in these network parameters are associated with a change in injury severity (contusion volume) at 7 and 14 days, and this is most notable within the contralateral regions for strength and EREG at 7 and 14 days post-injury.

References

    1. Abdelnour F, Voss HU, Raj A. Network diffusion accurately models the relationship between structural and functional brain connectivity networks. NeuroImage. 2014;90:335–347. http://dx.doi.org/10.1016/j.neuroimage.2013.12.039. - DOI - PMC - PubMed
    1. de Arcangelis L, Herrmann HJ. Activity-dependent neuronal model on complex networks. Front. Physiol. 2012;3:1–9. http://dx.doi.org/10.3389/fphys.2012.00062 (MAR) - DOI - PMC - PubMed
    1. Benali A, Weiler E, Benali Y, et al. Excitation and inhibition jointly regulate cortical reorganization in adult rats. J. Neurosci. 2008;28:12284–12293. http://dx.doi.org/10.1523/JNEUROSCI.1952-08.2008. - DOI - PMC - PubMed
    1. Biswal B, Yetkin FZ, Haughton VM, Hyde JS. Functional connectivity in the motor cortex of resting human brain using echo-planar MRI. Magn. Reson. Med. 1995;34:537–541. - PubMed
    1. Blondel VD, Guillaume J-L, Lambiotte R, Lefebvre E. Fast unfolding of communities in large networks. J. Stat. Mech. 2008;10:P10008. http://dx.doi.org/10.1088/1742-5468/2008/10/P10008. - DOI

Publication types