

Time-Course Analysis of Brain Regional Expression Network Responses to Chronic Intermittent Ethanol and Withdrawal: Implications for Mechanisms Underlying Excessive Ethanol Consumption
- PMID: 26730594
- PMCID: PMC4701666
- DOI: 10.1371/journal.pone.0146257
Time-Course Analysis of Brain Regional Expression Network Responses to Chronic Intermittent Ethanol and Withdrawal: Implications for Mechanisms Underlying Excessive Ethanol Consumption
Erratum in
-
Correction: Time-Course Analysis of Brain Regional Expression Network Responses to Chronic Intermittent Ethanol and Withdrawal: Implications for Mechanisms Underlying Excessive Ethanol Consumption.PLoS One. 2019 Jun 18;14(6):e0218700. doi: 10.1371/journal.pone.0218700. eCollection 2019. PLoS One. 2019. PMID: 31211793 Free PMC article.
Abstract
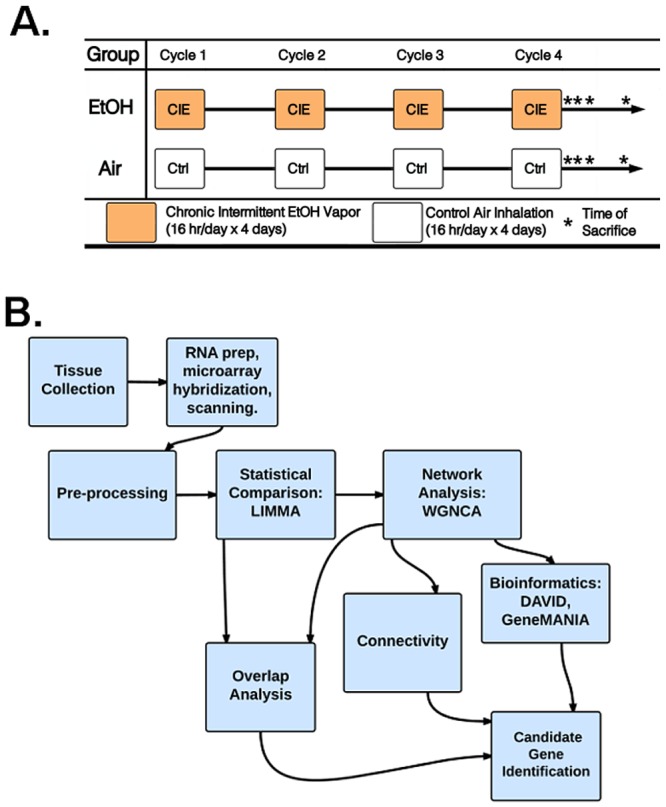
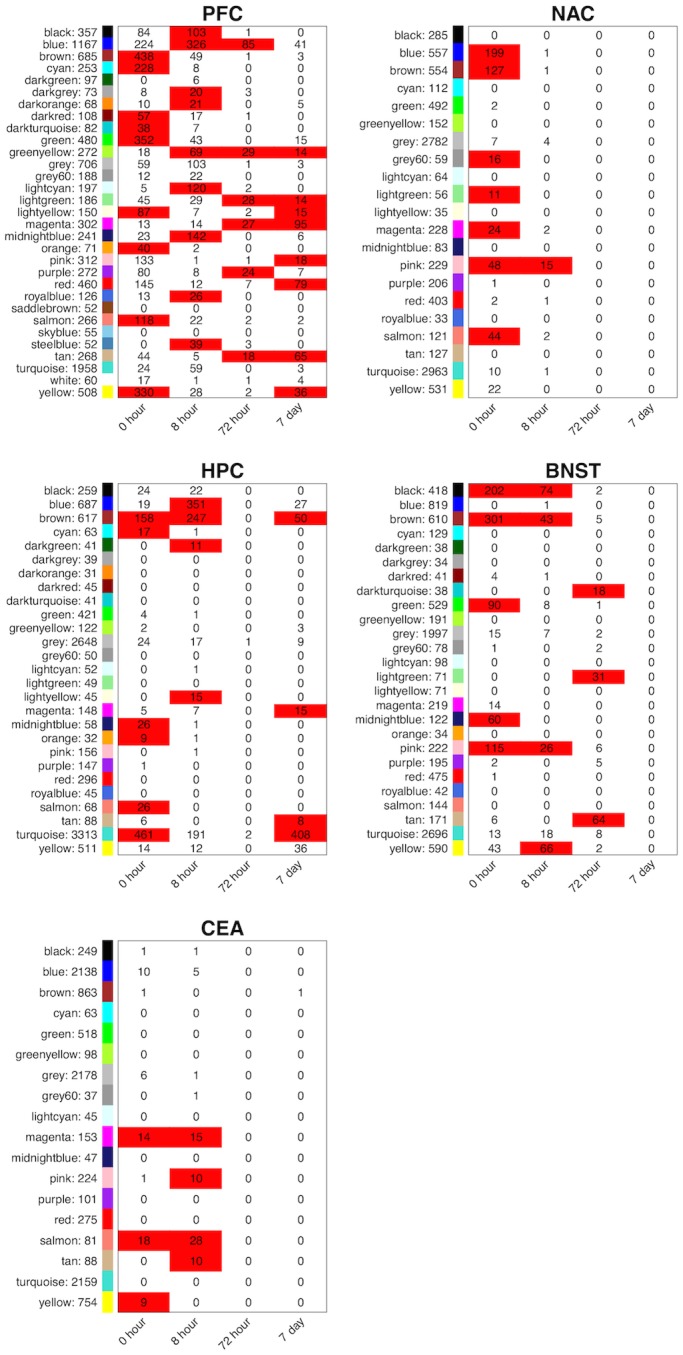
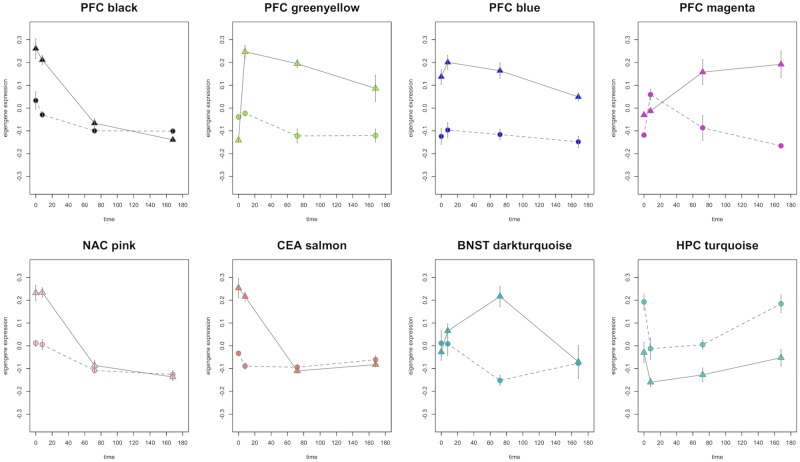
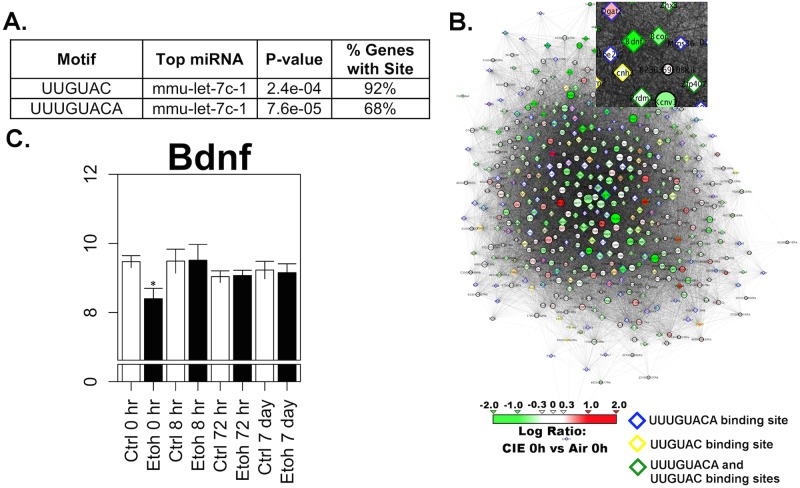
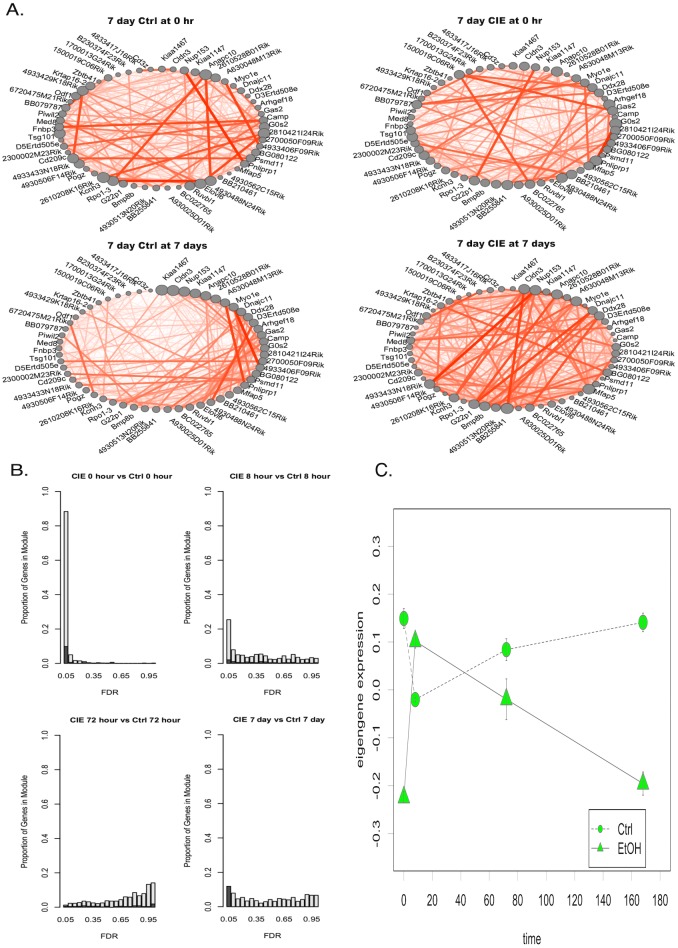
Long lasting abusive consumption, dependence, and withdrawal are characteristic features of alcohol use disorders (AUD). Mechanistically, persistent changes in gene expression are hypothesized to contribute to brain adaptations leading to ethanol toxicity and AUD. We employed repeated chronic intermittent ethanol (CIE) exposure by vapor chamber as a mouse model to simulate the cycles of ethanol exposure and withdrawal commonly seen with AUD. This model has been shown to induce progressive ethanol consumption in rodents. Brain CIE-responsive expression networks were identified by microarray analysis across five regions of the mesolimbic dopamine system and extended amygdala with tissue harvested from 0-hours to 7-days following CIE. Weighted Gene Correlated Network Analysis (WGCNA) was used to identify gene networks over-represented for CIE-induced temporal expression changes across brain regions. Differential gene expression analysis showed that long-lasting gene regulation occurred 7-days after the final cycle of ethanol exposure only in prefrontal cortex (PFC) and hippocampus. Across all brain regions, however, ethanol-responsive expression changes occurred mainly within the first 8-hours after removal from ethanol. Bioinformatics analysis showed that neuroinflammatory responses were seen across multiple brain regions at early time-points, whereas co-expression modules related to neuroplasticity, chromatin remodeling, and neurodevelopment were seen at later time-points and in specific brain regions (PFC or HPC). In PFC a module containing Bdnf was identified as highly CIE responsive in a biphasic manner, with peak changes at 0 hours and 5 days following CIE, suggesting a possible role in mechanisms underlying long-term molecular and behavioral response to CIE. Bioinformatics analysis of this network and several other modules identified Let-7 family microRNAs as potential regulators of gene expression changes induced by CIE. Our results suggest a complex temporal and regional pattern of widespread gene network responses involving neuroinflammatory and neuroplasticity related genes as contributing to physiological and behavioral responses to chronic ethanol.
Conflict of interest statement
Figures


Similar articles
-
Brain regional gene expression network analysis identifies unique interactions between chronic ethanol exposure and consumption.PLoS One. 2020 May 29;15(5):e0233319. doi: 10.1371/journal.pone.0233319. eCollection 2020. PLoS One. 2020. PMID: 32469986 Free PMC article.
-
The allostatic impact of chronic ethanol on gene expression: A genetic analysis of chronic intermittent ethanol treatment in the BXD cohort.Alcohol. 2017 Feb;58:93-106. doi: 10.1016/j.alcohol.2016.07.010. Epub 2016 Nov 1. Alcohol. 2017. PMID: 27838001 Free PMC article.
-
miRNA and mRNA expression profiling in rat brain following alcohol dependence and withdrawal.Cell Mol Biol (Noisy-le-grand). 2017 Feb 28;63(2):49-56. doi: 10.14715/cmb/2017.63.2.7. Cell Mol Biol (Noisy-le-grand). 2017. PMID: 28364783
-
Ethanol-sensitive brain regions in rat and mouse: a cartographic review, using immediate early gene expression.Alcohol Clin Exp Res. 2009 Jun;33(6):945-69. doi: 10.1111/j.1530-0277.2009.00916.x. Epub 2009 Mar 19. Alcohol Clin Exp Res. 2009. PMID: 19302091 Review.
-
[Epigenetic mechanisms and alcohol use disorders: a potential therapeutic target].Biol Aujourdhui. 2017;211(1):83-91. doi: 10.1051/jbio/2017014. Epub 2017 Jul 6. Biol Aujourdhui. 2017. PMID: 28682229 Review. French.
Cited by
-
Targeting the intracellular signaling "STOP" and "GO" pathways for the treatment of alcohol use disorders.Psychopharmacology (Berl). 2018 Jun;235(6):1727-1743. doi: 10.1007/s00213-018-4882-z. Epub 2018 Apr 14. Psychopharmacology (Berl). 2018. PMID: 29654346 Free PMC article. Review.
-
Plasminogen activator system homeostasis and its dysregulation by ethanol in astrocyte cultures and the developing brain.Neuropharmacology. 2018 Aug;138:193-209. doi: 10.1016/j.neuropharm.2018.06.004. Epub 2018 Jun 6. Neuropharmacology. 2018. PMID: 29885422 Free PMC article.
-
Genetic divergence in the transcriptional engram of chronic alcohol abuse: A laser-capture RNA-seq study of the mouse mesocorticolimbic system.Alcohol. 2017 Feb;58:61-72. doi: 10.1016/j.alcohol.2016.09.001. Epub 2016 Oct 15. Alcohol. 2017. PMID: 27894806 Free PMC article.
-
Operant over-responding is more sensitive than reversal learning for revealing behavioral changes after withdrawal from alcohol consumption.Physiol Behav. 2018 Nov 1;196:176-184. doi: 10.1016/j.physbeh.2018.08.021. Epub 2018 Sep 4. Physiol Behav. 2018. PMID: 30189181 Free PMC article.
-
Blood and brain gene expression signatures of chronic intermittent ethanol consumption in mice.PLoS Comput Biol. 2022 Feb 17;18(2):e1009800. doi: 10.1371/journal.pcbi.1009800. eCollection 2022 Feb. PLoS Comput Biol. 2022. PMID: 35176017 Free PMC article.
References
-
- American Psychiatric Association APADSMTF. Diagnostic and statistical manual of mental disorders: DSM-5 2013. Available from: http://dsm.psychiatryonline.org/book.aspx?bookid=556.
-
- Schuckit MA. Low level of response to alcohol as a predictor of future alcoholism. The American journal of psychiatry. 1994;151(2):184–9. Epub 1994/02/01. . - PubMed
-
- Kerns RT, Ravindranathan A, Hassan S, Cage MP, York T, Sikela JM, et al. Ethanol-responsive brain region expression networks: implications for behavioral responses to acute ethanol in DBA/2J versus C57BL/6J mice. The Journal of neuroscience: the official journal of the Society for Neuroscience. 2005;25(9):2255–66. Epub 2005/03/05. 10.1523/jneurosci.4372-04.2005 . - DOI - PMC - PubMed
Publication types
MeSH terms
Substances
Grants and funding
LinkOut - more resources
Full Text Sources
Other Literature Sources
Molecular Biology Databases
Miscellaneous
