. 2016 Jan 5;12(1):e1004621.
doi: 10.1371/journal.pcbi.1004621. eCollection 2016 Jan.

Transient Accumulation of NO2- and N2O during Denitrification Explained by Assuming Cell Diversification by Stochastic Transcription of Denitrification Genes

Affiliations

Transient Accumulation of NO2- and N2O during Denitrification Explained by Assuming Cell Diversification by Stochastic Transcription of Denitrification Genes

Junaid Hassan et al. PLoS Comput Biol. .

Abstract

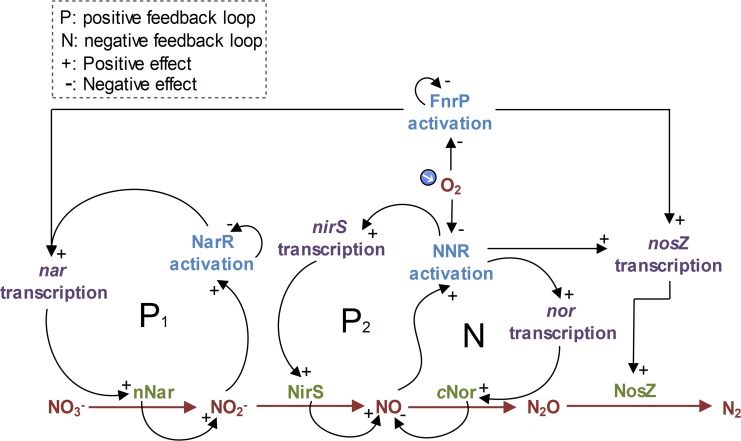
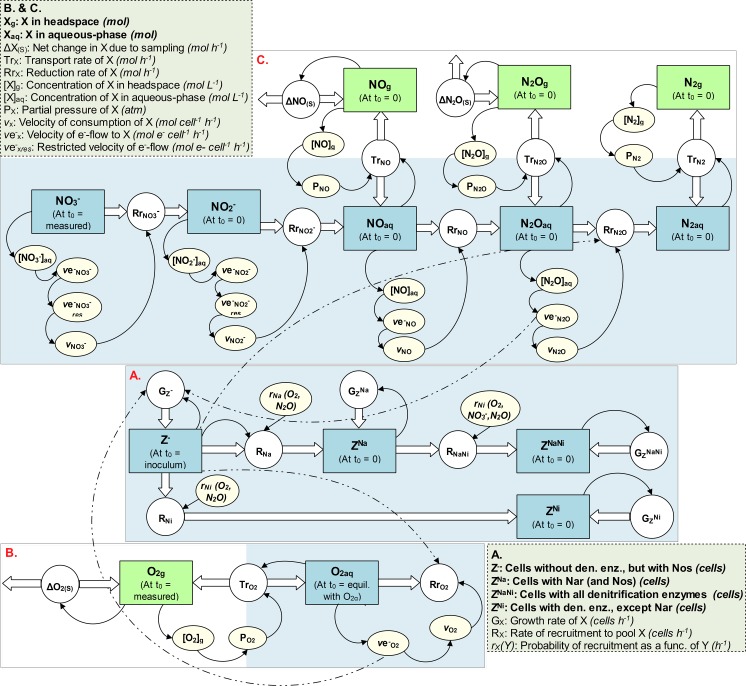
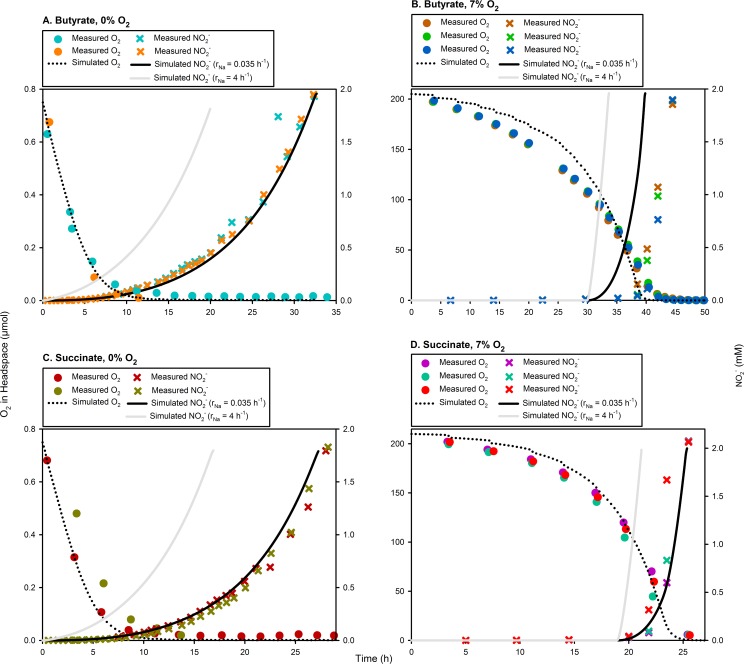
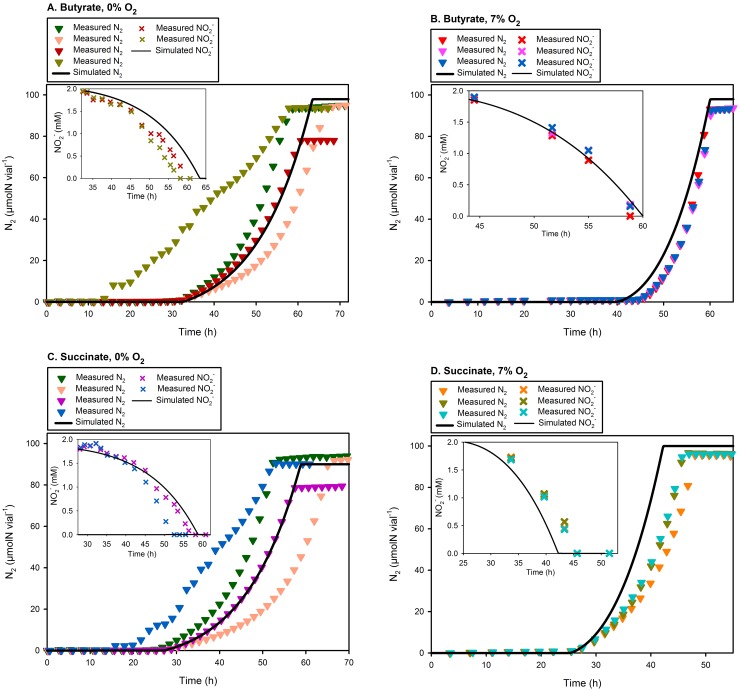
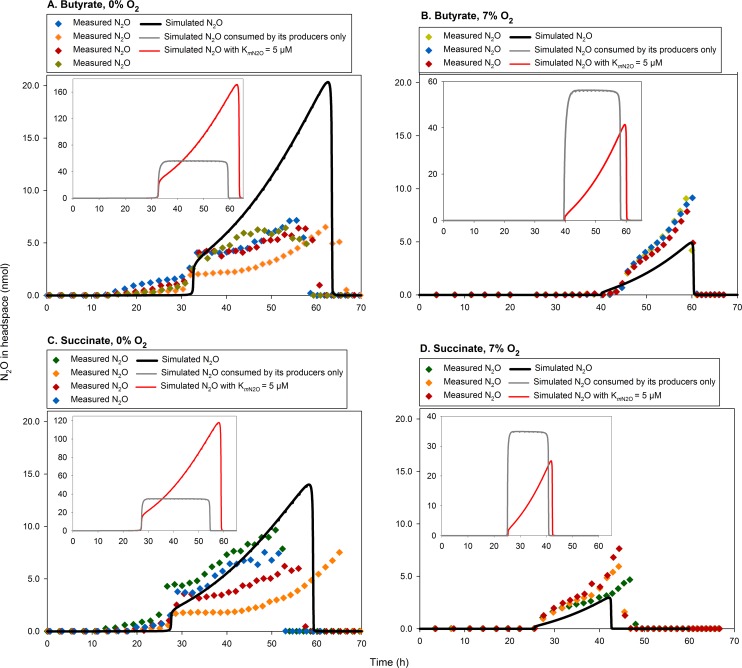
Denitrifying bacteria accumulate [Formula: see text], NO, and N2O, the amounts depending on transcriptional regulation of core denitrification genes in response to O2-limiting conditions. The genes include nar, nir, nor and nosZ, encoding [Formula: see text]-, [Formula: see text]-, NO- and N2O reductase, respectively. We previously constructed a dynamic model to simulate growth and respiration in batch cultures of Paracoccus denitrificans. The observed denitrification kinetics were adequately simulated by assuming a stochastic initiation of nir-transcription in each cell with an extremely low probability (0.5% h-1), leading to product- and substrate-induced transcription of nir and nor, respectively, via NO. Thus, the model predicted cell diversification: after O2 depletion, only a small fraction was able to grow by reducing [Formula: see text]. Here we have extended the model to simulate batch cultivation with [Formula: see text], i.e., [Formula: see text], NO, N2O, and N2 kinetics, measured in a novel experiment including frequent measurements of [Formula: see text]. Pa. denitrificans reduced practically all [Formula: see text] to [Formula: see text] before initiating gas production. The [Formula: see text] production is adequately simulated by assuming stochastic nar-transcription, as that for nirS, but with a higher probability (0.035 h-1) and initiating at a higher O2 concentration. Our model assumes that all cells express nosZ, thus predicting that a majority of cells have only N2O-reductase (A), while a minority (B) has [Formula: see text]-, NO- and N2O-reductase. Population B has a higher cell-specific respiration rate than A because the latter can only use N2O produced by B. Thus, the ratio [Formula: see text] is low immediately after O2 depletion, but increases throughout the anoxic phase because B grows faster than A. As a result, the model predicts initially low but gradually increasing N2O concentration throughout the anoxic phase, as observed. The modelled cell diversification neatly explains the observed denitrification kinetics and transient intermediate accumulations. The result has major implications for understanding the relationship between genotype and phenotype in denitrification research.


Conflict of interest statement

The authors have declared that no competing interests exist.

Figures

Fig 1
Fig 1. Regulatory network of denitrification in Pa. denitrificans.
The network is driven by four core enzyme-complexes: Nar (transmembrane nitrate reductase encoded by the narG gene), NirS (cytochrome cd 1 nitrite reductase encoded by nirS), cNor (NO reductase encoded by norBC), and NosZ (N2O reductase encoded by nosZ). When anoxia is imminent, the low [O2] is sensed by FnrP, which in some interplay with NarR induces nar transcription. NarR is activated by NO2; thus once a cell starts producing traces of NO2, nar expression becomes autocatalytic (see P1). Transcription of nirS is induced by NNR, which is activated under anoxic/micro-oxic conditions by NO; thus once traces of NO are produced, the expression of nirS also becomes autocatalytic (see P2) [20]. The activated P2 will also induce nor and nosZ transcription via NNR. The transcription of nosZ, however, can also be induced equally and independently by FnrP [24]. Micromolar concentrations of NO may inactivate both FnrP [25] and NosZ [26]. These observations, however, are ignored for our modelling because Pa. denitrificans restricts NO to nanomolar levels.
Fig 2
Fig 2. A stock and flow diagram illustrating the model’s structure.
A. Cell diversification and growth; B. O2 kinetics; C. Denitrification kinetics. The squares represent state variables, the circles the rate of change of the state variables, the edges (thicker arrows) depict flows into or out of the state variables, the shaded ovals auxiliary variables, and the arrows portray mutual dependencies between the variables. All feedback relationships among the three model sectors could not be shown; however, for illustration the feedback relationships of one sub-population (Z) are shown (dashed arrows). Within each square (state variable), t0 refers to the initial value.
Fig 3
Fig 3. Comparison of measured and simulated NO2 accumulation assuming definitive versus stochastic initiation of nar transcription.
To test the assumption of a single homogeneous population with almost all cells expressing nar in response to O2 depletion, we forced our model to achieve 98% Nar-positive cells (ZNa) within an hour by setting the specific-probability of initiating nar transcription (rNa) = 4 h-1. This resulted in grossly overestimated rates of NO2 accumulation for all treatments (grey curves). In contrast, we simulated the model with rNa = 0.035 h-1 obtained through optimisation, resulting in a reasonable agreement with measurements for all treatments (except for an apparent time frameshift for the Butyrate, 7% O2 treatment).
Fig 4
Fig 4. Comparison of measured and simulated data assuming stochastic initiation of nirS transcription.
Each panel compares the measured NO2 depletion (sub-panel) and N2 accumulation (main panel; n = 3–4) with simulations. The simulations are carried out with an optimised specific-probability of nirS transcriptional initiation (average rNi = 0.004 h-1, Eqs 4, 5, 6 and 7), allowing 7.7–22.1% of the population to produce NirS + cNor (Eq 8) during the available time-window (= 19.5–47.3 h).
Fig 5
Fig 5. Comparison of the measured N2O with that simulated.
Each main panel (A–D) compares the measured N2O (single vial results) with the default simulation using the parameter values given in Table 2, i.e., KmN2O = 0.6 μM (estimated through optimisation) and vemaxN2O = 5.5×10⁻¹⁵ mol e- cell-1 h-1 [24]. In contrast, each inserted panel shows the simulated N2O assuming 1) N2O consumption only by the cells producing N2O (ZNaNi + ZNi), and 2) the literature value for KmN2O = 5 μM [42]. The results show that the default simulation best explains the measured N2O kinetics, assuming its production by a small fraction (ZNaNi + ZNi) and consumption by the entire population (Z + ZNa+ ZNaNi + ZNi).

Similar articles

Cited by

References

    1. Ravishankara AR, Daniel JS, Portmann RW (2009) Nitrous oxide (N2O): the dominant ozone-depleting substance emitted in the 21st century Science 326: 123–125 10.1126/science.1176985 - DOI - PubMed
    1. Bates Bryson, Kundzewicz Zbigniew W., Wu Shaohong, Arnell Nigel, Burkett Virginia, et al. (2008) Technical paper on climate change and water Budapest: Intergovernmental Panel on Climate Change;
    1. Lassey K, Harvey M (2007) Nitrous oxide: the serious side of laughing gas. Water & Atmos 15: 10–11.
    1. Butterbach-Bahl K, Baggs EM, Dannenmann M, Kiese R, Zechmeister-Boltenstern S (2013) Nitrous oxide emissions from soils: how well do we understand the processes and their controls? Philos Trans R Soc Lond B Biol Sci 368: 20130122 10.1098/rstb.2013.0122 - DOI - PMC - PubMed
    1. Signor D, Cerri CEP (2013) Nitrous oxide emissions in agricultural soils: a review. Pesq Agropec Trop 43: 322–338.

Publication types

MeSH terms

LinkOut - more resources