

A systematic review of reported reassortant viral lineages of influenza A
- PMID: 26732146
- PMCID: PMC4702296
- DOI: 10.1186/s12879-015-1298-9
A systematic review of reported reassortant viral lineages of influenza A
Abstract
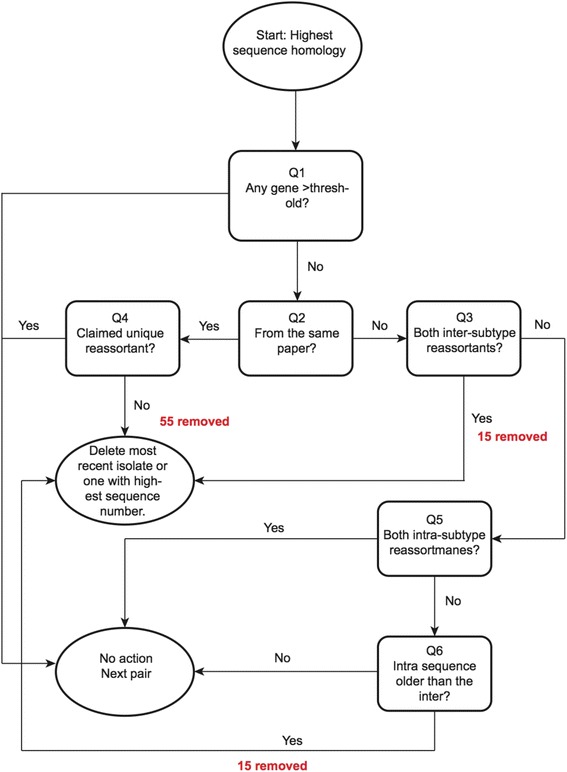
Background: Most previous evolutionary studies of influenza A have focussed on genetic drift, or reassortment of specific gene segments, hosts or subtypes. We conducted a systematic literature review to identify reported claimed reassortant influenza A lineages with genomic data available in GenBank, to obtain 646 unique first-report isolates out of a possible 20,781 open-access genomes.
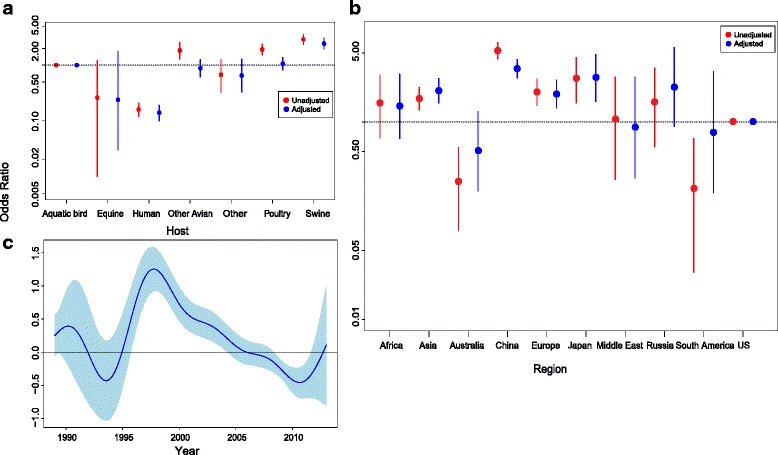
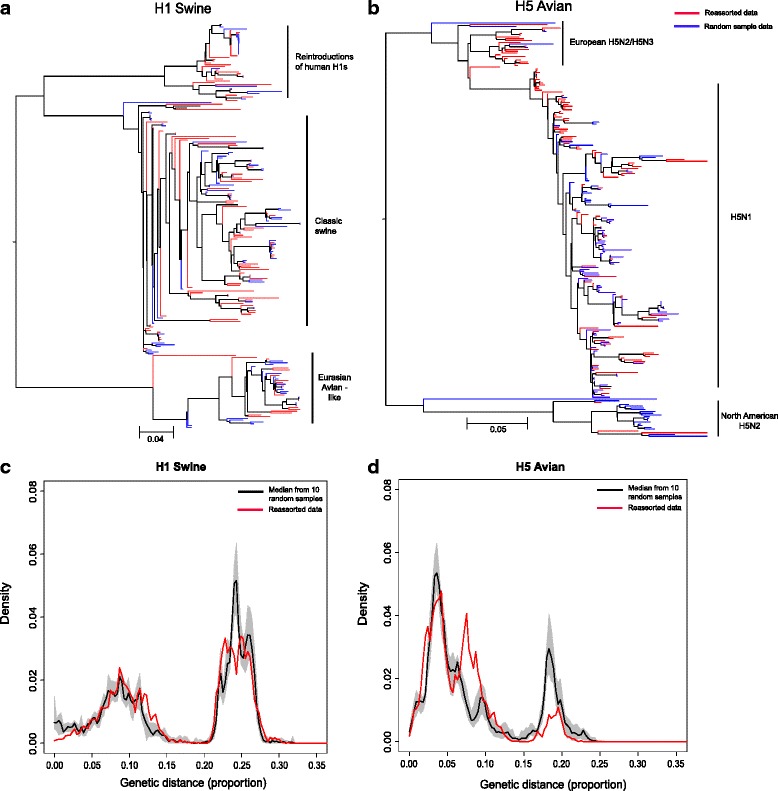
Results: After adjusting for correlations, only: swine as host, China, Europe, Japan and years between 1997 and 2002; remained as significant risk factors for the reporting of reassortant viral lineages. For swine H1, more reassortants were observed in the North American H1 clade compared with the Eurasian avian-like H1N1 clade. Conversely, for avian H5 isolates, a higher number of reported reassortants were observed in the European H5N2/H3N2 clade compared with the H5N2 North American clade.
Conclusions: Despite unavoidable biases (publication, database choice and upload propensity) these results synthesize a large majority of the current literature on novel reported influenza A reassortants and are a potentially useful prerequisite to inform further algorithmic studies.
Figures
Similar articles
-
Emergence and Evolution of Novel Reassortant Influenza A Viruses in Canines in Southern China.mBio. 2018 Jun 5;9(3):e00909-18. doi: 10.1128/mBio.00909-18. mBio. 2018. PMID: 29871917 Free PMC article.
-
Viral characterization of the reassortants between canine influenza H3N2 and human pandemic (2009) H1N1 and avian H9N2 viruses in canine ex vivo tracheal explants.Virol J. 2025 Jul 1;22(1):218. doi: 10.1186/s12985-025-02836-1. Virol J. 2025. PMID: 40597362 Free PMC article.
-
The genomic landscape of swine influenza A viruses in Southeast Asia.Proc Natl Acad Sci U S A. 2023 Aug 15;120(33):e2301926120. doi: 10.1073/pnas.2301926120. Epub 2023 Aug 8. Proc Natl Acad Sci U S A. 2023. PMID: 37552753 Free PMC article.
-
Neuraminidase inhibitors for preventing and treating influenza in healthy adults and children.Cochrane Database Syst Rev. 2012 Jan 18;1:CD008965. doi: 10.1002/14651858.CD008965.pub3. Cochrane Database Syst Rev. 2012. Update in: Cochrane Database Syst Rev. 2014 Apr 10;(4):CD008965. doi: 10.1002/14651858.CD008965.pub4. PMID: 22258996 Updated.
-
Prevalence of human influenza virus in Iran: Evidence from a systematic review and meta-analysis.Microb Pathog. 2018 Feb;115:168-174. doi: 10.1016/j.micpath.2017.12.064. Epub 2017 Dec 25. Microb Pathog. 2018. PMID: 29284132
Cited by
-
The Drift in Molecular Testing for Influenza: Mutations Affecting Assay Performance.J Clin Microbiol. 2018 Feb 22;56(3):e01531-17. doi: 10.1128/JCM.01531-17. Print 2018 Mar. J Clin Microbiol. 2018. PMID: 29305549 Free PMC article. Review.
-
MultiStageSearch: An Iterative Workflow for Unbiased Taxonomic Analysis of Pathogens Using Proteogenomics.J Proteome Res. 2025 Jun 6;24(6):2643-2656. doi: 10.1021/acs.jproteome.4c00901. Epub 2025 May 18. J Proteome Res. 2025. PMID: 40384001 Free PMC article.
-
A Novel lncRNA SAAL Suppresses IAV Replication by Promoting Innate Responses.Microorganisms. 2022 Nov 25;10(12):2336. doi: 10.3390/microorganisms10122336. Microorganisms. 2022. PMID: 36557591 Free PMC article.
-
Improving risk assessment of the emergence of novel influenza A viruses by incorporating environmental surveillance.Philos Trans R Soc Lond B Biol Sci. 2019 Sep 30;374(1782):20180346. doi: 10.1098/rstb.2018.0346. Epub 2019 Aug 12. Philos Trans R Soc Lond B Biol Sci. 2019. PMID: 31401963 Free PMC article.
-
A Multiplex Asymmetric Reverse Transcription-PCR Assay Combined With an Electrochemical DNA Sensor for Simultaneously Detecting and Subtyping Influenza A Viruses.Front Microbiol. 2018 Jun 27;9:1405. doi: 10.3389/fmicb.2018.01405. eCollection 2018. Front Microbiol. 2018. PMID: 30013525 Free PMC article.
References
Publication types
MeSH terms
Grants and funding
LinkOut - more resources
Full Text Sources
Other Literature Sources
