. 2016 Jan 6:7:10220.
doi: 10.1038/ncomms10220.

A microfluidic platform enabling single-cell RNA-seq of multigenerational lineages

Affiliations

A microfluidic platform enabling single-cell RNA-seq of multigenerational lineages

Robert J Kimmerling et al. Nat Commun. .

Abstract

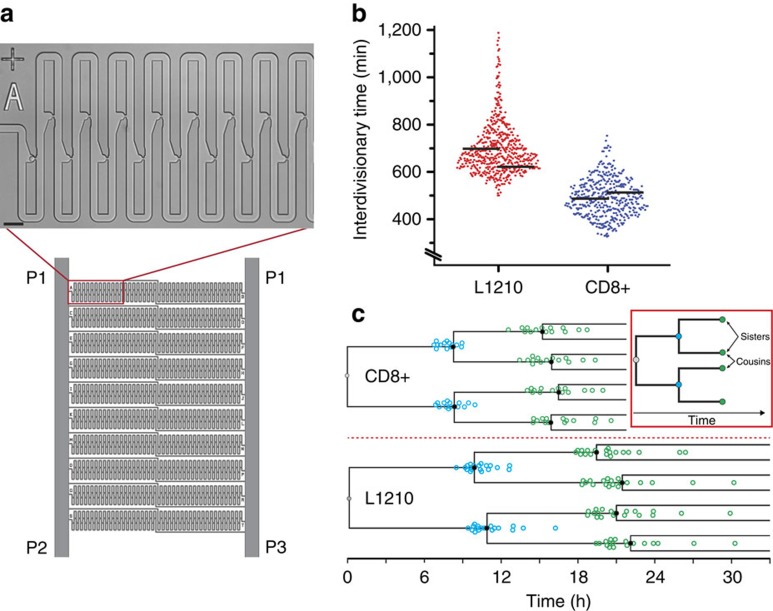
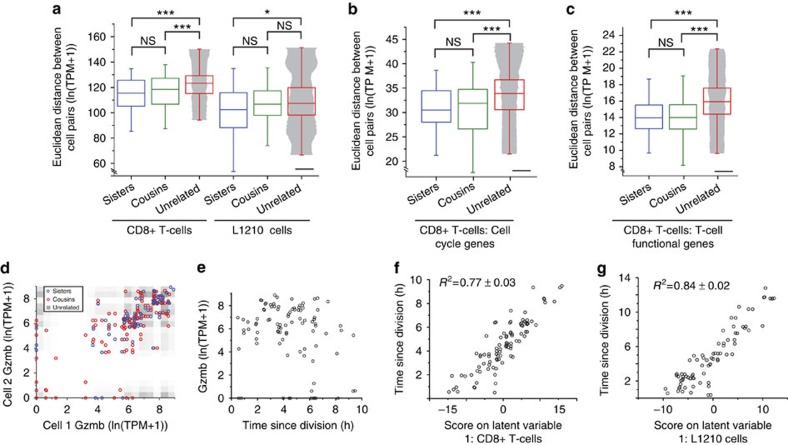
We introduce a microfluidic platform that enables off-chip single-cell RNA-seq after multi-generational lineage tracking under controlled culture conditions. We use this platform to generate whole-transcriptome profiles of primary, activated murine CD8+ T-cell and lymphocytic leukemia cell line lineages. Here we report that both cell types have greater intra- than inter-lineage transcriptional similarity. For CD8+ T-cells, genes with functional annotation relating to lymphocyte differentiation and function--including Granzyme B--are enriched among the genes that demonstrate greater intra-lineage expression level similarity. Analysis of gene expression covariance with matched measurements of time since division reveals cell type-specific transcriptional signatures that correspond with cell cycle progression. We believe that the ability to directly measure the effects of lineage and cell cycle-dependent transcriptional profiles of single cells will be broadly useful to fields where heterogeneous populations of cells display distinct clonal trajectories, including immunology, cancer, and developmental biology.


Figures

Figure 1
Figure 1. Microfluidic hydrodynamic trap array for single-cell lineage tracking.
(a) Schematic representation of the hydrodynamic trap array consisting of 20 lanes of traps (inset shows an optical micrograph of a single trapped cell—scale bar, 20 μm). Independent control of upstream (P1) and downstream (P2, P3) pressures enables continuous perfusion for long-term proliferation (Supplementary Movie 2), as well as single cell release from the device (Supplementary Movie 3, Supplementary Note 1). (b) Single-cell interdivisionary time measurements for a murine leukemia cell line (L1210, n=526) and primary CD8+ T-cells isolated from C57BL/6J mice (CD8+, n=418) collected with the hydrodynamic trap array. Overlaid black bars indicate the mean interdivisionary time measured on-chip (left) and the doubling time measurements collected for bulk cultures (right) of each cell type (Supplementary Fig. 3b). (c) Overlay of lineage trees from single CD8+ T cells (n=15) and L1210 cells (n=20) established with time-lapse imaging in the hydrodynamic trap array. As a demonstration of lineage construction, one lineage for each cell type (black circles) has connecting lines indicating familial history. The first division observed in the device corresponds to time zero for each lineage with subsequent points corresponding to the second (blue circles) and third (green circles) divisions on-chip. The inset demonstrates how sister and cousin cell pairs are defined for cell lineages released for sequencing.
Figure 2
Figure 2. Single-cell RNA-seq with known lineage relationships and times since division.
(a) Comparison of Euclidean distances (measured in log-transformed transcripts per million) between sister cells, cousin cells and unrelated cells for CD8+ T-cells (n=43, 73 and 4,544, respectively) and L1210 cells (n=37, 60 and 3,064, respectively) for the entire gene set (9,997 genes and 10,658 genes for CD8+ T-cells and L1210, respectively). Groups were compared with a Mann–Whitney U-test (Methods). The shaded area overlay on the unrelated cell pair measurements has a width corresponding to differences in time since division for these cells. The widths were constructed using a 250-point moving average of the pairwise differences in time since division for visual clarity. Scale bar, 3 h. (b) Same analysis as in (a) applied to a subset of genes with cell cycle-related gene annotations (688 genes total) for CD8+ T-cells. (c) Same analysis as in a,b applied to a subset of genes with gene annotations related to T-cell activation and function (142 genes total) for CD8+ T-cells. (Groups were compared with a Mann–Whitney U-test. After Bonferroni correction: *P<0.05, **P<0.01, ***P<0.001. Not-significant (NS) indicates a P value >0.05.) (d) Plot of Granzyme B expression levels (measured in log-transformed transcripts per million) in sister cell pairs (blue circles), cousin cell pairs (red circles) and unrelated cell pairs (grey scale density plot with darkest regions corresponding to highest relative occupancy). The correlation coefficients of related and unrelated cell pairs were compared with a Fisher's z transformation (P=0.005). (e) Plot of Granzyme B expression levels as a function of the time since division for each single cell. (f,g) Plot of scores on the first latent variable of partial least squares regression models constructed with expression measurements as predictor variables and the time since division for each single cell as the response variable for CD8+ T-cells (f) and L1210 cells (g). The final models were constructed with genes corresponding to the top 300 VIP scores for each cell type (Supplementary Fig. 9, Methods).

References

    1. Junker J. P. & van Oudenaarden A. Every cell is special: genome-wide studies add a new dimension to single-cell biology. Cell 157, 8–11 (2014). - PubMed
    1. Saliba A. E., Westermann A. J., Gorski S. A. & Vogel J. Single-cell RNA-seq: advances and future challenges. Nucleic Acids Res. 42, 8845–8860 (2014). - PMC - PubMed
    1. Patel A. P. et al. Single-cell RNA-seq highlights intratumoral heterogeneity in primary glioblastoma. Science 344, 1396–1401 (2014). - PMC - PubMed
    1. Shalek A. K. et al. Single-cell RNA-seq reveals dynamic paracrine control of cellular variation. Nature 510, 363–363 (2014). - PMC - PubMed
    1. Kumar R. M. et al. Deconstructing transcriptional heterogeneity in pluripotent stem cells. Nature 516, 56–U112 (2014). - PMC - PubMed

Publication types