. 2016 Jan 6:7:10261.
doi: 10.1038/ncomms10261.

Large-scale inference of protein tissue origin in gram-positive sepsis plasma using quantitative targeted proteomics

Affiliations

Large-scale inference of protein tissue origin in gram-positive sepsis plasma using quantitative targeted proteomics

Erik Malmström et al. Nat Commun. .

Abstract

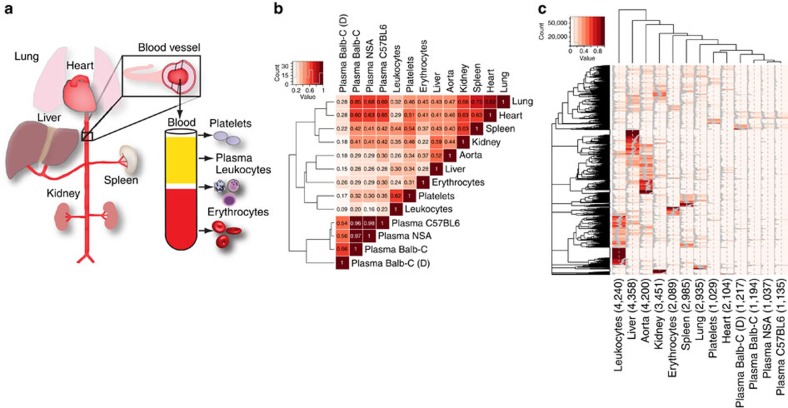
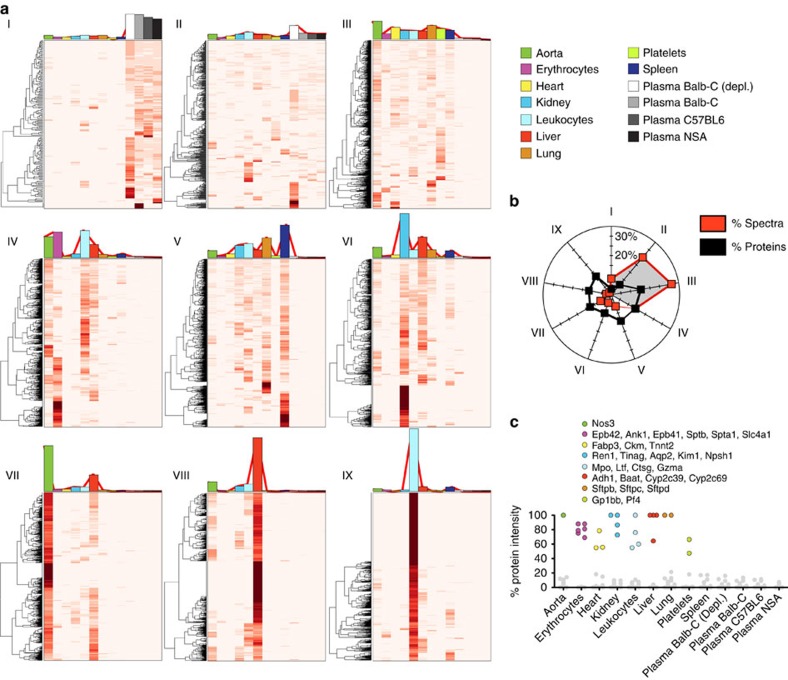
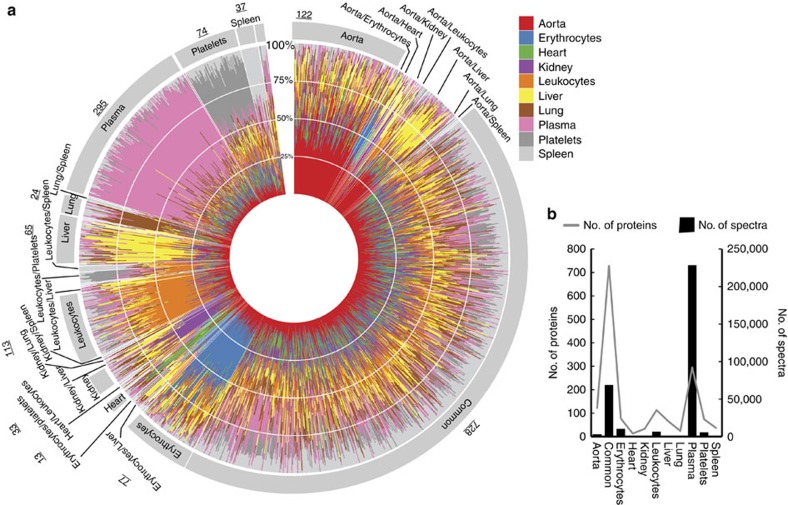
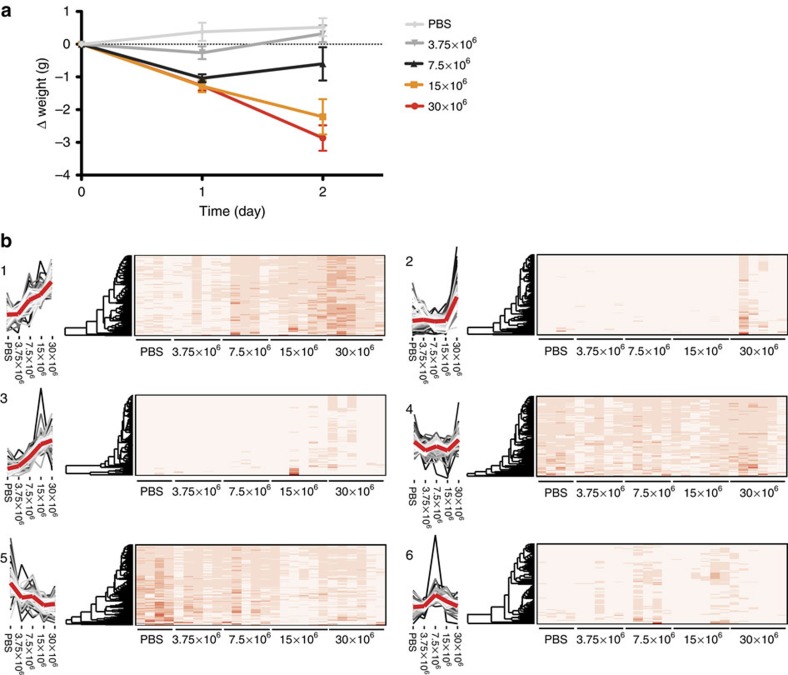
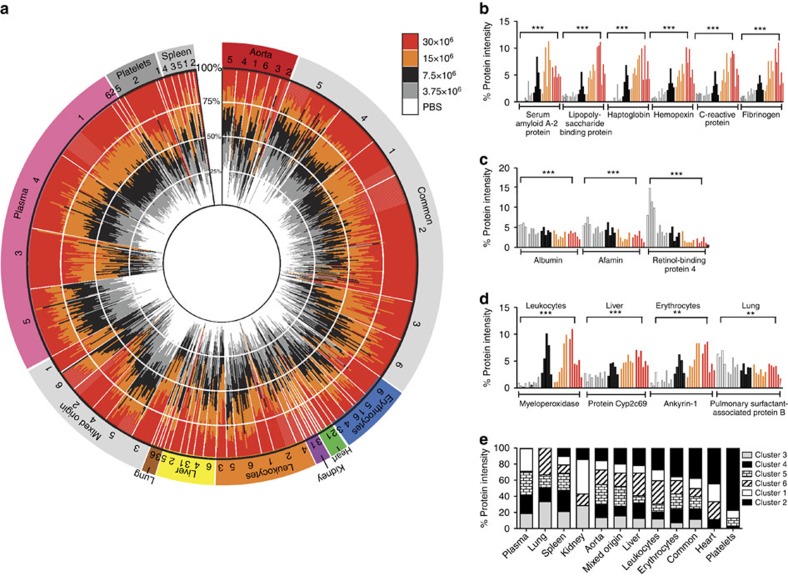
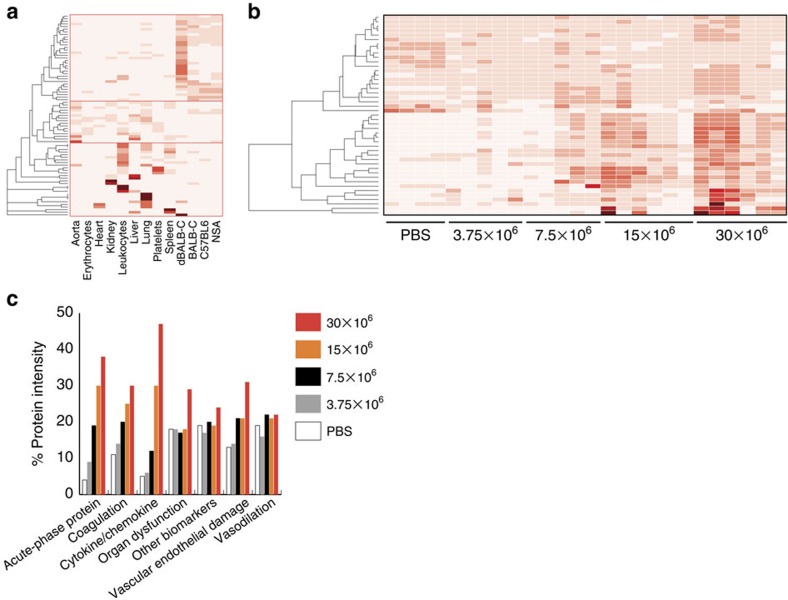
The plasma proteome is highly dynamic and variable, composed of proteins derived from surrounding tissues and cells. To investigate the complex processes that control the composition of the plasma proteome, we developed a mass spectrometry-based proteomics strategy to infer the origin of proteins detected in murine plasma. The strategy relies on the construction of a comprehensive protein tissue atlas from cells and highly vascularized organs using shotgun mass spectrometry. The protein tissue atlas was transformed to a spectral library for highly reproducible quantification of tissue-specific proteins directly in plasma using SWATH-like data-independent mass spectrometry analysis. We show that the method can determine drastic changes of tissue-specific protein profiles in blood plasma from mouse animal models with sepsis. The strategy can be extended to several other species advancing our understanding of the complex processes that contribute to the plasma proteome dynamics.


Figures

Figure 1
Figure 1. Construction of a tissue-specific protein abundance atlas.
(a) Vascularized organs, plasma and cells adjacent to the blood plasma were collected from healthy Balb-C mice. The collected organs and cells were washed in PBS, homogenized, the proteins digested with trypsin and analysed by shotgun LC-MS/MS. (b) The scaled spectral counts from the LC-MS/MS analysis of the individual organs and cells were correlated using Pearson's r correlation coefficient, indicated by the numbers in the heat map. (c) Heat map of the scaled spectral counts of the different cell and organs. The grey lines in the heat map shows percentage of signal associated with a given organ or cell type. Total number of identified proteins per organ, blood vessel and cells is shown in brackets below the heat map.
Figure 2
Figure 2. Protein function enrichment of the tissue-specific protein abundance atlas.
(a,b) The quantitative protein profiles across the analysed organs and cells were subdivided into nine expression profiles using k-mean clustering and visualized as heat maps (I–IX). The average quantitative distribution of the proteins within one cluster is shown as coloured bar plots on top of the individual heat maps. The colours indicate organ, plasma or cell type. The total intensity of the proteins within the individual cluster was summed and total distribution between clusters are shown in b. (c) Examples of identified proteins with high tissue specificity, coloured according to the legend. The corresponding protein intensity in the other organs and cells are made grey for clarity. Data are based on scaled spectral counts from LC-MS/MS analysis.
Figure 3
Figure 3. Tissue-specific protein in healthy blood plasma.
The distribution of the protein intensity across the analysed organs and cells was determined by scaled spectral counts from LC-MS/MS analysis. (a,b) All the proteins detected in healthy plasma were plotted as individual bar plots in a circular polar histogram. The segments within the bar plots are coloured according to the colour scheme shown in the legend. The proteins were grouped according to similarity as shown by the colour arrangement in the polar histogram. The annotations outside the polar histogram indicate the predicted protein origin and the total number of proteins within one group. The number of identified proteins and the total intensity for the major groups identified in plasma are shown in b.
Figure 4
Figure 4. Quantitative changes of blood plasma proteins during severe Sepsis.
In total, 26 animals were inoculated with S. pyogenes bacteria using different infectious doses (3.75 × 10⁶, 7.5 × 10⁶, 15 × 106 and 30 × 106) or PBS as control. The animals were killed after 48 h and citrated blood was collected using cardiac puncture. The blood plasma proteins were digested with trypsin followed by DIA-MS analysis. (a) Average weight loss of the animals within the dose groups of inoculated mice. (b) The proteins were clustered using t-SNE dimensionality reduction followed by PAM clustering and the abundance profiles for the six groups shown as line graphs in 1–6. The denser part of the graph is shown as increasing lighter coloured lines. The average intensity profile across the groups is shown as a thicker red line. The relative protein abundance for the individual animals are shown using heat maps.
Figure 5
Figure 5. Sepsis results in increasing tissue-specific proteins in the blood plasma.
The previously defined organ-, cell- and plasma-associated proteins identified in blood plasma using DIA was overlaid the t-SNE clusters. (a) Polar histogram illustrating quantitative protein changes of the defined tissue-, cell- and plasma-associated proteins across the five dose groups. The individual proteins are shown as bar plots and protein distribution coloured according to the dose group. The bar plots are shown in a circular polar histogram arranged in the same way as in Fig. 3a. The annotation outside the circle represents most likely organ, plasma and cell origin. The outer circle represents the proteins proposed primary localization defined by Fig. 3a and the clusters defined in Fig. 4b. The inner circle displays changes in protein abundance across the different dose groups. (b,c) Proteins increase or decrease in a dose-dependent fashion. (d) Examples of tissue proteins shown in Fig. 3c. (e) Total intensity of the organ, plasma and cell-specific associated proteins for every t-SNE clusters. Proteins were compared between untreated and the highest bacterial load and was evaluated by Student's t-test. The multiple-testing corrected (Hochberg) P values were calculated on the basis of a two-tailed distribution and unequal variance. *P<0.05, **P<0.01, ***P<0.001.
Figure 6
Figure 6. Abundance differences of known sepsis biomarkers.
Previously tested human sepsis biomarkers were mapped to corresponding mouse orthologues identified in this study. (a) Heat-map indicating protein distribution of identified biomarkers across the analysed organs, cells and plasma based on scaled spectral counts from LC-MS/MS analysis. (b) Quantitative DIA-MS protein profiles of all identified biomarkers in blood plasma from the inoculated animals. Previous reports have grouped the putative biomarkers in annotated functional classes. The total intensity of the quantified proteins associated with specific annotated biomarker classes for the separate dose groups was summed up. (c) Total intensity quantitative changes for the annotated biomarker classes for the dose groups.

References

    1. Farrah T. et al.. A high-confidence human plasma proteome reference set with estimated concentrations in peptide atlas. Mol. Cell. Proteomics 10, M110.006353–M110.006353 (2011). - PMC - PubMed
    1. Guo T. et al.. Rapid mass spectrometric conversion of tissue biopsy samples into permanent quantitative digital proteome maps. Nat. Med. 21, 407–413 (2015). - PMC - PubMed
    1. Röst H. L. et al.. OpenSWATH enables automated, targeted analysis of data- independent acquisition MS data. Nat. Biotechnol. 32, 219–223 (2014). - PubMed
    1. Gillet L. C. et al.. Targeted data extraction of the MS/MS spectra generated by data-independent acquisition: a new concept for consistent and accurate proteome analysis. Mol. Cell. Proteomics 11, O111.016717–O111.016717 (2012). - PMC - PubMed
    1. Reinhart K. et al.. The burden of sepsis—a call to action in support of World Sepsis Day 2013. J. Crit. Care 28, 526–528 (2013). - PubMed

Publication types