. 2016 Apr 15:425:48-60.
doi: 10.1016/j.mce.2015.12.006. Epub 2015 Dec 28.

Increased IGFBP-1 phosphorylation in response to leucine deprivation is mediated by CK2 and PKC

Affiliations

Increased IGFBP-1 phosphorylation in response to leucine deprivation is mediated by CK2 and PKC

Niyati Malkani et al. Mol Cell Endocrinol. .

Abstract

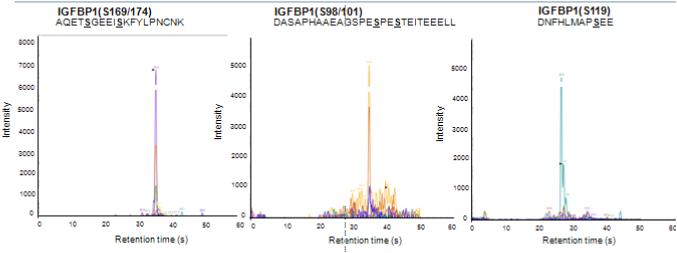
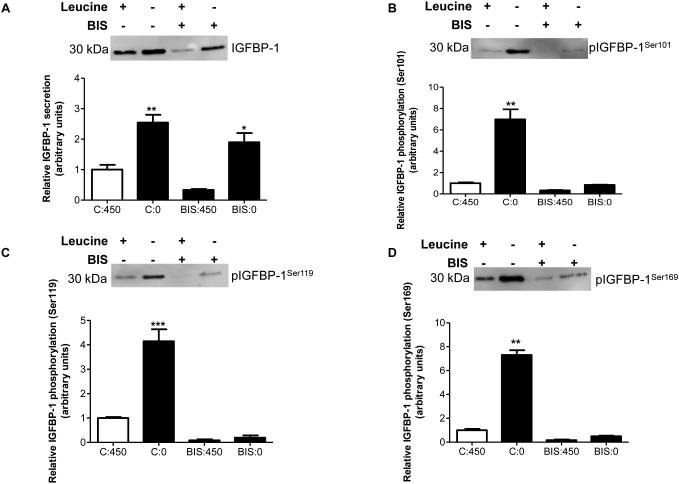
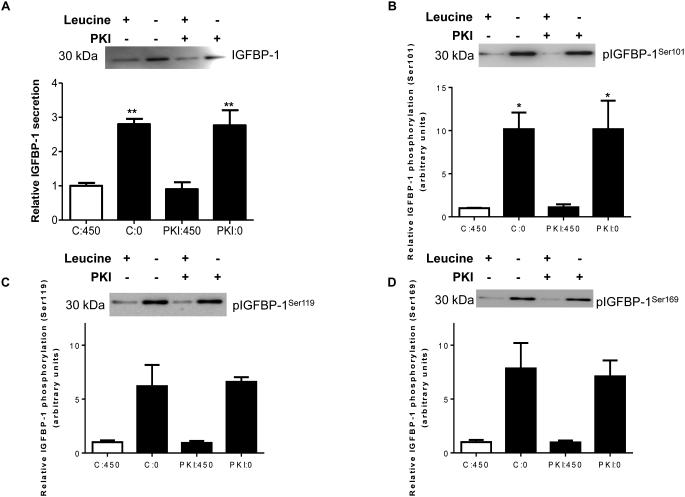
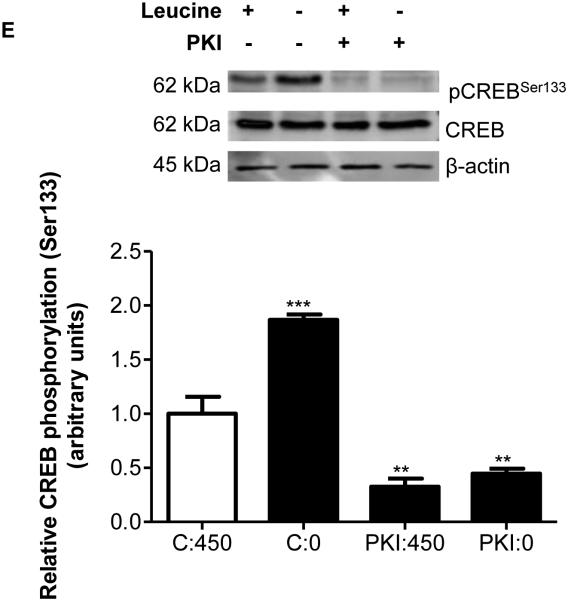
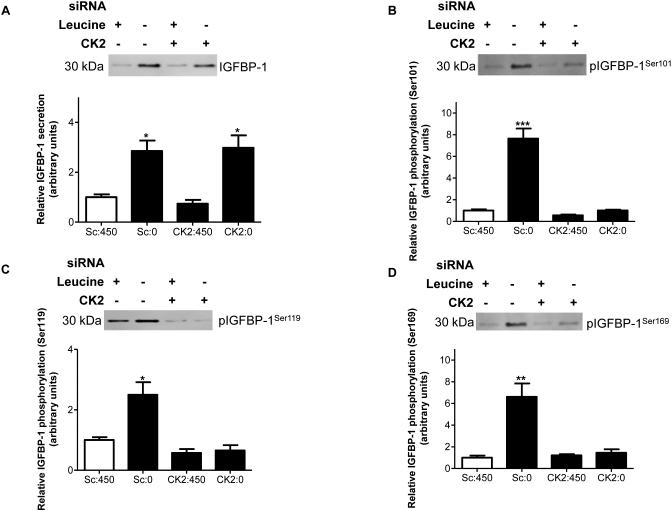
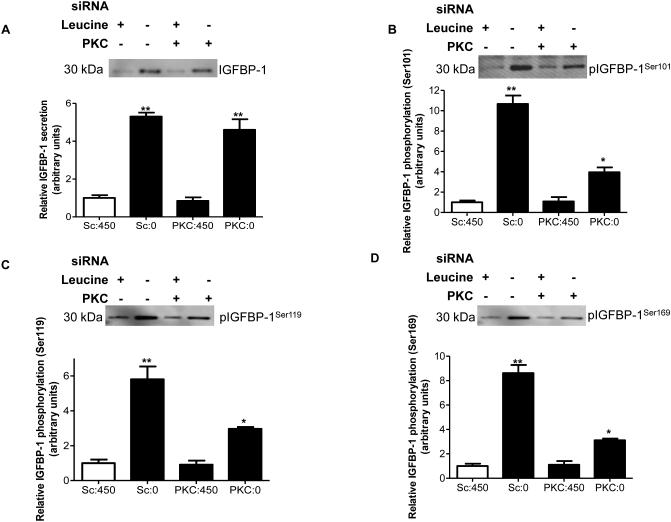
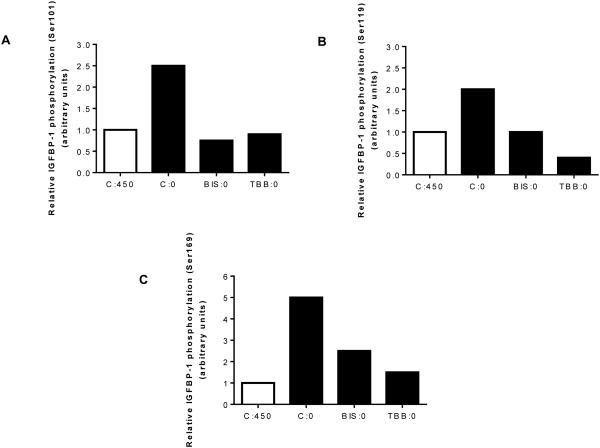
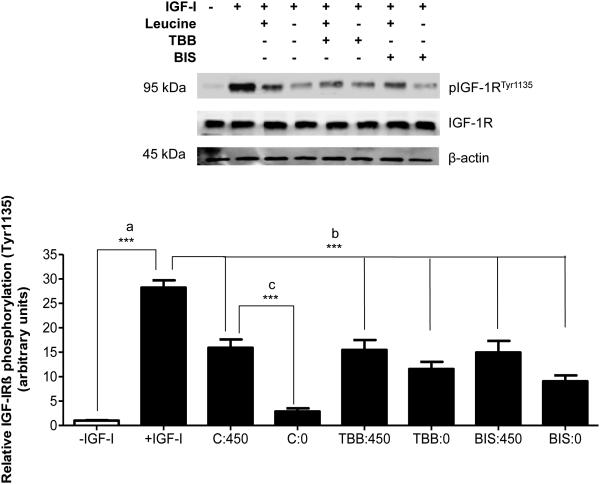
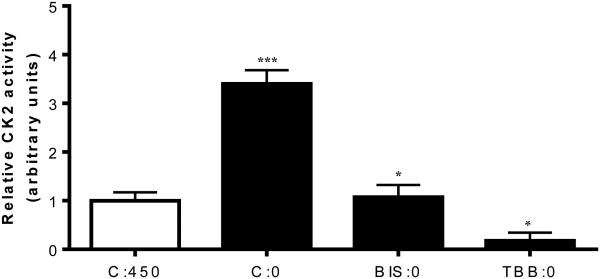
Insulin-like growth factor binding protein-1 (IGFBP-1), secreted by fetal liver, is a key regulator of IGF-I bioavailability and fetal growth. IGFBP-1 phosphorylation decreases IGF-I bioavailability and diminishes its growth-promoting effects. Growth-restricted fetuses have decreased levels of circulating essential amino acids. We recently showed that IGFBP-1 hyperphosphorylation (pSer101/119/169) in response to leucine deprivation is regulated via activation of the amino acid response (AAR) in HepG2 cells. Here we investigated nutrient-sensitive protein kinases CK2/PKC/PKA in mediating IGFBP-1 phosphorylation in leucine deprivation. We demonstrated that leucine deprivation stimulated CK2 activity (enzymatic assay) and induced IGFBP-1 phosphorylation (immunoblotting/MRM-MS). Inhibition (pharmacological/siRNA) of CK2/PKC, but not PKA, prevented IGFBP-1 hyperphosphorylation in leucine deprivation. PKC inhibition also prevented leucine deprivation-stimulated CK2 activity. Functionally, leucine deprivation decreased IGF-I-induced-IGF-1R autophosphorylation when CK2/PKC were not inhibited. Our data strongly support that PKC promotes leucine deprivation-induced IGFBP-1 hyperphosphorylation via CK2 activation, mechanistically linking decreased amino acid availability and reduced fetal growth.

Keywords: Amino acid restriction; Fetal growth; HepG2 cells; Insulin-like growth Factor-1 receptor; Insulin-like growth factor binding protein; Mass spectrometry; Phosphorylation sites; Protein kinases.


Figures

Figure 1
Figure 1. MRM spectra of synthetic IGFBP-1 peptides used for CK2 in vitro kinase assay
MRM/MS analysis of phosphorylation of Ser residues (S) on IGFBP-1 peptides, non-phosphorylated synthetic peptides were used as substrates for CK2 enzyme. Following incubation, CK2-induced phosphorylation of each peptide was then monitored by targeting the phosphorylation-specific version of each IGFBP-1 peptide substrate by MRM-MS using a QTRAP 4000 mass spectrometer. CK2 phosphorylates IGFBP-1 at Ser101, Ser119 and Ser169. Ser101 was found to be doubly phosphorylated with Ser98, and Ser169 was indicated to be doubly phosphorylated with Ser174.
Figure 2
Figure 2. Effect of pharmacological pan-PKC inhibitor Bisindolylmaleimide (BIS) on IGFBP-1 phosphorylation
HepG2 cells were treated with BIS (7.5 μM) and cultured in leucine plus (450 μM) or in leucine deprived (0 μM) media for 24 hours (n=3 each). A representative western immunoblot of HepG2 cell media indicating A. total IGFBP-1 and B. IGFBP-1 phosphorylation at Ser101, Ser119 and Ser169 in leucine plus (450 μM), leucine deprivation, BIS, and leucine deprivation+BIS treatments. Inhibition of PKC in leucine deprivation attenuates IGFBP-1 hyperphosphorylation at Ser101, Ser119 and Ser169. Values are displayed as mean + SEM. *p< 0.05, **p= 0.001-0.05, ***p < 0.0001 versus control; One-way analysis of variance; Dunnet’s Multiple Comparison Test; n=3. C:450 Control, 450 μM leucine. C:0: Leucine deprivation, 0 μM leucine. BIS:450: Bisindolylmaleimide (7.5 μM), 450 μM leucine. BIS:0: Bisindolylmaleimide (7.5 μM), 0 μM leucine.
Figure 3
Figure 3. Effects of PKI (5-24) inhibition of PKA on leucine deprivation-induced IGFBP-1 phosphorylation
HepG2 cells were incubated with PKI (5-24) (100 nM) in leucine plus (450 μM) or leucine deprived (0 μM) media for 24 hours (n=3 each). A representative western immunoblot of HepG2 cell media indicating A. total IGFBP-1 and B. IGFBP-1 phosphorylation at Ser101, Ser119 and Ser169 in control, leucine deprivation, PKI, and leucine deprivation+PKI treatments. PKA inhibition did not affect leucine deprivation-induced IGFBP-1 phosphorylation. Values are displayed as mean + SEM. *p< 0.05, **p= 0.001-0.05, ***p < 0.0001 versus control; One-way analysis of variance; Dunnet’s Multiple Comparison Test; n=3. C:450: Control, 450 μM leucine. C:0: Leucine deprivation, 0 μM leucine. PKI:450: PKI (5-24) (100 nM), 450 μM leucine. PKI:0:
Figure 4
Figure 4. The effect of siRNA silencing targeting CK2 holoenzyme (CK2α+α’+β) on leucine deprivation-induced IGFBP-1 phosphorylation
HepG2 cells were treated with scrambled or CK2α+α’+β siRNA for 24 hours and incubated in leucine plus (450 μM) or leucine deprived (0 μM) media for 72 hours (n=3 each). Representative immunoblots of conditioned HepG2 cell media (50 μL per well) treated with scrambled, or CK2α+α’+β siRNA in media that was leucine plus or leucine deprived assessed for A. total IGFBP-1 and B. IGFBP-1 phosphorylation at Ser101, Ser119 and Ser169. Knockdown of the CK2 holoenzyme prevents IGFBP-1 hyperphosphorylation in leucine deprivation. Values are displayed as mean + SEM. *p< 0.05, **p= 0.001-0.05, ***p < 0.0001 versus control; One-way analysis of variance; Dunnet’s Multiple Comparison Test; n=3. Sc: Scrambled, 450 μM leucine. Sc:0: Scrambled, 0 μM leucine. CK2:450: CK2α+α’+β siRNA, 450 μM leucine. CK2:0: CK2α+α’+β siRNA, 0 μM leucine.
Figure 5
Figure 5. The effect of pan-PKC siRNA on IGFBP-1 phosphorylation in leucine deprivation
HepG2 cells were treated with scrambled or pan-PKC siRNA for 24 hours and cultured in leucine plus (450 μM) or leucine deprived (0 μM) media for an additional 72 hours (n=3 each). A. A representative western immunoblot of total IGFBP-1 in equal amounts (50 μL) of cell media treated with scrambled or ERK siRNA with and without leucine deprivation. B-D. Representative western immunoblots of HepG2 cell media (50 μL) treated with scrambled or pan-PKC siRNA in leucine plus or leucine deprived conditions and assayed for IGFBP-1 phosphorylation at Ser101, Ser119 and Ser169. PKC knockdown attenuates IGFBP-1 hyperphosphorylation in response to leucine deprivation. Values are displayed as mean + SEM. *p< 0.05, **p= 0.001-0.05, ***p < 0.0001 versus control; One-way analysis of variance; Dunnet’s Multiple Comparison Test; n=3. Sc: Scrambled, 450 μM leucine. Sc:0: Leucine deprivation, 0 μM leucine. PKC:450: PKC siRNA, 450 μM leucine. PKC:0: PKC siRNA, 0 μM leucine.
Figure 6
Figure 6. MRM/MS analysis for assessment of IGFBP-1 phosphorylation
Mass spectrometry analysis of the relative IGFBP-1 phosphorylation induced by leucine deprivation in the presence or absence of TBB or BIS. TBB or BIS attenuate IGFBP-1 phosphorylation at A. Ser101, B. Ser119 and C. Ser169 in the presence of either inhibitor (TBB samples (set to a value of 1) and normalized to a non-phosphorylated peptide within the IGFBP1 protein. C:450 Control, 450 μM leucine. C:0: Leucine deprivation, 0 μM leucine. BIS:0: Bisindolylmaleimide (7.5 μM), 0 μM leucine. TBB:0: TBB (1 μM), 0 μM leucine.
Figure 7
Figure 7. The effects of CK2 and PKC inhibition on IGF-1R autophosphorylation
HepG2 cells were treated in leucine plus (450 μM) or leucine deprived (0 μM) media with BIS or with TBB, a pharmacological CK2 inhibitor, for 24 hours (n=3). HepG2 cell media samples were aliquoted to contain equal concentrations of IGFBP-1 and buffer-exchanged to serum-free P6 media (DMEM/F12 with pyruvate). Aliquots were then incubated with human recombinant IGFI (25 ng/mL) for 2 hours to allow IGFBP-1 binding to IGF-I, followed by a 10 minute exposure to P6 cells to allow induction of IGF-I-mediated IGF-1Rβ autophosphorylation (Tyr1135). A representative western immunoblot of post-treatment P6 cell lysates (50 μg per lane) assessed for IGF-IR autophosphorylation (Tyr1135). Leucine deprivation-stimulated IGFBP-1 phosphorylation reduced IGF-1R activation; leucine deprivation was unable to elicit this effect in the presence of BIS or TBB. Values are displayed as mean + SEM. *p< 0.05, **p= 0.001-0.05, ***p < 0.0001 versus control; One-way analysis of variance; Dunnet’s Multiple Comparison Test; n=3. – IGF-I: Negative control, no IGF-I, no IGFBP-1. +IGF-I: Positive control, 25 ng/mL IGF-I, no IGFBP-1. C:450: Control, 450 μM leucine. C:0: Leucine deprivation, 0 μM leucine. TBB:450: TBB (1 μM), 450 μM leucine. TBB:0: TBB (1 μM), 0 μM leucine. BIS:450: Bisindolylmaleimide (7.5 μM), 450 μM leucine. BIS:0: Bisindolylmaleimide (7.5 μM), 0 μM leucine.
Figure 8
Figure 8. Effects of various inhibitor treatments on CK2 activity
A. CK2 activity assay demonstrates that leucine deprivation induces CK2 activity, an effect that is attenuated by BIS. Expectedly, TBB decreases CK2 activity in leucine deprivation. Values are displayed as mean + SEM. *p< 0.05, **p= 0.001-0.05, ***p < 0.0001 versus control; One-way analysis of variance; Dunnet’s Multiple Comparison Test; n=3. C:450: Control, 450 μM leucine. C:0: Leucine deprivation, 0 μM leucine. BIS:0: Bisindolylmaleimide (7.5 μM), 0 μM leucine. TBB:0: TBB (1 μM), 0 μM leucine.

Similar articles

Cited by

References

    1. Abu Shehab M, Damerill I, Shen T, Rosario FJ, Nijland M, Nathanielsz PW, Kamat A, Jansson T, Gupta MB. Liver mTOR controls IGF-I bioavailability by regulation of protein kinase CK2 and IGFBP-1 phosphorylation in fetal growth restriction. Endocrinology. 2014;155:1327–1339. - PMC - PubMed
    1. Abu Shehab M, Iosef C, Wildgruber R, Sardana G, Gupta MB. Phosphorylation of IGFBP-1 at discrete sites elicits variable effects on IGF-I receptor autophosphorylation. Endocrinology. 2013;154:1130–1143. - PubMed
    1. Abu Shehab M, Khosravi J, Han VK, Shilton BH, Gupta MB. Site-specific IGFBP-1 hyper-phosphorylation in fetal growth restriction: clinical and functional relevance. J. Proteome Res. 2010;9:1873–1881. - PubMed
    1. Ankrapp DP, Jones JI, Clemmons DR. Characterization of insulin-like growth factor binding protein-1 kinases from human hepatoma cells. J. Cell. Biochem. 1996;60:387–399. - PubMed
    1. Baker J, Liu JP, Robertson EJ, Efstratiadis A. Role of insulin-like growth factors in embryonic and postnatal growth. Cell. 1993;75:73–82. - PubMed

Publication types

MeSH terms