. 2016 Jan 19;113(3):746-50.
doi: 10.1073/pnas.1524272113. Epub 2016 Jan 5.

Sympathetic innervation controls homeostasis of neuromuscular junctions in health and disease

Affiliations

Sympathetic innervation controls homeostasis of neuromuscular junctions in health and disease

Muzamil Majid Khan et al. Proc Natl Acad Sci U S A. .

Erratum in

Abstract

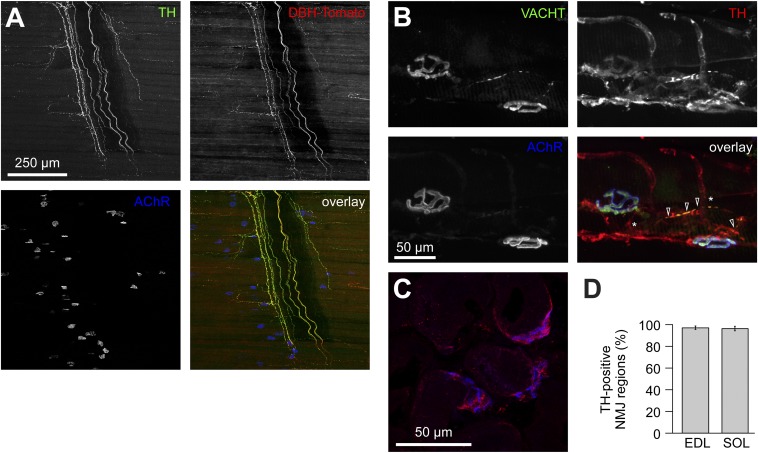
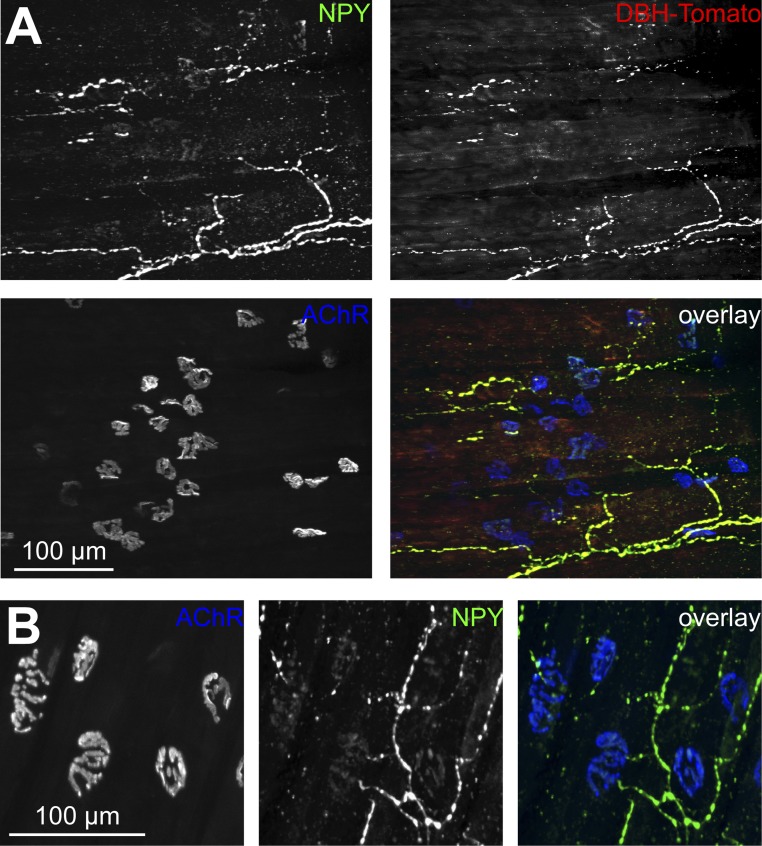
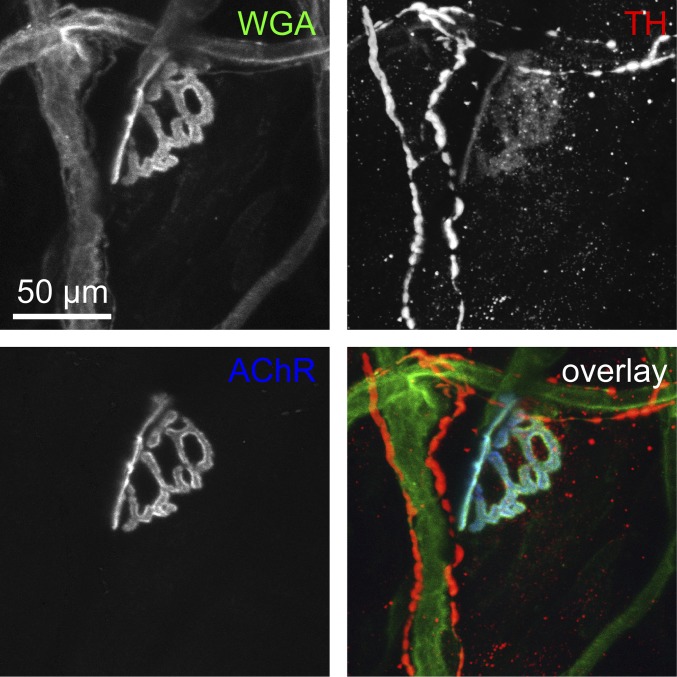
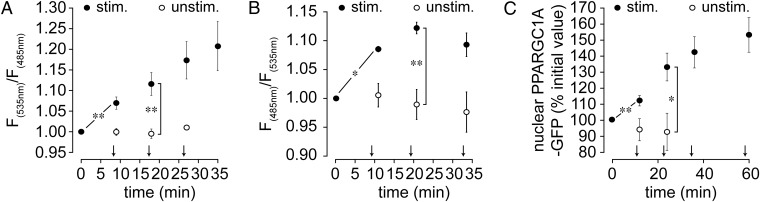
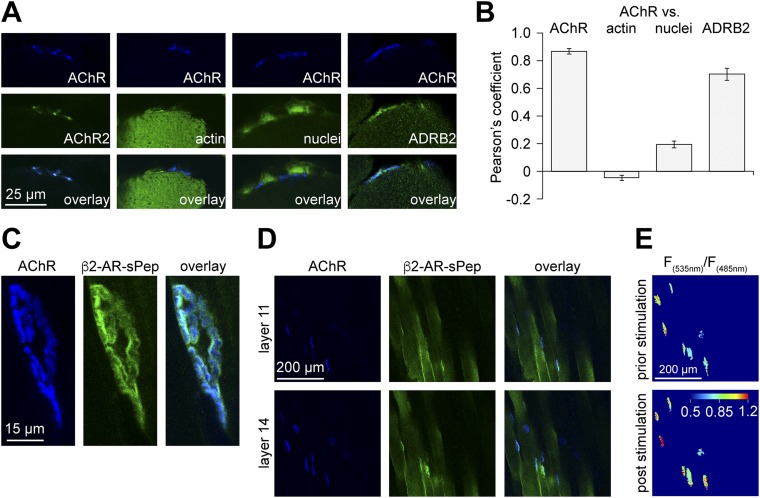
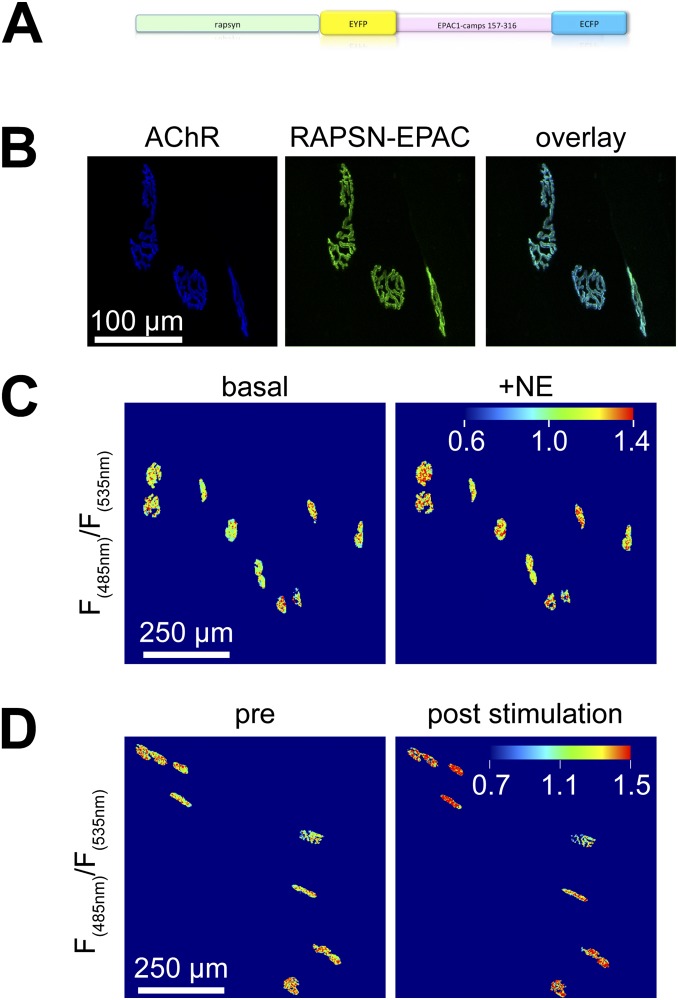
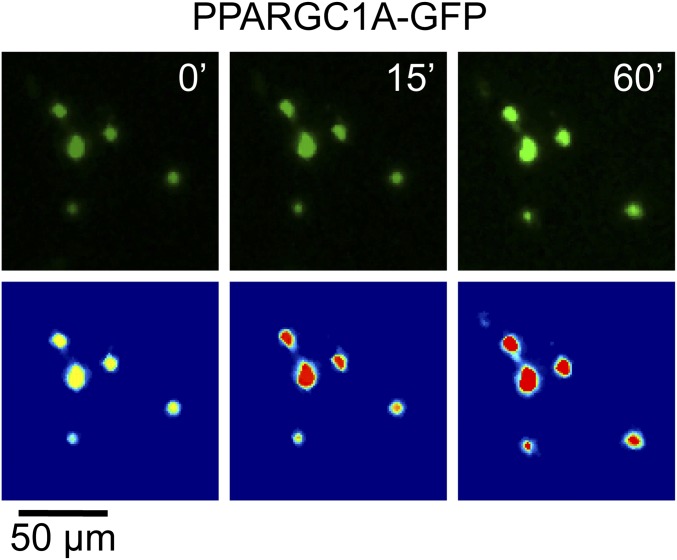
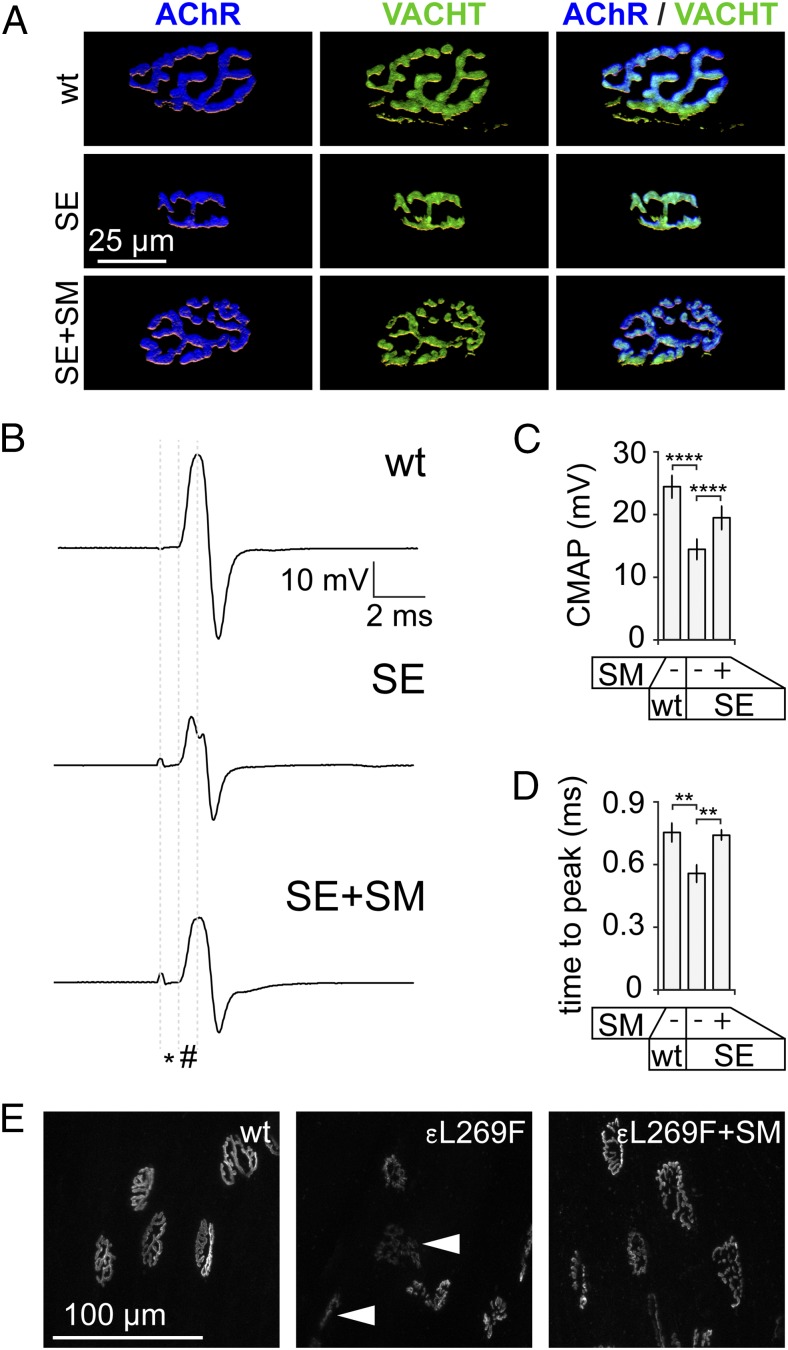
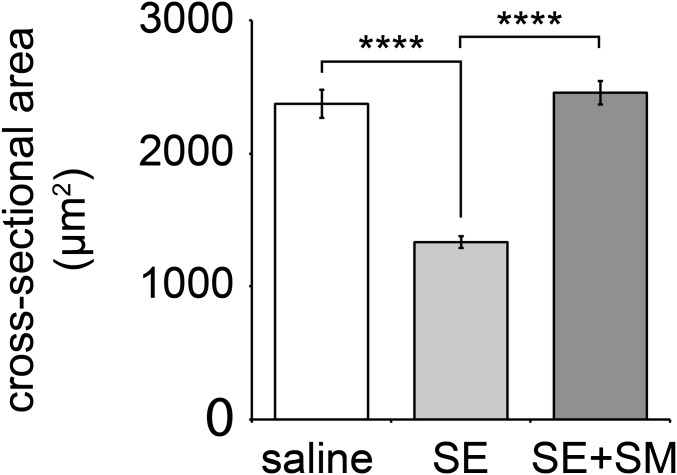
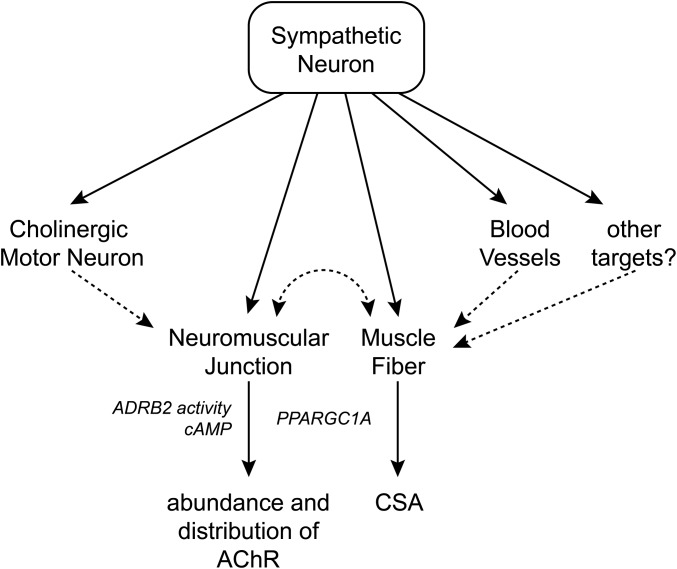
The distribution and function of sympathetic innervation in skeletal muscle have largely remained elusive. Here we demonstrate that sympathetic neurons make close contact with neuromuscular junctions and form a network in skeletal muscle that may functionally couple different targets including blood vessels, motor neurons, and muscle fibers. Direct stimulation of sympathetic neurons led to activation of muscle postsynaptic β2-adrenoreceptor (ADRB2), cAMP production, and import of the transcriptional coactivator peroxisome proliferator-activated receptor γ-coactivator 1α (PPARGC1A) into myonuclei. Electrophysiological and morphological deficits of neuromuscular junctions upon sympathectomy and in myasthenic mice were rescued by sympathicomimetic treatment. In conclusion, this study identifies the neuromuscular junction as a target of the sympathetic nervous system and shows that sympathetic input is crucial for synapse maintenance and function.

Keywords: beta-agonists; cAMP; myasthenia; neuromuscular junction; sympathetic neurons.


Conflict of interest statement

The authors declare no conflict of interest.

Figures

Fig. 1.
Fig. 1.
Distribution of sympathetic neurons in skeletal muscle. (A) Diaphragm muscle of a DBH-Tomato mouse expressing Tomato protein in sympathetic neurons was costained with anti-TH antibody and BGT-AF647 (AChR). Signals from TH, Tomato, and BGT are depicted in the overlay in green, red, and blue, respectively. Three-dimensional maximum projection of a confocal z stack of a representative region is shown. All channels were brightness/contrast-enhanced. (B) Longitudinal sections of wild-type EDL muscles were labeled against VACHT, TH, and BGT-AF647. Signals from these markers are depicted in the overlay in green, red, and blue, respectively. Three-dimensional maximum projection of a confocal z stack of a representative region is shown. All channels were brightness/contrast-enhanced. (C and D) EDL and soleus muscles were sectioned transversally, stained with BGT-AF555 (blue in overlay) and anti-TH antibody (red in overlay), and then imaged with confocal microscopy. (C) Representative confocal brightness/contrast-enhanced optical section from EDL. (D) Quantification of TH-positive NMJ regions from EDL and soleus (SOL) muscles. Mean ± SEM (n = 4 muscles each). Negative controls lacking primary antibodies showed 0.7 ± 0.7% (mean ± SEM, n = 4 muscles) in EDL and 0.0% (mean ± SEM, n = 4 muscles) in soleus of TH-positive NMJ regions.
Fig. S1.
Fig. S1.
Sympathetic neurons innervate neuromuscular junctions. Diaphragm muscles were stained with anti-neuropeptide Y (NPY) antibody and BGT-AF647. For IF of diaphragms and longitudinal TA and EDL muscle sections as shown in Figs. 1 A and B and 3A and Figs. S1 A and B and S2, a modified iDISCO tissue clearing and staining protocol was used (42): Muscles were washed in 1× PBS (three times in 1 h) and preincubated with 0.2% Triton X-100/20% (vol/vol) DMSO/0.3 M glycine in 1× PBS overnight at 37 °C. Samples were then incubated in 0.2% Tween in 1× PBS with 10 µg/mL heparin (PTwH) for 2 d at room temperature and then blocked with 0.2% Triton X-100/10% (vol/vol) DMSO/6% (vol/vol) BSA in 1× PBS (2× PTDB solution) at 37 °C for 24 h. Samples were washed with PTwH three times in 1 h, followed by incubation with primary and secondary antibodies in 1× PTDB solution (diluted with PTwH) for 4 d each. Between primary and secondary antibody staining, muscles were washed with PTwH solution for 2 d and again 2 d before imaging. Antibodies used throughout the study were rabbit anti-TH (AB152, 1:50; Millipore), rabbit anti-ADRB2 (sc-569, 1:200; Santa Cruz Biotechnology), rabbit anti-NPY (11976, 1:200; New England Biolabs), rabbit anti-VACHT (139103, 1:50; Synaptic Systems), Alexa Fluor (AF)488-conjugated wheat germ agglutinin (W11261, 1:200; Invitrogen), BGT-AF555 and BGT-AF647 (1:200; Invitrogen), Alexa Fluor 546-conjugated anti-rabbit (A11010, 1:1,000; Invitrogen), and Alexa Fluor 488-conjugated anti-mouse (A11001, 1:200; Invitrogen). Confocal microscopy used the following parameters: AF488 (excitation 488 nm), AF546 and Tomato (excitation 561 nm), and AF647 (excitation 633 nm) signals were acquired using 500- to 550-nm, 570- to 620-nm, and 650- to 750-nm band-pass settings, respectively, in the SP2 unit. 3D image stacks were taken at 8-bit and 1,024 × 1,024-pixel resolution with maximally 2× zoom. (A) Signals from a reporter mouse expressing Tomato protein in sympathetic neurons (DBH-Tomato). NPY, Tomato, and BGT are depicted in the overlay in green, red, and blue, respectively. Three-dimensional maximum projection of a confocal z stack taken in a representative region is shown. All channels were brightness/contrast-enhanced. (B) Three-dimensional maximum projection of a confocal z stack taken in a representative region is shown from a wild-type mouse diaphragm. NPY and BGT are depicted in the overlay in green and blue, respectively. All channels were brightness/contrast-enhanced. NPY labeling brightness in the end plates was quantified and found to be 20.40 ± 2.54 arbitrary units (AU) (mean ± SEM, n = 8) compared with 118.62 ± 9.74 AU (mean ± SEM, n = 8) in the nerve. This would suggest that the major site of NPY production is in the axonal region.
Fig. S2.
Fig. S2.
Sympathetic neurons contact different targets, including blood vessels and NMJs. Wild-type EDL muscles were sectioned using a Leica VT1000S vibratome into 100-µm-thick sections and then stained with fluorescent wheat germ agglutinin coupled to Alexa Fluor 488 (WGA), anti-TH antibody (TH), and BGT-AF647 (AChR). Signals of WGA, TH, and BGT are depicted in the overlay in green, red, and blue, respectively. Three-dimensional maximum projection of a confocal z stack taken in a representative region is shown. All channels were brightness/contrast-enhanced.
Fig. 2.
Fig. 2.
Stimulation of the lumbar sympathetic ganglion stimulates muscle adrenergic signal transduction and nuclear import of PPARGC1A. TA muscles were transfected with β2-AR-s-pep (A), RAPSN-EPAC (B), or PPARGC1A-GFP (C). Ten days later, muscles were injected with BGT-AF647 to label NMJs and imaged with in vivo confocal and two-photon microscopy. (A and B) Quantification of FRET measurements. Graphs depict F535 nm/F485 nm (A) or F485 nm/F535 nm (B) emission ratios in all observed biosensor-positive NMJ regions. Ratios were normalized to basal value before stimulation. Arrows indicate time points of lumbar stimulation. Mean ± SEM (n values with stimulation: 5 in A, 3 in B; n values without stimulation: 4 in A, 4 in B; *P < 0.05, **P < 0.01). (C) Quantification of nuclear accumulation of PPARGC1A-GFP upon sympathetic stimulation. Arrows indicate time points of lumbar stimulation. Mean ± SEM (n = 5; *P < 0.05, **P < 0.01).
Fig. S3.
Fig. S3.
Functional effects of sympathetic stimulation and molecular biosensors. (A) Transverse sections (10-µm-thick) of untransfected EDL muscles were costained using BGT-AF555 (AChR) and either BGT-AF647 (AChR2), phalloidin-TRITC (actin), draq5 (nuclei), or anti-ADRB2 antibody (ADRB2) and then imaged with confocal fluorescence microscopy. Staining of transverse cryosections was as follows. Sections (10-μm-thick) were prepared from snap-frozen EDL muscles, washed with 1× PBS, permeabilized with 0.1% Triton X-100/PBS, blocked with 2% BSA/PBS (2 h), and subsequently stained with antibodies or stains (each for 24 h with extensive washing in-between). Sections were embedded in Mowiol. For quantitative analysis of cross-sections as shown in Fig. 1 C and D, NMJ regions were identified by thresholding on median-filtered BGT fluorescence images. Segments were saved as regions of interest. Mean gray values were measured from corresponding regions in TH IF images (FTH-NMJ). In addition, mean gray values (FTH-fiber) and SD (SDfiber) were measured from the TH IF background fluorescence in fiber cross-sections. NMJ regions were considered TH-positive if the following criterion was met: FTH-NMJ > FTH-fiber + 10 + (2 × SDfiber). (B) Quantitative colocalization analysis for different stainings as indicated. Pearson’s coefficients were derived from NMJ regions using the ImageJ plugin JACoP (NIH). N values for AChR, actin, nuclei, and ADRB2 colocalization were 11, 15, 15, and 13, respectively. (CE) TA muscles were transfected as described (24, 43, 44) with cDNA encoding for β2-AR-s-pep, a FRET-based ADRB2 activity biosensor (19) (plasmid 47438; Addgene). This sensor consists of full-length ADRB2 with the following C-terminal attachment (in sequence): yellow fluorescent protein mCitrine (FRET acceptor), a linker sequence, cyan fluorescent protein mCerulean (FRET donor), and the G protein-coupled receptor-binding peptide of Gαs, termed s-pep. In β2-AR-s-pep, ligand-induced activation of the ADRB2 portion leads to binding of s-pep to the cytosolic loop of ADRB2. This triggers approximation of mCitrine and mCerulean proteins leading to FRET. Ten days after transfection, a microelectrode was placed at the sympathetic ganglion innervating the hindlimbs. The lumbar sympathetic chain is surrounded by connective tissue ventral to the vertebral column and dorsal to the abdominal aorta and vena cava. Sympathetic ganglia L2 and L3 that innervate hindlimbs are roughly at the height of the renal artery and vein. For stimulation, the chain was exposed under deep anesthesia via a midline laparotomy approach. Animals were kept on a heating pad and received s.c. doses of physiological solution against dehydration. Connective tissue was carefully removed. Stimulation used a microelectrode from Harvard Apparatus that was placed around the chain. An A.M.P.I. Master-8-cp stimulator delivered trains of 10 pulses, 0.5-ms duration, 10-Hz frequency. Ten trains were applied at 4-s intervals. Stimulation occurred at around 2 V. NMJs were marked by injection of 50 μL BGT-AF647 (1:200 in PBS; Invitrogen) into the hindlimb, and muscles were then imaged with in vivo confocal and two-photon microscopy. (C and D) Pictures show high-power 3D projection (C) and low-power single optical layers (D) of confocal fluorescence micrograph stacks revealing enrichment of β2-AR-s-pep (green) at the NMJ (blue). (E) Images show pseudocolored FRET acceptor-to-donor (F535 nm/F485 nm) emission ratios in NMJs upon two-photon microscopy. NMJ regions were segmented, because outside these zones fluorescence intensities were low, leading to arbitrary ratio values obscuring the FRET changes at the level of NMJs. β2-AR-s-pep detects increased ADRB2 activity upon sympathetic ganglion stimulation by increased FRET. 3D image stacks were taken at 12-bit, 200-Hz scan frequency, 2× line average, and 512 × 512-pixel resolution with 1× zoom. For FRET measurements, fluorescence donor mCerulean was excited in two-photon mode at 810 nm. Emission signals from donor (F485 nm) and acceptor (F535 nm) were simultaneously detected by nondescanned detectors using an RSP 505 dichroic mirror and BP485/30 and BP560/50 emission filters (Leica). Photomultiplier settings were kept constant; laser intensity was adjusted according to sample depth. Quantitative analysis of FRET changes used ImageJ 1.49v and the following procedure. Postsynaptic areas enriched in β2-AR-s-pep were segmented in median filtered mCerulean emission image stacks. Masks were made from segmented areas and applied to background-subtracted and mean filtered mCerulean and mCitrine image stacks. Ratio images (mCitrine/mCerulean) were made and average ratios were determined for each postsynaptic area on at least 5 and up to 10 optical slices. All values obtained from one muscle per time point were averaged. Fig. 2A shows mean values of several experiments.
Fig. S4.
Fig. S4.
Effect of sympathetic stimulation on subsynaptic cAMP levels. (A) RAPSN-EPAC cAMP sensor was cloned into pcDNA3 using PCR; the complete sequence is available upon request. The EPAC1-camps moiety was as described (45) and consists of the cAMP-binding domains of EPAC protein flanked by EYFP (FRET acceptor) and ECFP (FRET donor). The image shows a schematic of RAPSN-EPAC molecular structure. Upon binding of cAMP to the EPAC1-camps domain, the sensor moiety changes from a closed to an open conformation, mediating a reduction of FRET efficiency (45). The N-terminal addition of RAPSN targets the biosensor to the NMJ. (B) Distribution pattern of RAPSN-EPAC upon transfection as revealed by confocal microscopy. TA muscles were transfected as described (24, 43, 44) with cDNA encoding for RAPSN-EPAC. Ten days later, NMJs were labeled by injection of 50 μL BGT-AF647 (1:200 in PBS; Invitrogen), and muscles were imaged with in vivo confocal microscopy. Note that RAPSN-EPAC efficiently targets NMJs. For the analysis of biosensor distribution or NMJ morphology, EYFP (excitation 488 nm) and BGT-AF647 signals (excitation 633 nm) were acquired using 500- to 550-nm and 650- to 750-nm band-pass settings, respectively, in the Leica SP2 confocal microscope unit. (C and D) TA muscles were transfected with cDNA encoding for RAPSN-EPAC. Ten days later, muscles were imaged with in vivo two-photon microscopy. 3D image stacks were taken at 12-bit, 200-Hz scan frequency, 2× line average, and 512 × 512-pixel resolution with 1× zoom. For FRET measurements, fluorescence donor ECFP was excited in two-photon mode at 810 nm. Emission signals from donor (F485 nm) and acceptor (F535 nm) were simultaneously measured by nondescanned detectors using an RSP 505 dichroic mirror and BP485/30 and BP560/50 emission filters (Leica). Photomultiplier settings were maintained; laser intensity was adjusted according to sample depth. Quantitative analysis of biosensor responses used ImageJ 1.49v and the following procedure. Postsynaptic areas enriched in RAPSN-EPAC were segmented in median filtered ECFP emission image stacks. Masks were made from segmented areas and applied to background-subtracted and mean filtered ECFP and EYFP image stacks. Ratio images (ECFP/EYFP) were made, and average ratios were determined for each postsynaptic area on at least 5 and up to 10 optical slices. (C) RAPSN-EPAC sensor responds to application of norepinephrine (NE) by FRET change. Images show pseudocolored maximum z projections of F(485 nm)/F(535 nm) ratio values before (basal) and after intramuscular injection of 50 µL 10 µM NE (+NE). Note that RAPSN-EPAC detects increased cAMP by decreased FRET, and therefore ratiometric calculations are inverted compared with β2-AR-s-pep. Blue-green and yellow-red cues indicate low and high values of cAMP, respectively. The pseudocolor scale bar shows the color distribution-to-fluorescence ratios. Each colored plaque-like structure represents a single NMJ, which were segmented to eliminate the background signals outside NMJs. Note that most NMJs exhibit a clear red shift upon treatment with NE. (D) RAPSN-EPAC sensor indicates a rise in subsynaptic cAMP levels by FRET change. Before in vivo two-photon microscopy, a microelectrode was placed at the sympathetic ganglion innervating the hindlimbs (for technical details, see also Fig. S3 CE). Images show 3D maximum z projections of RAPSN-EPAC pseudocolored FRET donor-to-acceptor (F485 nm/F535 nm) emission ratios in NMJs. Each colored plaque-like structure represents a single NMJ, which were segmented to eliminate the background signals outside NMJs. Fig. 2B shows mean values of several experiments, where all values obtained from one muscle per time point were averaged.
Fig. S5.
Fig. S5.
Effect of sympathetic stimulation on translocation of PPARGC1A. TA muscles were transfected with cDNA encoding for PPARGC1A-GFP (46) (plasmid 4; Addgene). Ten days later, muscles were imaged with in vivo confocal microscopy. Then, maximum z projections were made. GFP-positive nuclei were segmented in the first image stack (before stimulation). These segments were shifted in the following image stacks to fit the regions of corresponding nuclei. From each segment, mean gray values were measured. The images show representative confocal images before (Upper) and after segmentation (Lower) illustrating the increase of PPARGC1A-GFP fluorescence in myonuclei with sympathetic stimulation (for technical details, see also Fig. S3 CE). Numbers in the upper panels indicate time elapsed after start of experiment. (Lower) Brightness values were transformed into clipped pseudocolors [ranging from 500 (blue) to 5,000 (red) arbitrary brightness units] to highlight the increase in fluorescence intensity.
Fig. 3.
Fig. 3.
SM treatment rescues NMJ phenotypes of sympathectomized muscle. (AD) TA muscles of wild-type mice received injections of saline (wt) or 6-hydroxydopamine (SE) on alternate days for 2 wk. In the last 10 d, one SE group was also treated with s.c. daily doses of the SM clenbuterol (SE+SM). Then, muscles were harvested for IF (A) or CMAP recordings were made (BD). (A) Muscles were taken and longitudinal sections were made and stained with BGT-AF555 and anti-VACHT antibody. Confocal microscopy was performed, signals were segmented, and 3D projections were calculated. Images show projections of representative NMJs. (BD) In vivo CMAPs were recorded from TA muscles. Maximal stimuli of 0.25-ms duration were applied by a shielded microelectrode to the sciatic nerve. CMAP recordings used intramuscular needle electrodes. (B) Curves depict representative CMAPs from muscles treated as indicated. Latency (*), time to peak (#), and amplitude of CMAPs were determined. (C) Quantitative analysis revealed a significant reduction of CMAP amplitudes upon SE and partial rescue by SM. Mean ± SEM (n = 8, 5, and 5 for wt, SE, and SE+SM, respectively; ****P < 0.0001). (D) Quantitative analysis revealed a significant reduction of time to peak upon SE and full rescue by SM. Mean ± SEM (n = 6, 5, and 5 for wt, SE, and SE+SM, respectively; **P < 0.01). (E) TA muscles of wild-type and myasthenic slow-channel CHRNE L269F mice (εL269F) received s.c. daily doses of saline or the SM clenbuterol for 10 d. At the start of s.c. treatments, NMJs were labeled with BGT-AF647. At the end of the treatment period, NMJs were imaged with in vivo confocal microscopy. Maximum z projections showing representative NMJs under the conditions indicated in the images: wt, wild type treated with saline; εL269F, εL269F treated with saline; εL269F+SM, εL269F treated with clenbuterol.
Fig. S6.
Fig. S6.
Sympathectomy reduces fiber cross-sectional area, and SM treatment recovers it. TA muscles were treated with either saline or 6-hydroxydopamine (SE) for 2 wk on alternate days. In addition, one group of SE-treated mice received clenbuterol during the last 10 d (SE+SM). Cross-sectional areas (CSA) were determined as previously described (24). Mean CSA ± SEM (n = 6, 12, and 11 muscles for saline, SE, and SE+SM, respectively; ****P < 0.0001).
Fig. S7.
Fig. S7.
Model of the sympathetic innervation network in skeletal muscle and its role in NMJs. Sympathetic neurons coinnervate several targets in muscle, including blood vessels, motor neurons, muscle fibers, NMJs, and potentially other cell types. This innervation modulates muscle ADRB2 activity, postsynaptic cAMP levels, and the import of PPARGC1A into myonuclei, and controls muscle CSA as well as the abundance and distribution of AChRs in NMJs. It is an open question as to whether all observed effects on muscle and NMJs are due to direct sympathetic innervation (solid arrows) or indirect signaling (dashed arrows), for example, from sympathetic neurons over blood vessels to skeletal muscle fibers. Furthermore, it remains to be clarified whether the effects on NMJs and muscle trophicity are linked or independent. Because SM works efficiently in several forms of CMS, sympathetic innervation might have pleiotropic functions for the synapse.

Similar articles

Cited by

References

    1. Barker D, Saito M. Autonomic innervation of receptors and muscle fibres in cat skeletal muscle. Proc R Soc Lond B Biol Sci. 1981;212(1188):317–332. - PubMed
    1. Silveira WA, et al. Activating cAMP/PKA signaling in skeletal muscle suppresses the ubiquitin-proteasome-dependent proteolysis: Implications for sympathetic regulation. J Appl Physiol. 2014;117(1):11–19. - PubMed
    1. Rodríguez Cruz PM, Palace J, Beeson D. Congenital myasthenic syndromes and the neuromuscular junction. Curr Opin Neurol. 2014;27(5):566–575. - PubMed
    1. Engel AG, Shen X-M, Selcen D, Sine SM. Congenital myasthenic syndromes: Pathogenesis, diagnosis, and treatment. Lancet Neurol. 2015;14(4):420–434. - PMC - PubMed
    1. Okamoto LE, Raj SR, Biaggioni I. Chronic fatigue syndrome and the autonomic nervous system. In: Robertson D, Biaggioni I, Burnstock G, Low PA, Paton JFR, editors. Primer on the Autonomic Nervous System. 3rd Ed. Academic; Amsterdam: 2012. pp. 531–534.

Publication types

MeSH terms

Substances