. 2016 Jan;35(1):54-61.
doi: 10.1377/hlthaff.2015.0830.

For Working-Age Cancer Survivors, Medical Debt And Bankruptcy Create Financial Hardships

Affiliations

For Working-Age Cancer Survivors, Medical Debt And Bankruptcy Create Financial Hardships

Matthew P Banegas et al. Health Aff (Millwood). 2016 Jan.

Abstract

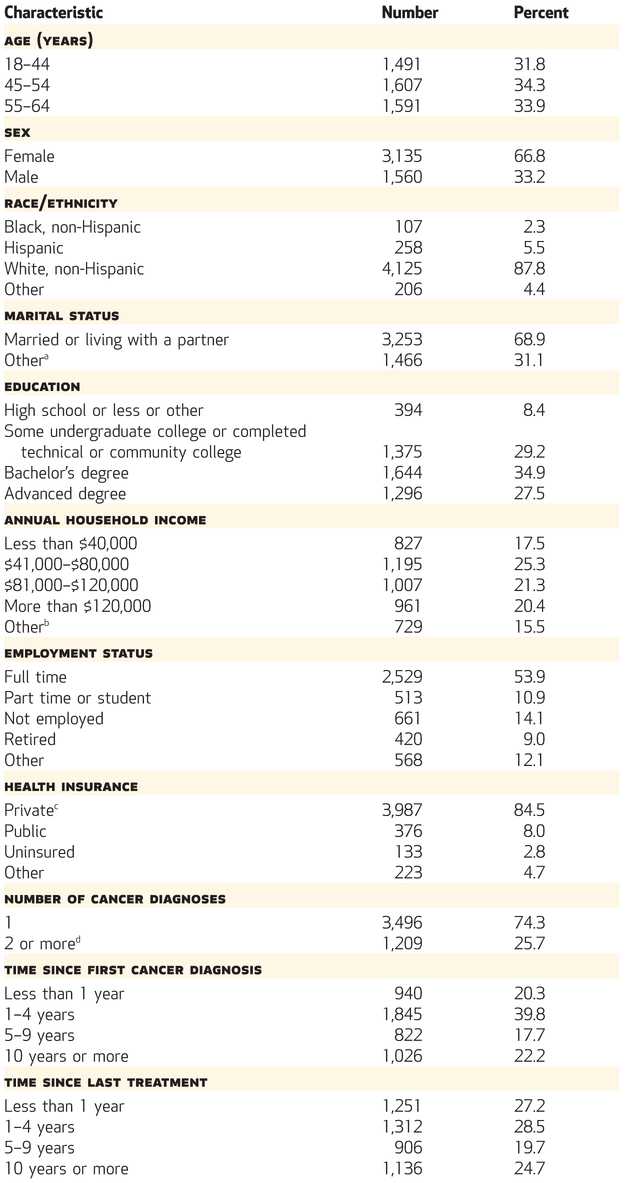
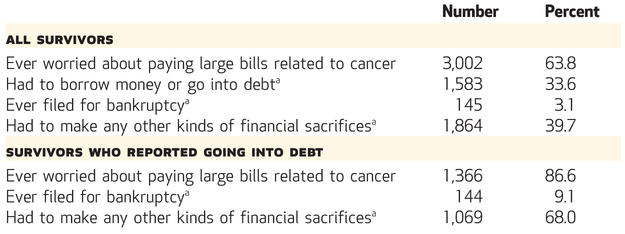
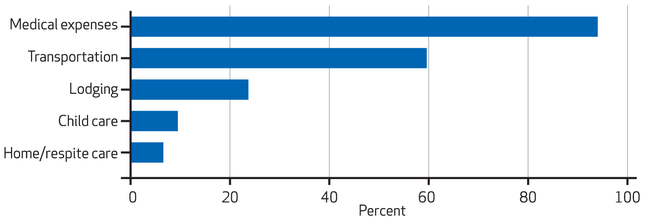
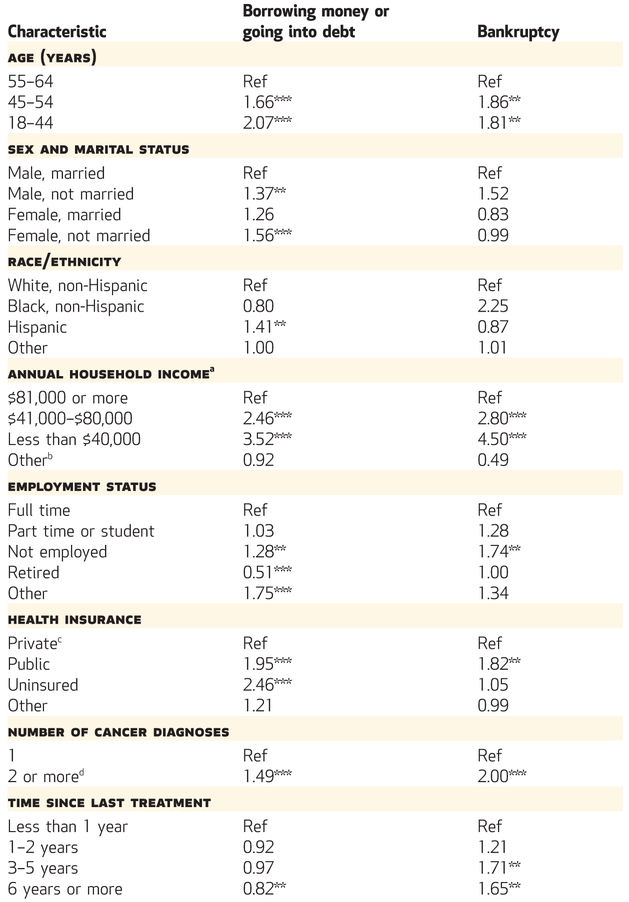
The rising medical costs associated with cancer have led to considerable financial hardship for patients and their families in the United States. Using data from the LIVESTRONG 2012 survey of 4,719 cancer survivors ages 18-64, we examined the proportions of survivors who reported going into debt or filing for bankruptcy as a result of cancer, as well as the amount of debt incurred. Approximately one-third of the survivors had gone into debt, and 3 percent had filed for bankruptcy. Of those who had gone into debt, 55 percent incurred obligations of $10,000 or more. Cancer survivors who were younger, had lower incomes, and had public health insurance were more likely to go into debt or file for bankruptcy, compared to those who were older, had higher incomes, and had private insurance, respectively. Future longitudinal population-based studies are needed to improve understanding of financial hardship among US working-age cancer survivors throughout the cancer care trajectory and, ultimately, to help stakeholders develop evidence-based interventions and policies to reduce the financial hardship of cancer.

Keywords: Bankrucpty; Cancer; Financial hardship; LIVESTRONG; Medical debt.


Figures

EXHIBIT 1
EXHIBIT 1
Characteristics Of 4,719 Cancer Survivors Ages 18–64, 2012 SOURCE Authors’ analysis of data from the LIVESTRONG 2012 survey. NOTE Percentages may not sum to 100 because of rounding. aPeople who were single, divorced, widowed, or separated; who preferred not to answer; and for whom answers were missing. bPeople who preferred not to answer or said they did not know. cPrivate, employer-based, or military insurance. dDiagnoses of one or more subsequent primary cancers or of recurrence of the first primary cancer.
EXHIBIT 2
EXHIBIT 2
Working-Age Cancer Survivors’ Responses To Survey Questions About Worry And Sacrifices, 2012 SOURCE Authors’ analysis of data from the LIVESTRONG 2012 survey. NOTES The numbers and percentages presented are those of the participants who responded “yes” to each question. For all survivors, N = 4,719. For survivors who reported going into debt, n = 1,583. aSurvey question included the phrase “because of your cancer, its treatment, or the lasting effects of that treatment?”
EXHIBIT 3
EXHIBIT 3
Types Of Out-Of-Pocket Spending Among Working-Age Cancer Survivors Who Reported Borrowing Money Or Going Into Debt Because Of Cancer, 2012 SOURCE Authors’ analysis of data from the LIVESTRONG 2012 survey. NOTES The percentages presented are those of the 1,583 participants who responded yes to the question, “Have you or has anyone in your family had to borrow money or go into debt because of your cancer, its treatment, or the lasting effects of that treatment?” and who had valid responses to the question, “Because of your cancer, its treatment, or the lasting effects of that treatment, did you have any out-of-pocket costs in the following categories?” Categories are not mutually exclusive. “Medical expenses” include physician copayments, medications, and durable medical equipment.
EXHIBIT 4
EXHIBIT 4
Working-Age Cancer Survivors’ Risk Factors For Borrowing Money, Going Into Debt, And Bankruptcy, By Various Characteristics, 2012 SOURCE Authors’ analysis of data from the LIVESTRONG 2012 survey. NOTES The exhibit shows the results of the final adjusted regression models. Associations between the two outcomes (borrowing money or going into debt and filing for bankruptcy) are based on the 4,504 participants who had valid values for each variable included in the final model. A version of this exhibit including 95% confidence intervals can be found in the Appendix (see Note 35 in text). Significance refers to the difference from the reference category. aFor the analyses, annual household income was recategorized as shown in the exhibit. bPeople who preferred not to answer or said they did not know. cPrivate, employer-based, or military insurance. dDiagnoses of one or more subsequent primary cancers or of recurrence of the first primary cancer. **p < 0.05 ***p < 0.001

References

    1. Institute of Medicine. Ensuring patient access to affordable cancer drugs: workshop summary Washington (DC): National Academies Press; 2014. - PubMed
    1. Mariotto AB, Yabroff KR, Shao Y, Feuer EJ, Brown ML. Projections of the cost of cancer care in the United States: 2010–2020. J Natl Cancer Inst. 2011;103(2):117–28. - PMC - PubMed
    1. Bach PB. Why drugs cost so much. New York Times. 2015. January 14.
    1. Young RA, DeVoe JE. Who will have health insurance in the future? An updated projection. Ann Fam Med. 2012;10(2):156–62. - PMC - PubMed
    1. Guy GP Jr, Ekwueme DU, Yabroff KR, Dowling EC, Li C, Rodriguez JL, et al. Economic burden of cancer survivorship among adults in the United States. J Clin Oncol. 2013; 31(30):3749–57. - PMC - PubMed

Publication types

MeSH terms

LinkOut - more resources