Comparative Study
. 2016 Jan;35(1):88-95.
doi: 10.1377/hlthaff.2015.0068.

Homicides In Mexico Reversed Life Expectancy Gains For Men And Slowed Them For Women, 2000-10

Affiliations
Comparative Study

Homicides In Mexico Reversed Life Expectancy Gains For Men And Slowed Them For Women, 2000-10

José Manuel Aburto et al. Health Aff (Millwood). 2016 Jan.

Abstract

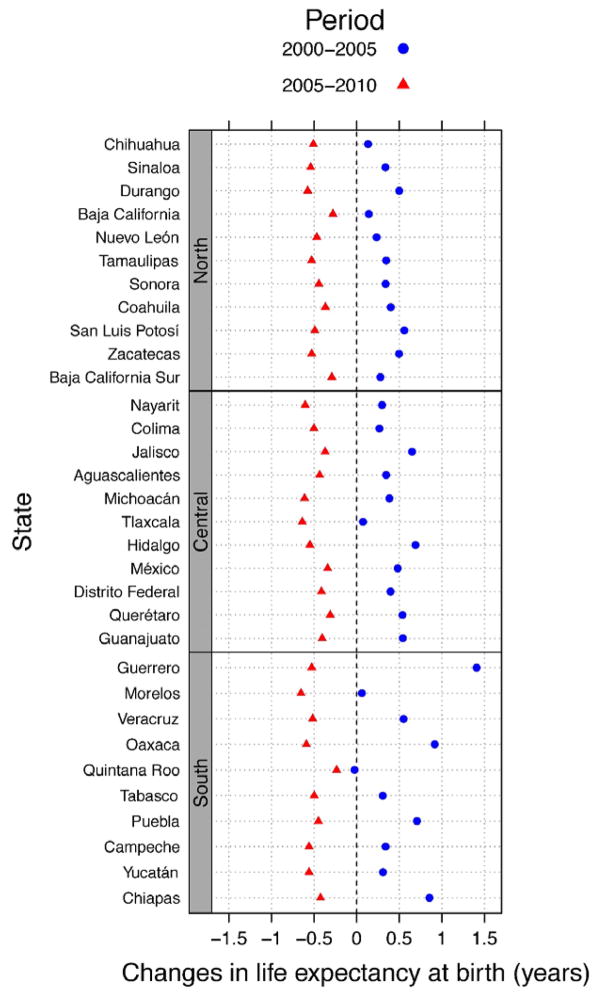
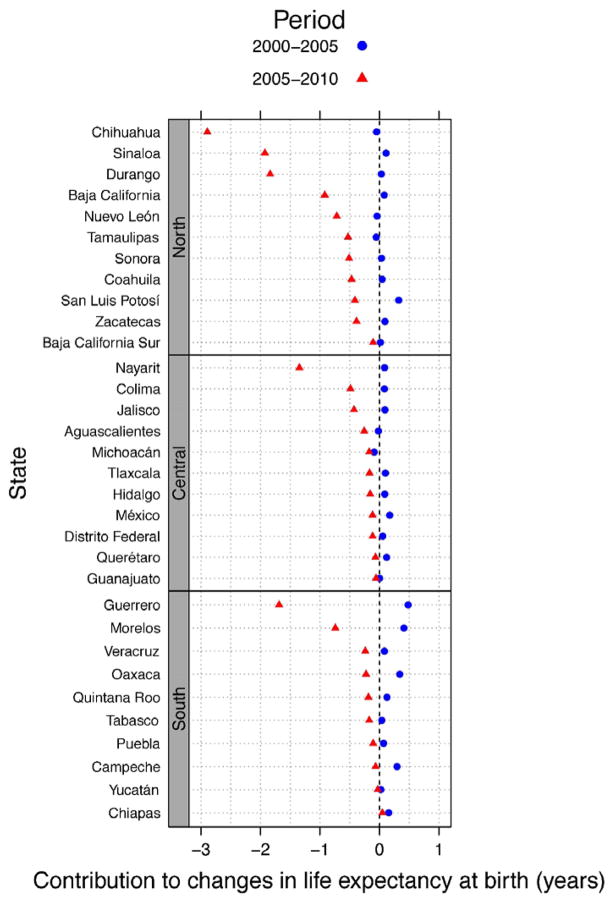
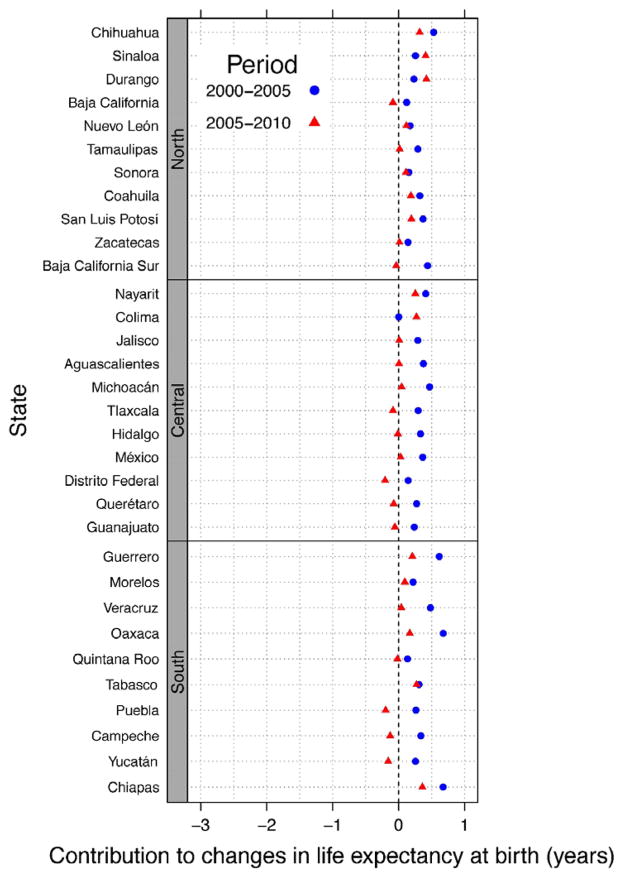
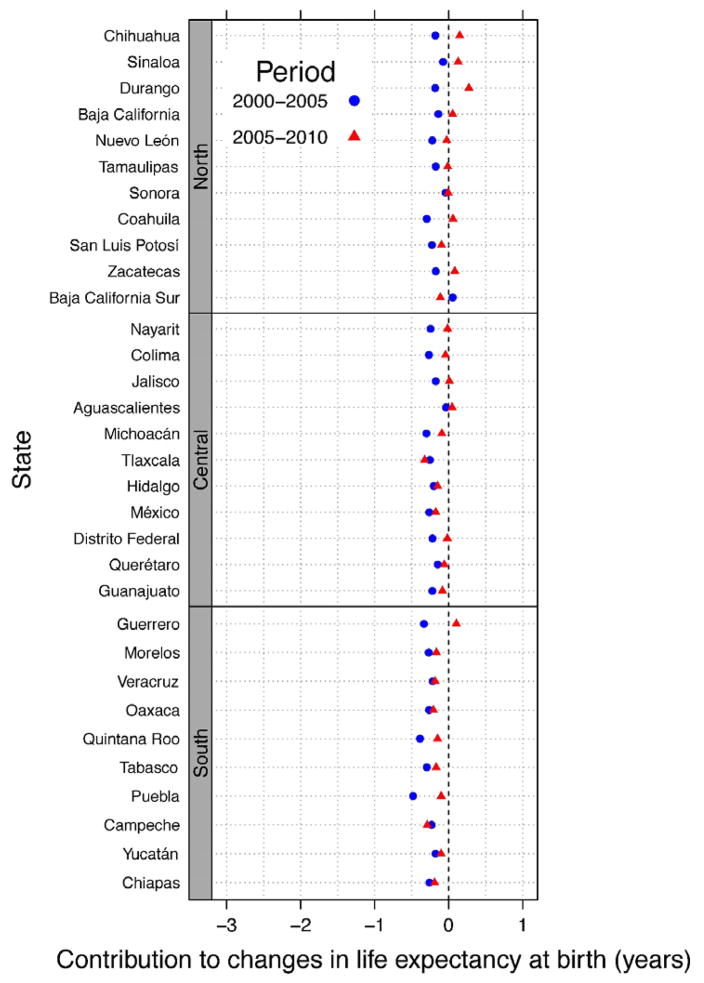
Life expectancy in Mexico increased for more than six decades but then stagnated in the period 2000-10. This decade was characterized by the enactment of a major health care reform-the implementation of the Seguro Popular de Salud (Popular Health Insurance), which was intended to provide coverage to the entire Mexican population-and by an unexpected increase in homicide mortality. We assessed the impact on life expectancy of conditions amenable to medical service-those sensitive to public health policies and changes in behaviors, homicide, and diabetes-by analyzing mortality trends at the state level. We found that life expectancy among males deteriorated from 2005 to 2010, compared to increases from 2000 to 2005. Females in most states experienced small gains in life expectancy between 2000 and 2010. The unprecedented rise in homicides after 2005 led to a reversal in life expectancy increases among males and a slowdown among females in most states in the first decade of the twenty-first century.

Keywords: Causes of death; Diabetes; Homicides; Life Expectancy; Mexico.


Figures

Figure 1
Figure 1
Changes In Male Life Expectancy At Birth In Mexico, By State And Period, From 2000 To 2005 And From 2005 To 2010 Source: Authors ’ calculations based on data from the Mexican Society of Demography (see Note 4 in text) and the National Institute of Statistics and Geography (see Note 13 in text). Notes: Within each region, the states are ordered according to the negative impact of homicide mortality on life expectancyin 2005 –10 (as shown in Figure 2). For example, in the north, Chihuahua experienced the highest loss in life expectancy due to homicide and Baja California Sur the lowest. Negative numbers indicate a decrease in life expectancy during the period.
Figure 2
Figure 2
Changes In Male Life Expectancy At Birth In Mexico Related To Homicide Mortality, By State And Period, From 2000 To 2005 And From 2005 To 2010 Source: Authors’ calculations based on data from the Mexican Society of Demography (see Note 4 in text) and the National Institute of Statistics and Geography (see Note 13 in text). Notes: The states are ordered according to the contribution of homicide mortality to life expectancy within region. Negative changes indicate that cause-specific mortality increased during the period, leading to a reduction in life expectancy. Conversely, positive changes indicate a decline in cause-specific mortality and an increase in life expectancy.
Figure 3
Figure 3
Changes In Male Life Expectancy At Birth In Mexico Related To Mortality Resulting From Causes Amenable To Medical Service, By State And Period, From 2000 To 2005 And From 2005 To 2010 Source: Authors ’ calculations based on data from the Mexican Society of Demography (see Note 4 in text) and the National Institute of Statistics and Geography (see Note 13 in text). Notes: The states are ordered according to the contribution of homicide mortality to life expectancy within region. Negative changes indicate that cause-specific mortality increased during the period, leading to a reduction in life expectancy. Conversely, positive changes indicate a decline in cause-specific mortality and an increase in life expectancy.
Figure 4
Figure 4
Changes In Male Life Expectancy At Birth In Mexico Related To Diabetes Mortality, By State And Period, From 2000 To 2005 And From 2005 To 2010 Source: Authors ’ calculations based on data from the Mexican Society of Demography (see Note 4 in text) and the National Institute of Statistics and Geography (see Note 13 in text). Notes: The states are ordered according to the contribution of homicide mortality to life expectancy within region. Negative changes indicate that cause-specific mortality increased during the period, leading to a reduction in life expectancy. Conversely, positive changes indicate a decline in cause-specific mortality and an increase in life expectancy.

References

    1. World Health Organization. The world health report 2000—health systems: improving performance [Internet] Geneva: WHO; 2000. [cited 2015 Nov 3]. Available from: http://www.who.int/whr/2000/en/
    1. United Nations Office on Drugs and Crime. Global study on homicide 2011 [Internet] Vienna: UNODC; 2011. [cited 2015 Nov 3]. Available from: https://www.unodc.org/documents/congress/background-information/Crime_St....
    1. Barquera S, Tovar-Guzmán V, Campos-Nonato I, González-Villalpando C, Rivera-Dommarco J. 2003 Geography of diabetes mellitus mortality in Mexico: an epidemiologic transition analysis. Arch Med Res. 2003;34(5):407–14. - PubMed
    1. Mexican Society of Demography. [Demographic reconciliation of Mexico and its states 1990–2010] Mexico City: SOMEDE-CONAPO; 2011. Conciliación demográfica de México y entidades federativas 1990–2010. Unpublished paper. Spanish.
    1. Canudas-Romo V, García-Guerrero VM, Echarri-Cánovas CJ. The stagnation of the Mexican male life expectancy in the first decade of the 21st century: the impact of homicides and diabetes mellitus. J Epidemiol Community Health. 2015;69(1):28–34. - PubMed

Publication types

MeSH terms