

Laminar Distribution of Phase-Amplitude Coupling of Spontaneous Current Sources and Sinks
- PMID: 26733778
- PMCID: PMC4686797
- DOI: 10.3389/fnins.2015.00454
Laminar Distribution of Phase-Amplitude Coupling of Spontaneous Current Sources and Sinks
Abstract
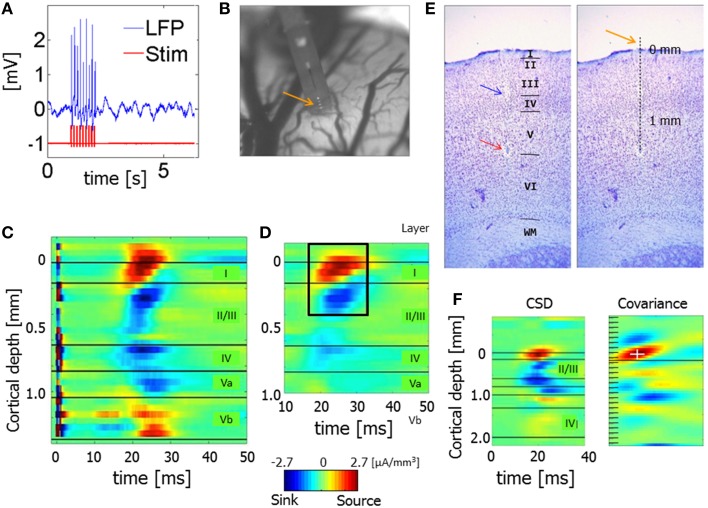
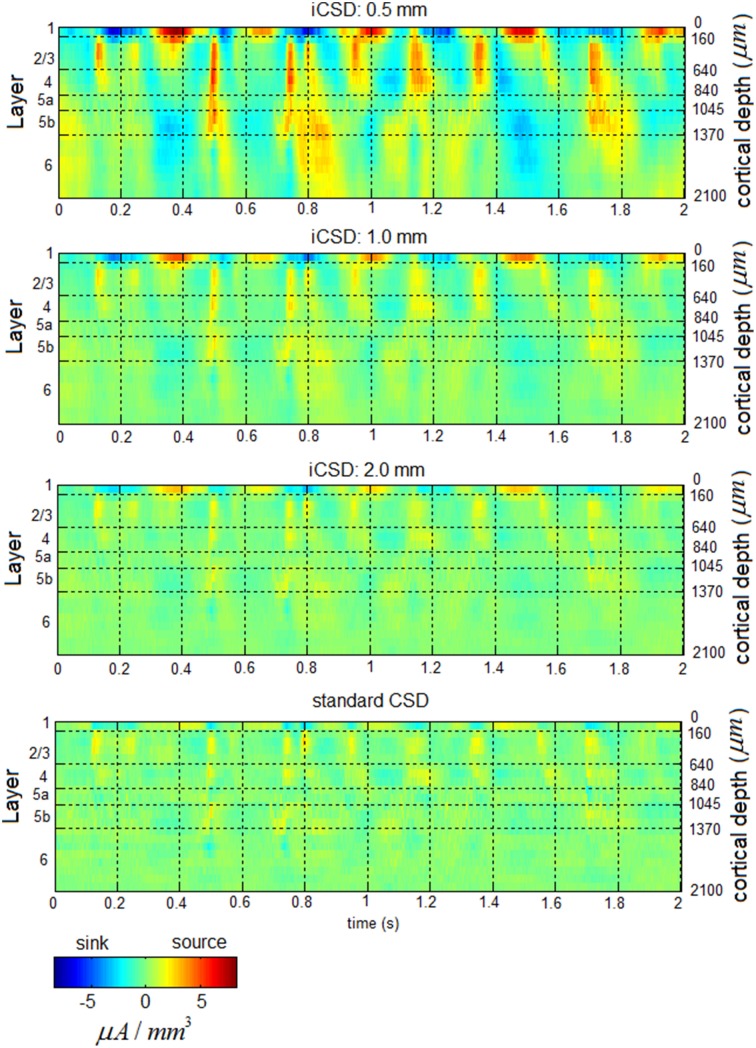
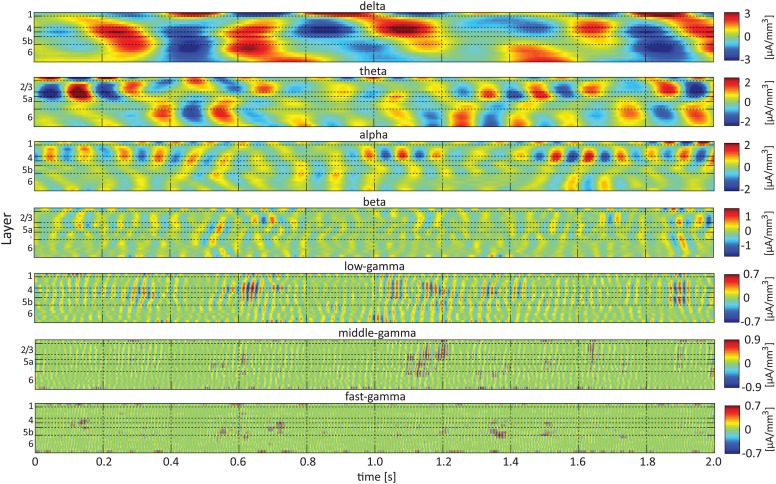
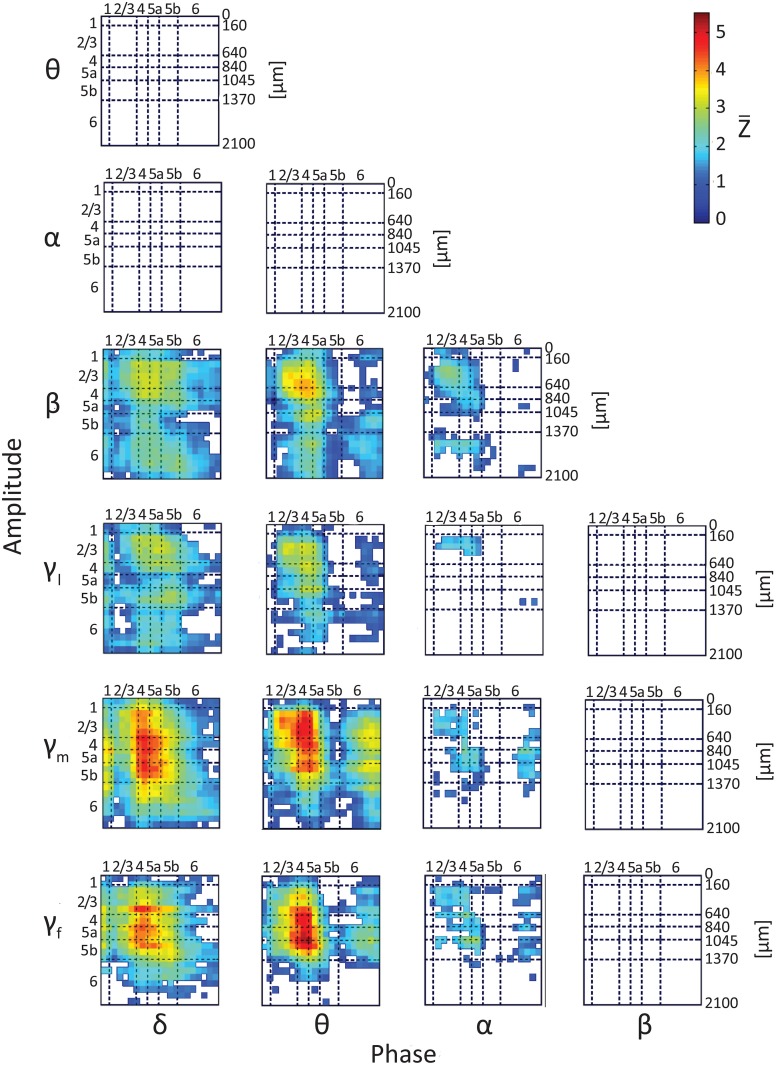
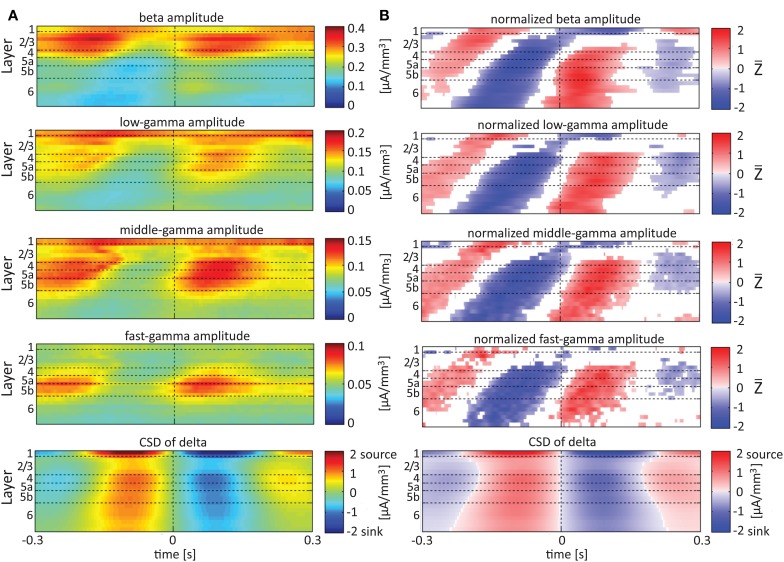
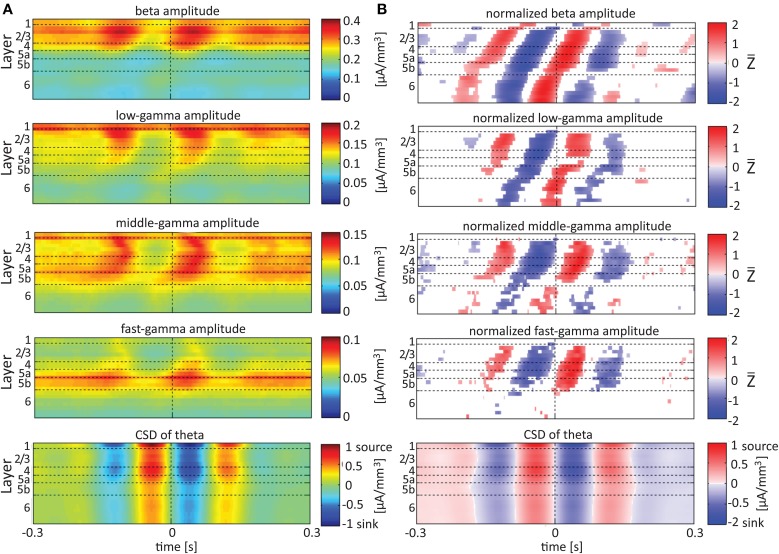
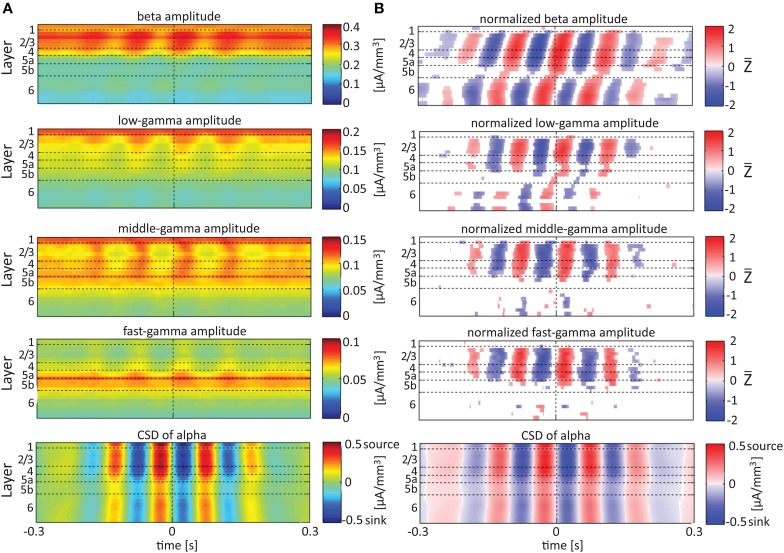
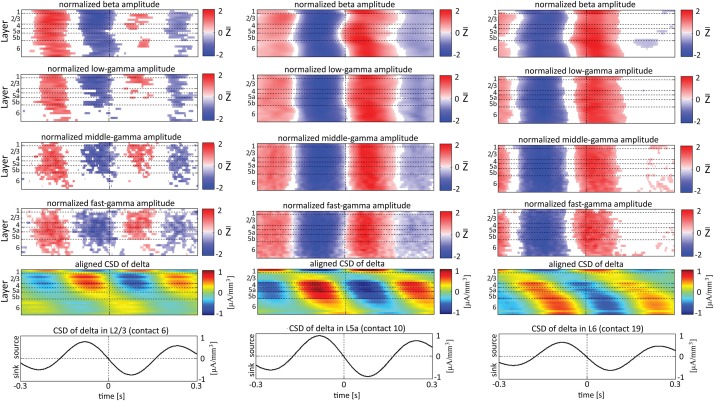
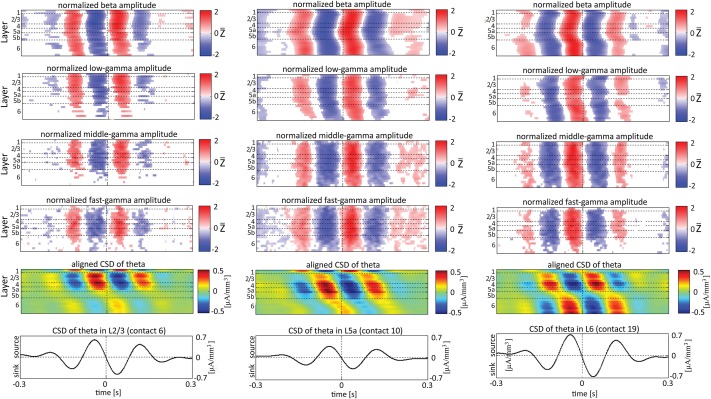
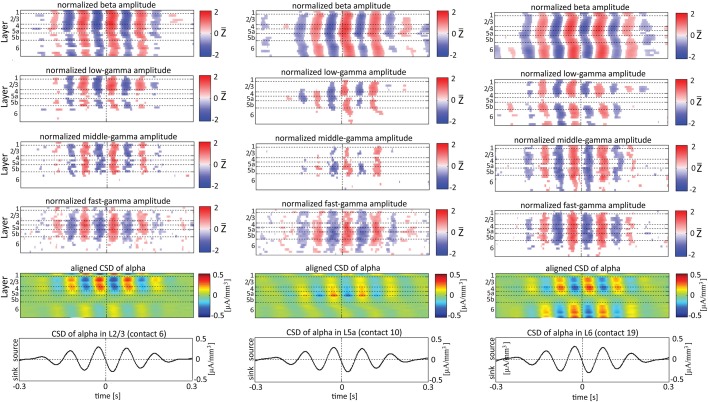
Although resting-state functional connectivity is a commonly used neuroimaging paradigm, the underlying mechanisms remain unknown. Thalamo-cortical and cortico-cortical circuits generate oscillations at different frequencies during spontaneous activity. However, it remains unclear how the various rhythms interact and whether their interactions are lamina-specific. Here we investigated intra- and inter-laminar spontaneous phase-amplitude coupling (PAC). We recorded local-field potentials using laminar probes inserted in the forelimb representation of rat area S1. We then computed time-series of frequency-band- and lamina-specific current source density (CSD), and PACs of CSD for all possible pairs of the classical frequency bands in the range of 1-150 Hz. We observed both intra- and inter-laminar spontaneous PAC. Of 18 possible combinations, 12 showed PAC, with the highest measures of interaction obtained for the pairs of the theta/gamma and delta/gamma bands. Intra- and inter-laminar PACs involving layers 2/3-5a were higher than those involving layer 6. Current sinks (sources) in the delta band were associated with increased (decreased) amplitudes of high-frequency signals in the beta to fast gamma bands throughout layers 2/3-6. Spontaneous sinks (sources) of the theta and alpha bands in layers 2/3-4 were on average linked to dipoles completed by sources (sinks) in layer 6, associated with high (low) amplitudes of the beta to fast-gamma bands in the entire cortical column. Our findings show that during spontaneous activity, delta, theta, and alpha oscillations are associated with periodic excitability, which for the theta and alpha bands is lamina-dependent. They further emphasize the differences between the function of layer 6 and that of the superficial layers, and the role of layer 6 in controlling activity in those layers. Our study links theories on the involvement of PAC in resting-state functional connectivity with previous work that revealed lamina-specific anatomical thalamo-cortico-cortical connections.
Keywords: cortical layers; cross-frequency coupling; current-source density (CSD); local-field potentials (LFP); phase-amplitude coupling; primary somatosensory cortex; resting state functional connectivity; spontaneous activity.
Figures
Similar articles
-
Microcircuitry of agranular frontal cortex: contrasting laminar connectivity between occipital and frontal areas.J Neurophysiol. 2015 May 1;113(9):3242-55. doi: 10.1152/jn.00624.2014. Epub 2015 Mar 4. J Neurophysiol. 2015. PMID: 25744881 Free PMC article.
-
Topology, Cross-Frequency, and Same-Frequency Band Interactions Shape the Generation of Phase-Amplitude Coupling in a Neural Mass Model of a Cortical Column.PLoS Comput Biol. 2016 Nov 1;12(11):e1005180. doi: 10.1371/journal.pcbi.1005180. eCollection 2016 Nov. PLoS Comput Biol. 2016. PMID: 27802274 Free PMC article.
-
Correlated inter-regional variations in low frequency local field potentials and resting state BOLD signals within S1 cortex of monkeys.Hum Brain Mapp. 2016 Aug;37(8):2755-66. doi: 10.1002/hbm.23207. Epub 2016 Apr 19. Hum Brain Mapp. 2016. PMID: 27091582 Free PMC article.
-
Phase correlation among rhythms present at different frequencies: spectral methods, application to microelectrode recordings from visual cortex and functional implications.Int J Psychophysiol. 1997 Jun;26(1-3):171-89. doi: 10.1016/s0167-8760(97)00763-0. Int J Psychophysiol. 1997. PMID: 9203002 Review.
-
Modeling the Generation of Phase-Amplitude Coupling in Cortical Circuits: From Detailed Networks to Neural Mass Models.Biomed Res Int. 2015;2015:915606. doi: 10.1155/2015/915606. Epub 2015 Oct 11. Biomed Res Int. 2015. PMID: 26539537 Free PMC article. Review.
Cited by
-
Assessing the Impact of Ih Conductance on Cross-Frequency Coupling in Model Pyramidal Neurons.Front Comput Neurosci. 2020 Sep 10;14:81. doi: 10.3389/fncom.2020.00081. eCollection 2020. Front Comput Neurosci. 2020. PMID: 33013344 Free PMC article.
-
Neural and metabolic basis of dynamic resting state fMRI.Neuroimage. 2018 Oct 15;180(Pt B):448-462. doi: 10.1016/j.neuroimage.2017.09.010. Epub 2017 Sep 9. Neuroimage. 2018. PMID: 28899744 Free PMC article. Review.
-
Lamina-specific cortical dynamics in human visual and sensorimotor cortices.Elife. 2018 Oct 22;7:e33977. doi: 10.7554/eLife.33977. Elife. 2018. PMID: 30346274 Free PMC article.
-
Delta-alpha/beta coupling as a signature of visual working memory in the prefrontal cortex.iScience. 2024 Jul 3;27(8):110453. doi: 10.1016/j.isci.2024.110453. eCollection 2024 Aug 16. iScience. 2024. PMID: 39108712 Free PMC article.
-
Laminar Profile of Auditory Steady-State Response in the Auditory Cortex of Awake Mice.Front Syst Neurosci. 2021 Mar 19;15:636395. doi: 10.3389/fnsys.2021.636395. eCollection 2021. Front Syst Neurosci. 2021. PMID: 33815073 Free PMC article.
References
-
- Alonso-Nanclares L., Gonzalez-Soriano J., Ghobril J.-P., Meystre J., Muller E., Reimann M., et al. (2012). A unifying model of the neocortical column: dimensions, layers, cell types and densities, in Program No. 268.03/DD1. Neuroscience Meeting Planner. (New Orleans, LA: Society for Neuroscience; ).
-
- Benjamini Y., Hochberg Y. (1995). Controlling the false discovery rate: a practical and powerful approach to multiple testing. J. R. Stat. Soc. B 57, 289–300.
LinkOut - more resources
Full Text Sources
Other Literature Sources